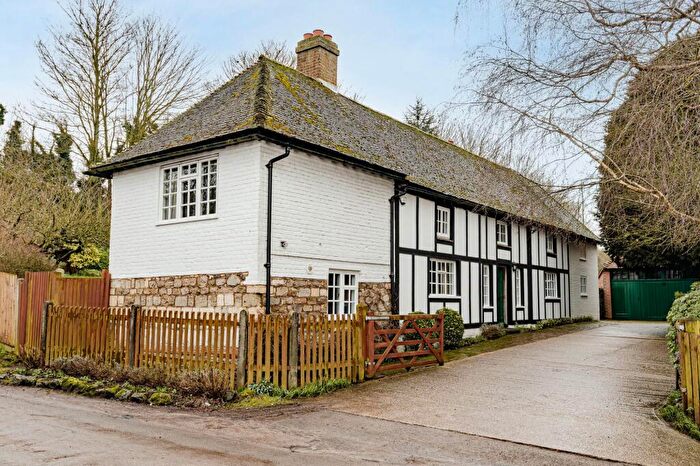
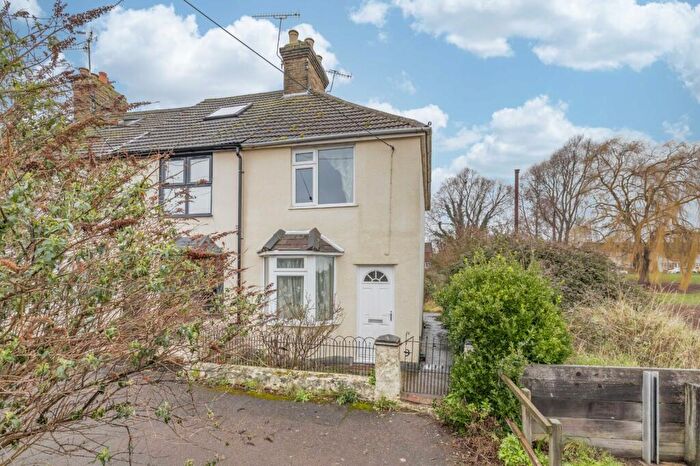
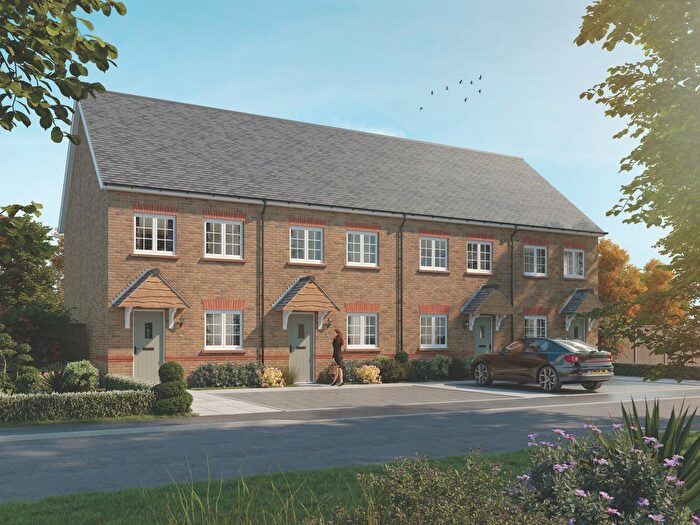
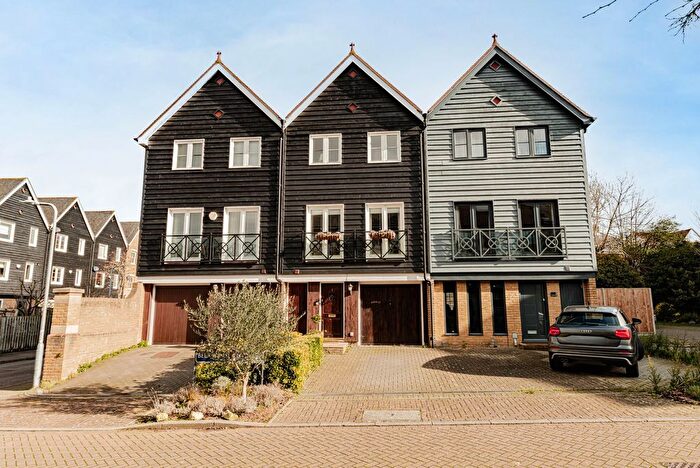
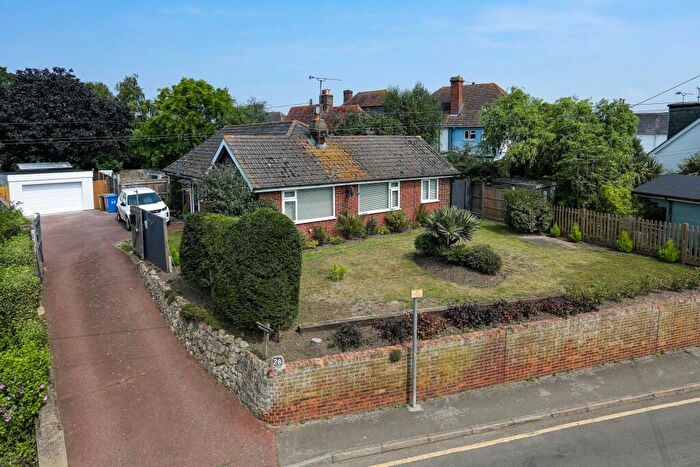
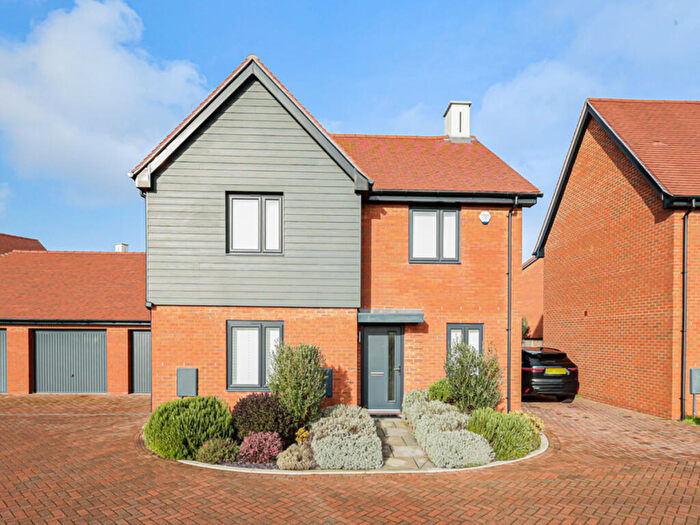
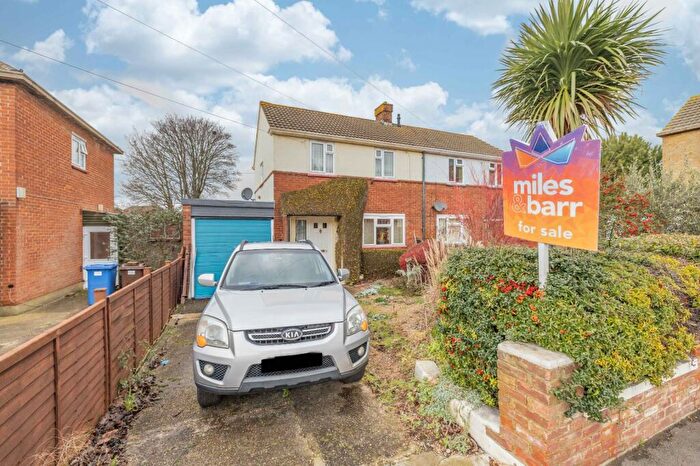
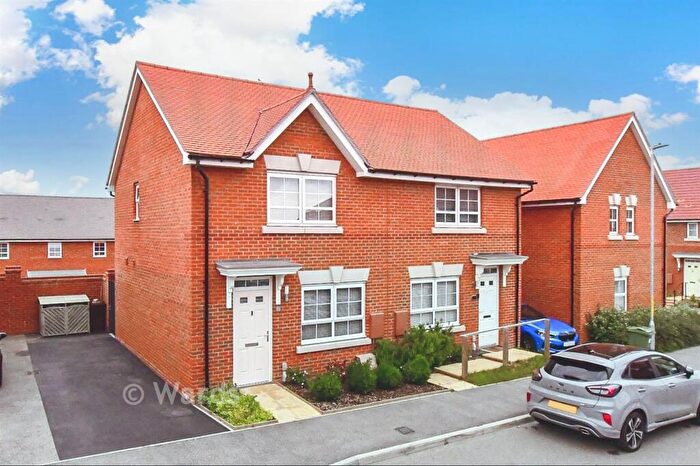
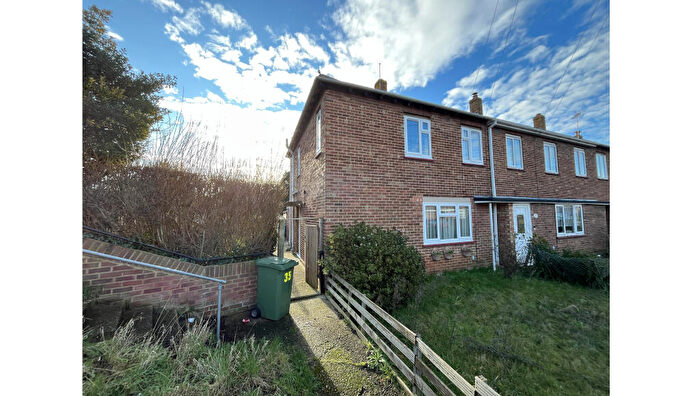
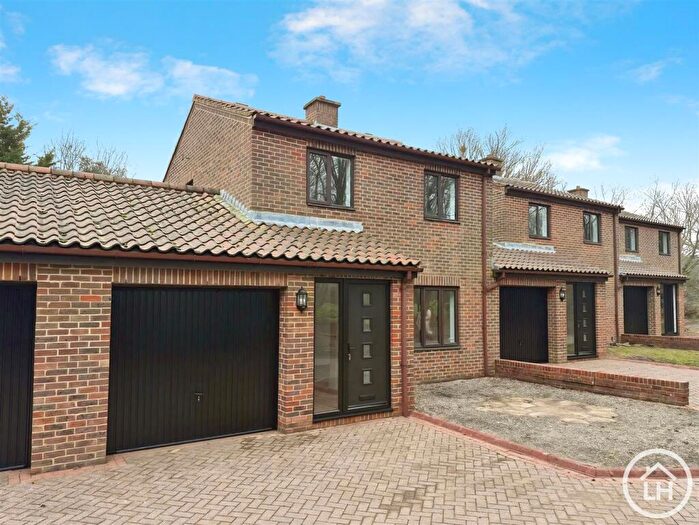
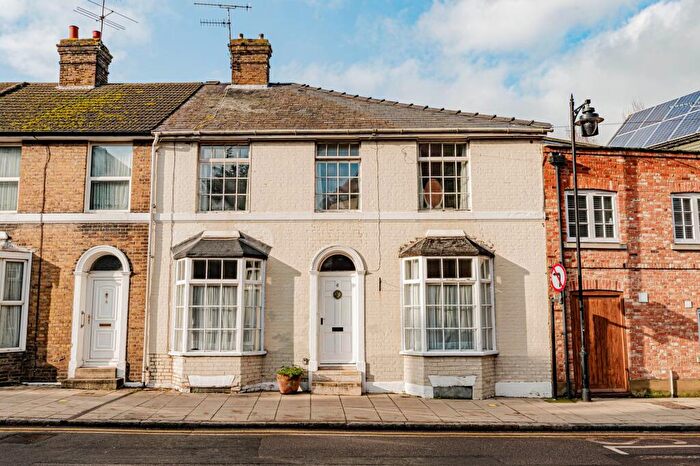
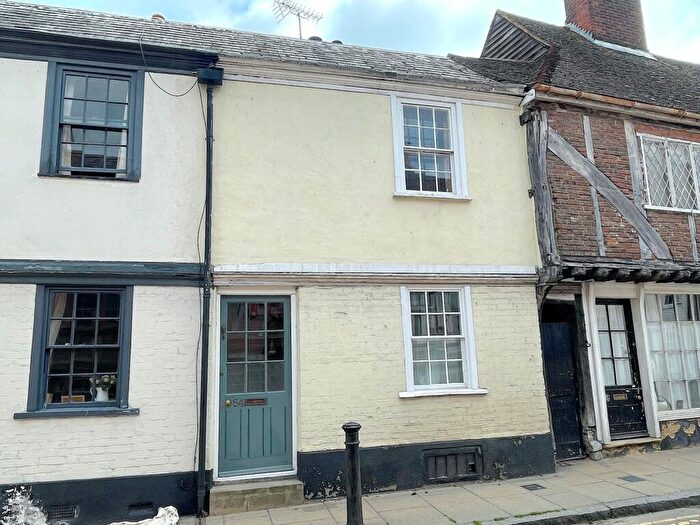
Houses for sale & to rent in Teynham And Lynsted, Faversham
House Prices in Teynham And Lynsted
Properties in Teynham And Lynsted have an average house price of £447,321.00 and had 14 Property Transactions within the last 3 years¹.
Teynham And Lynsted is an area in Faversham, Kent with 350 households², where the most expensive property was sold for £800,000.00.
Properties for sale in Teynham And Lynsted
Roads and Postcodes in Teynham And Lynsted
Navigate through our locations to find the location of your next house in Teynham And Lynsted, Faversham for sale or to rent.
| Streets | Postcodes |
|---|---|
| Bennetts Gardens | ME13 0TP |
| Buckland | ME13 0TW |
| Bysing Wood Road | ME13 0TB ME13 0TD |
| Cherry Drive | ME13 0TG |
| Church Road | ME13 0QA ME13 0QB |
| Colegates Close | ME13 0QQ |
| Colegates Court | ME13 0QN |
| Colegates Road | ME13 0QJ |
| Elverton Cottages | ME13 0TL |
| Faversham Road | ME13 0SE |
| Four Oaks Cottages | ME13 0TR |
| Harrison Terrace | ME13 0QL |
| Harty Ferry Cottages | ME13 0QD |
| London Road | ME13 0SY ME13 0SZ ME13 0SX |
| Mount Pleasant | ME13 0PZ |
| Provender Lane | ME13 0SL ME13 0SN ME13 0ST ME13 0SU ME13 0SJ |
| Rushett Lane | ME13 0SG ME13 0SQ |
| Russell Place | ME13 0QF |
| Syndale Valley | ME13 0RP |
| The Street | ME13 0PY ME13 0QE ME13 0QH |
| The Trefoil | ME13 0SW |
| Uplees Road | ME13 0QR ME13 0QT ME13 0QU |
| Uplees Villas | ME13 0QS |
| Wrens Hill | ME13 0SH |
| ME13 0TE ME13 0TJ ME13 0TQ ME13 0TH ME13 0TN |
Transport near Teynham And Lynsted
- FAQ
- Price Paid By Year
- Property Type Price
Frequently asked questions about Teynham And Lynsted
What is the average price for a property for sale in Teynham And Lynsted?
The average price for a property for sale in Teynham And Lynsted is £447,321. This amount is 19% higher than the average price in Faversham. There are 2,192 property listings for sale in Teynham And Lynsted.
What streets have the most expensive properties for sale in Teynham And Lynsted?
The streets with the most expensive properties for sale in Teynham And Lynsted are Buckland at an average of £800,000, The Trefoil at an average of £717,500 and London Road at an average of £555,000.
What streets have the most affordable properties for sale in Teynham And Lynsted?
The streets with the most affordable properties for sale in Teynham And Lynsted are Russell Place at an average of £280,000, The Street at an average of £285,000 and Colegates Close at an average of £335,000.
Which train stations are available in or near Teynham And Lynsted?
Some of the train stations available in or near Teynham And Lynsted are Faversham, Teynham and Selling.
Property Price Paid in Teynham And Lynsted by Year
The average sold property price by year was:
| Year | Average Sold Price | Price Change |
Sold Properties
|
|---|---|---|---|
| 2025 | £500,000 | 9% |
5 Properties |
| 2024 | £457,083 | 26% |
6 Properties |
| 2023 | £340,000 | 12% |
3 Properties |
| 2022 | £297,909 | -15% |
11 Properties |
| 2021 | £342,937 | 4% |
24 Properties |
| 2020 | £328,772 | -43% |
11 Properties |
| 2019 | £471,016 | 40% |
15 Properties |
| 2018 | £282,050 | -36% |
13 Properties |
| 2017 | £382,208 | 2% |
12 Properties |
| 2016 | £376,416 | 20% |
12 Properties |
| 2015 | £301,991 | -0,1% |
12 Properties |
| 2014 | £302,375 | 35% |
8 Properties |
| 2013 | £197,750 | -91% |
8 Properties |
| 2012 | £377,687 | 48% |
8 Properties |
| 2011 | £196,700 | -27% |
6 Properties |
| 2010 | £250,650 | -20% |
10 Properties |
| 2009 | £302,025 | -14% |
10 Properties |
| 2008 | £344,562 | 39% |
16 Properties |
| 2007 | £211,657 | -18% |
19 Properties |
| 2006 | £249,941 | 22% |
17 Properties |
| 2005 | £194,214 | -43% |
14 Properties |
| 2004 | £277,150 | 42% |
10 Properties |
| 2003 | £159,531 | 1% |
16 Properties |
| 2002 | £157,576 | 22% |
13 Properties |
| 2001 | £122,747 | 23% |
20 Properties |
| 2000 | £93,902 | -1% |
16 Properties |
| 1999 | £94,892 | 15% |
14 Properties |
| 1998 | £80,966 | 1% |
15 Properties |
| 1997 | £80,135 | 19% |
7 Properties |
| 1996 | £65,150 | -15% |
18 Properties |
| 1995 | £74,936 | - |
8 Properties |
Property Price per Property Type in Teynham And Lynsted
Here you can find historic sold price data in order to help with your property search.
The average Property Paid Price for specific property types in the last three years are:
| Property Type | Average Sold Price | Sold Properties |
|---|---|---|
| Detached House | £625,416.00 | 6 Detached Houses |
| Semi Detached House | £318,000.00 | 5 Semi Detached Houses |
| Terraced House | £306,666.00 | 3 Terraced Houses |

