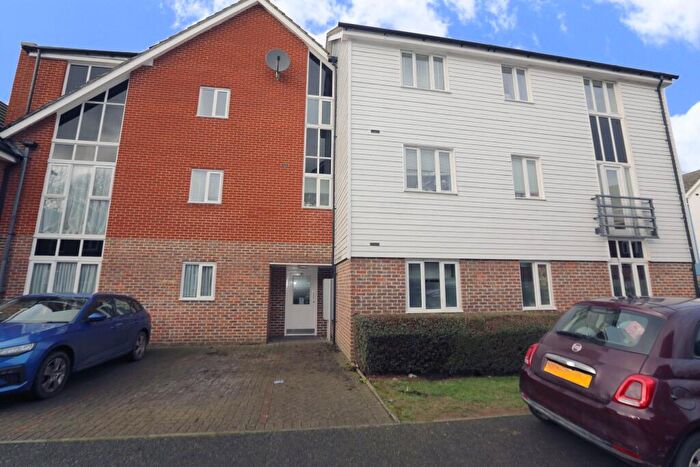
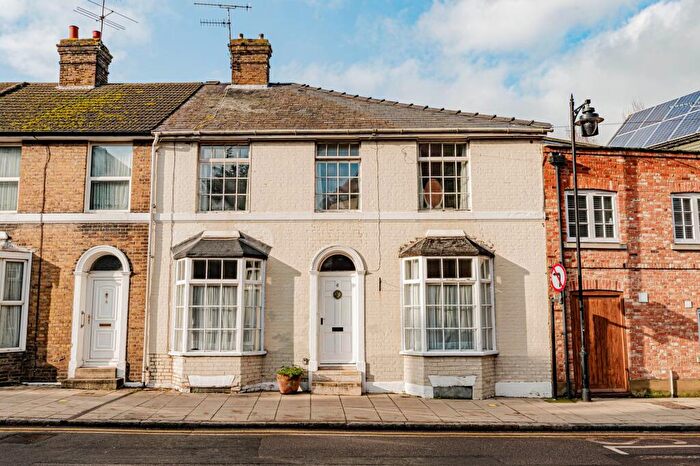
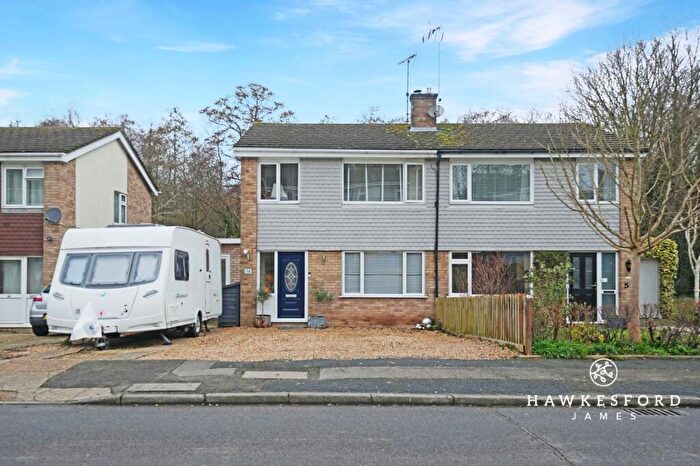
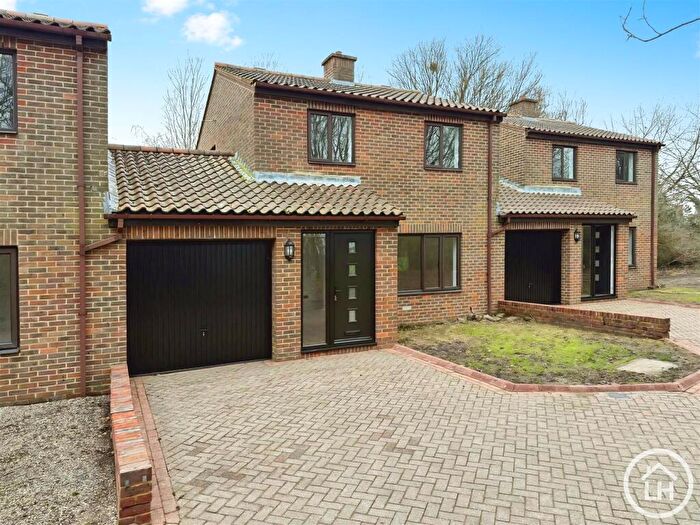
Houses for sale & to rent in Faversham, Kent
House Prices in Faversham
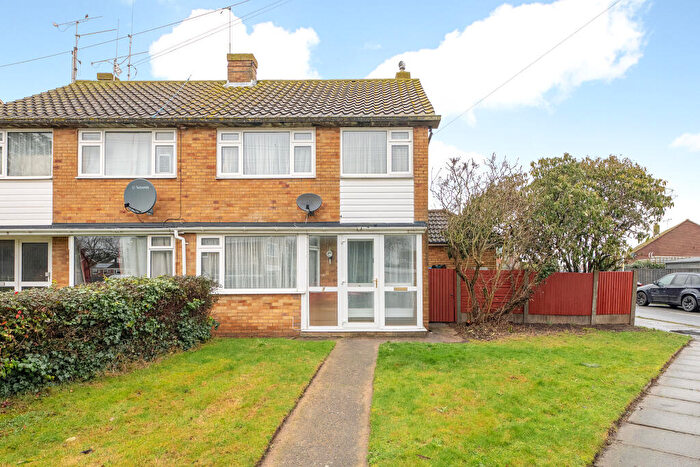
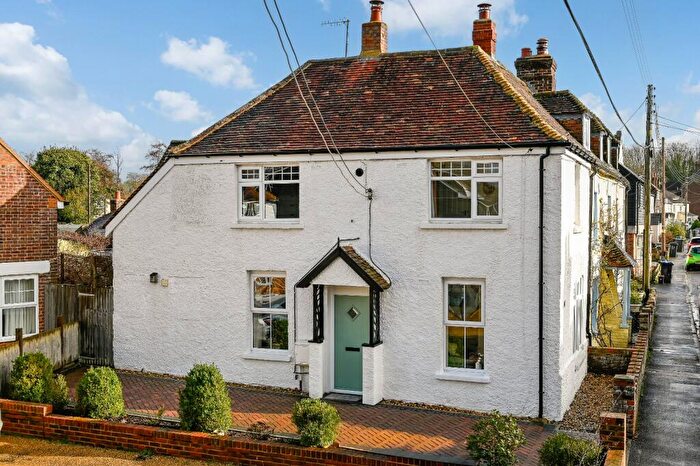
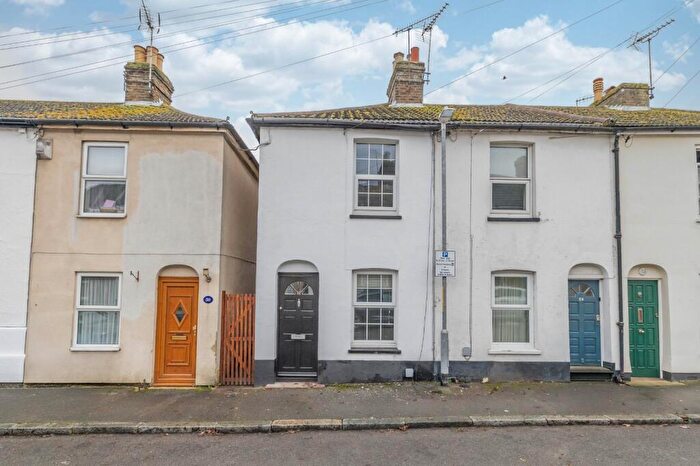
Properties in Faversham have an average house price of £374,900.00 and had 1,032 Property Transactions within the last 3 years.¹
Faversham is an area in Kent with 11,751 households², where the most expensive property was sold for £1,825,000.00.
Properties for sale in Faversham
Neighbourhoods in Faversham
Navigate through our locations to find the location of your next house in Faversham, Kent for sale or to rent.
Transport in Faversham
Please see below transportation links in this area:
- FAQ
- Price Paid By Year
- Property Type Price
Frequently asked questions about Faversham
What is the average price for a property for sale in Faversham?
The average price for a property for sale in Faversham is £374,900. This amount is 4% lower than the average price in Kent. There are 7,426 property listings for sale in Faversham.
What locations have the most expensive properties for sale in Faversham?
The locations with the most expensive properties for sale in Faversham are East Downs at an average of £667,394, Charing at an average of £550,000 and Teynham And Lynsted at an average of £447,321.
What locations have the most affordable properties for sale in Faversham?
The locations with the most affordable properties for sale in Faversham are Abbey at an average of £313,954, Davington Priory at an average of £325,256 and St Anns at an average of £332,324.
Which train stations are available in or near Faversham?
Some of the train stations available in or near Faversham are Faversham, Selling and Teynham.
Property Price Paid in Faversham by Year
The average sold property price by year was:
| Year | Average Sold Price | Price Change |
Sold Properties
|
|---|---|---|---|
| 2025 | £376,088 | 1% |
358 Properties |
| 2024 | £373,148 | -1% |
388 Properties |
| 2023 | £375,789 | 1% |
286 Properties |
| 2022 | £372,942 | 2% |
464 Properties |
| 2021 | £367,034 | 6% |
678 Properties |
| 2020 | £344,986 | 2% |
543 Properties |
| 2019 | £339,402 | 3% |
466 Properties |
| 2018 | £330,055 | 10% |
410 Properties |
| 2017 | £296,906 | 3% |
440 Properties |
| 2016 | £286,684 | 11% |
412 Properties |
| 2015 | £255,876 | 6% |
503 Properties |
| 2014 | £241,227 | 4% |
551 Properties |
| 2013 | £232,041 | 7% |
480 Properties |
| 2012 | £216,478 | 2% |
385 Properties |
| 2011 | £211,522 | -1% |
354 Properties |
| 2010 | £214,168 | 12% |
373 Properties |
| 2009 | £188,179 | -21% |
521 Properties |
| 2008 | £227,577 | 9% |
405 Properties |
| 2007 | £207,815 | 2% |
626 Properties |
| 2006 | £204,345 | 7% |
696 Properties |
| 2005 | £190,471 | -2% |
479 Properties |
| 2004 | £194,557 | 13% |
550 Properties |
| 2003 | £168,342 | 16% |
559 Properties |
| 2002 | £142,089 | 18% |
631 Properties |
| 2001 | £116,778 | 9% |
642 Properties |
| 2000 | £106,642 | 17% |
521 Properties |
| 1999 | £88,943 | 12% |
592 Properties |
| 1998 | £78,701 | 3% |
517 Properties |
| 1997 | £76,395 | 6% |
583 Properties |
| 1996 | £71,654 | 10% |
488 Properties |
| 1995 | £64,369 | - |
434 Properties |
Property Price per Property Type in Faversham
Here you can find historic sold price data in order to help with your property search.
The average Property Paid Price for specific property types in the last three years are:
| Property Type | Average Sold Price | Sold Properties |
|---|---|---|
| Semi Detached House | £372,327.00 | 288 Semi Detached Houses |
| Terraced House | £328,218.00 | 420 Terraced Houses |
| Detached House | £585,764.00 | 195 Detached Houses |
| Flat | £213,884.00 | 129 Flats |

