
Houses for sale in Swanscombe, Gravesend
House Prices in Swanscombe
Properties in Swanscombe have an average house price of £239k and had 28 Property Transactions within the last 3 years¹.
Swanscombe is an area in Gravesend, Kent with 397 households², where the most expensive property was sold for £410k.
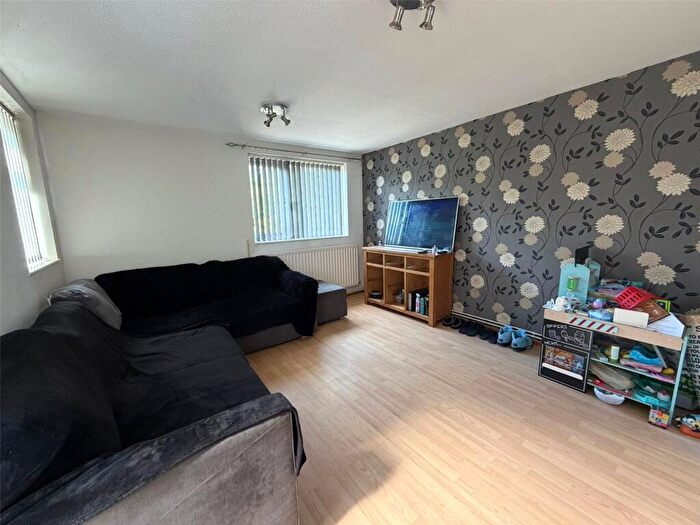
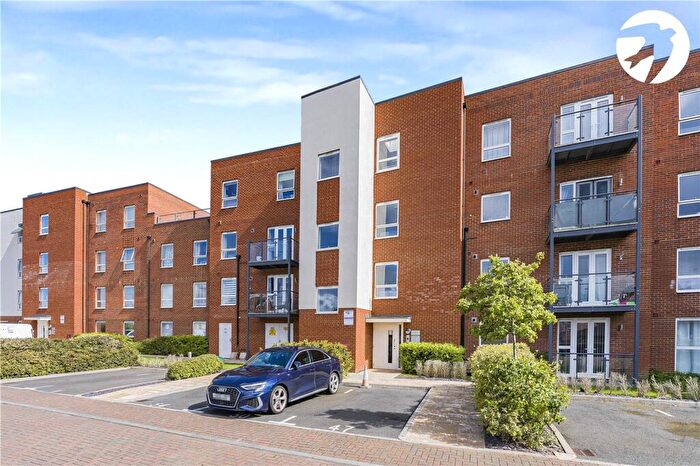
Properties for sale in Swanscombe
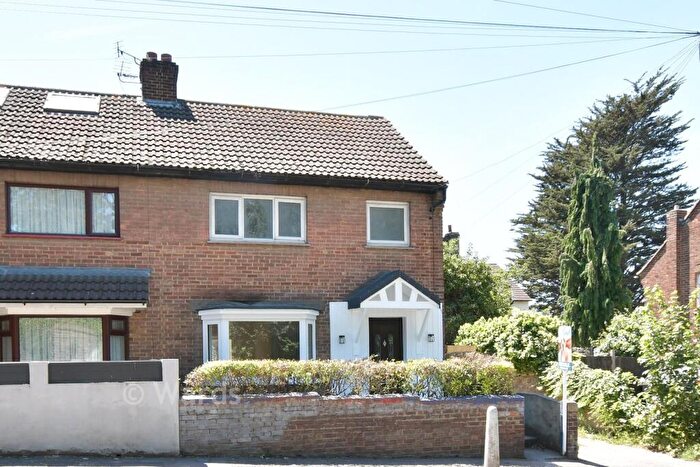
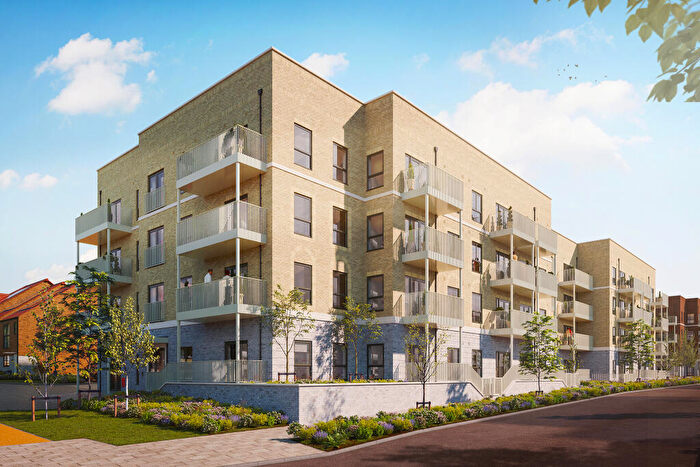
![]()
If you are looking to sell your house, let it out, or receive a property valuation, an expert can help you.
Click the button below to get started.
Roads and Postcodes in Swanscombe
Navigate through our locations to find the location of your next house in Swanscombe, Gravesend for sale or to rent.
| Streets | Postcodes |
|---|---|
| Black Eagle Drive | DA11 9AH DA11 9AJ DA11 9AP DA11 9AQ DA11 9AW DA11 9AZ |
| Galley Hill Road | DA11 9BH |
| Robinson Way | DA11 9AB |
| Snowden Hill | DA11 9AE |
| Taunton Road | DA11 9BY |
Property price trends in Swanscombe
According to the latest Land Registry data, the average home in Swanscombe sold for £164,000 in 2026. That figure comes from 539 sales logged over the past 31 years.
Prices have fallen back over the last three years. Compared with 2023, when the typical sale came in around £248,363, that's a fall of roughly 34%.
Looking back five years, average prices are down about 25.2% since 2021, a drop of around £55,121 in cash terms.
Zoom out to the past decade for the fuller picture. Back in 2016, homes here averaged £186,187, so the typical sold price has fallen about 11.9% since then, around 1.3% a year lower. Stretch the view to fifteen years and that annual pace edges up closer to 3.6%.
Frequently asked questions about Swanscombe
What is the average price for a property for sale in Swanscombe?
The average price for a property for sale in Swanscombe is £238,535. This amount is 35% lower than the average price in Gravesend. There are 626 property listings for sale in Swanscombe.
What streets have the most expensive properties for sale in Swanscombe?
The streets with the most expensive properties for sale in Swanscombe are Snowden Hill at an average of £325,000, Robinson Way at an average of £316,250 and Taunton Road at an average of £229,400.
What streets have the most affordable properties for sale in Swanscombe?
The streets with the most affordable properties for sale in Swanscombe are Black Eagle Drive at an average of £191,363 and Galley Hill Road at an average of £198,500.
Which train stations are available in or near Swanscombe?
Some of the train stations available in or near Swanscombe are Northfleet, Swanscombe and Ebbsfleet International.
Property Price Paid in Swanscombe by Year
The average sold property price by year was:
| Year | Average Sold Price | Price Change |
Sold Properties
|
|---|---|---|---|
| 2026 | £164,000 | -44% |
2 Properties |
| 2025 | £236,166 | -4% |
6 Properties |
| 2024 | £244,666 | -2% |
9 Properties |
| 2023 | £248,363 | -5% |
11 Properties |
| 2022 | £261,017 | 16% |
14 Properties |
| 2021 | £219,121 | 5% |
19 Properties |
| 2020 | £208,961 | 2% |
13 Properties |
| 2019 | £204,535 | 3% |
14 Properties |
| 2018 | £198,659 | -3% |
22 Properties |
| 2017 | £205,160 | 9% |
25 Properties |
Property Price per Property Type in Swanscombe
Here you can find historic sold price data in order to help with your property search.
The average Property Paid Price for specific property types in the last three years are:
| Property Type | Average Sold Price | Sold Properties |
|---|---|---|
| Semi Detached House | £212,000.00 | 1 Semi Detached House |
| Terraced House | £298,500.00 | 12 Terraced Houses |
| Flat | £192,333.00 | 15 Flats |
