
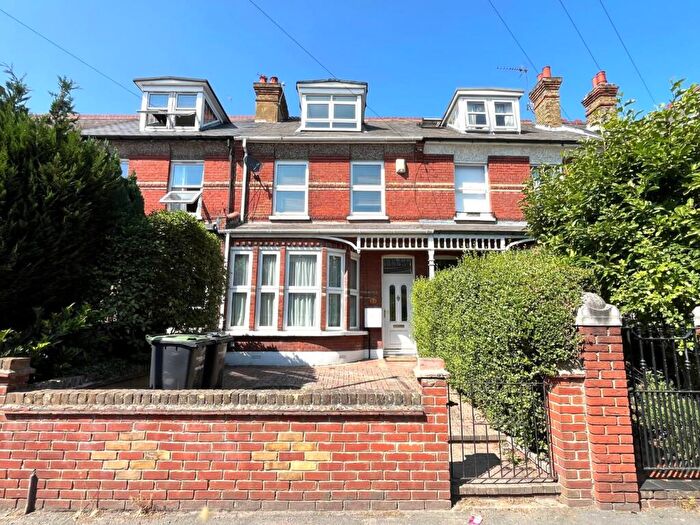
Houses for sale in Northfleet North, Gravesend
House Prices in Northfleet North
Properties in Northfleet North have an average house price of £270k and had 237 Property Transactions within the last 3 years¹.
Northfleet North is an area in Gravesend, Kent with 3,208 households², where the most expensive property was sold for £550k.
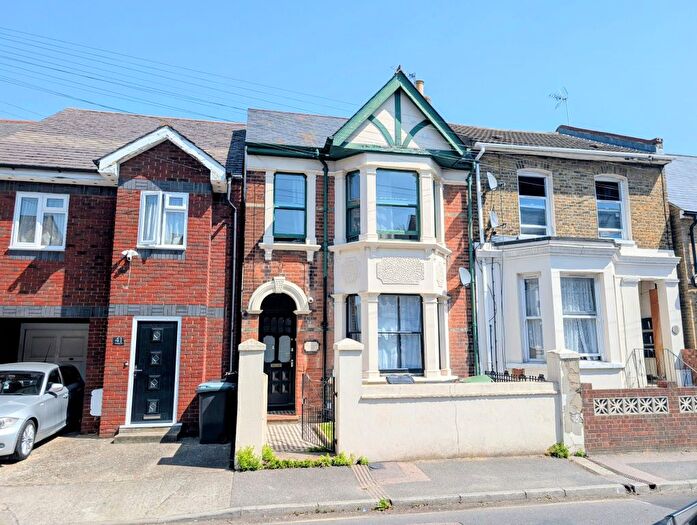
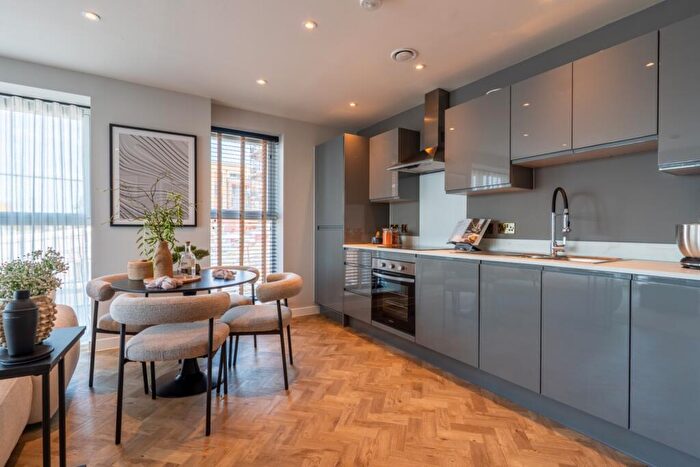
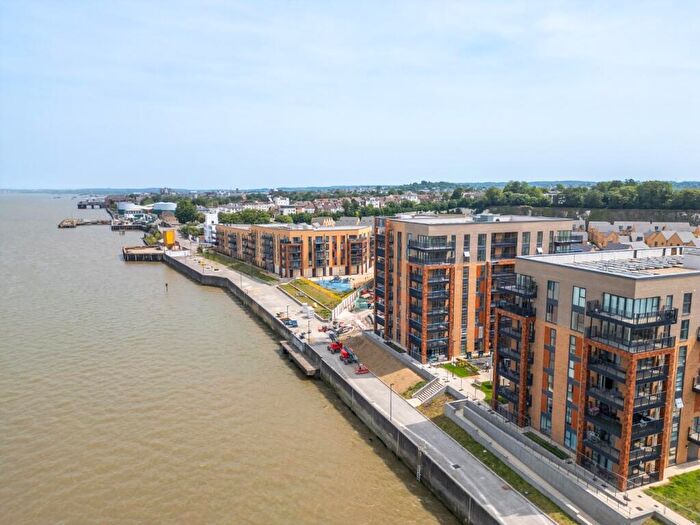
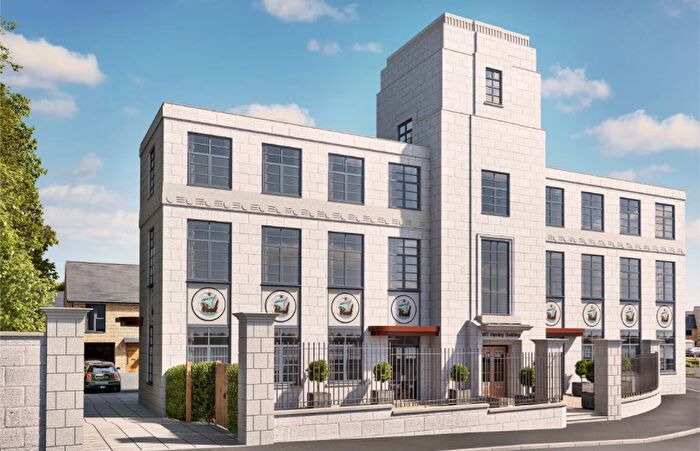
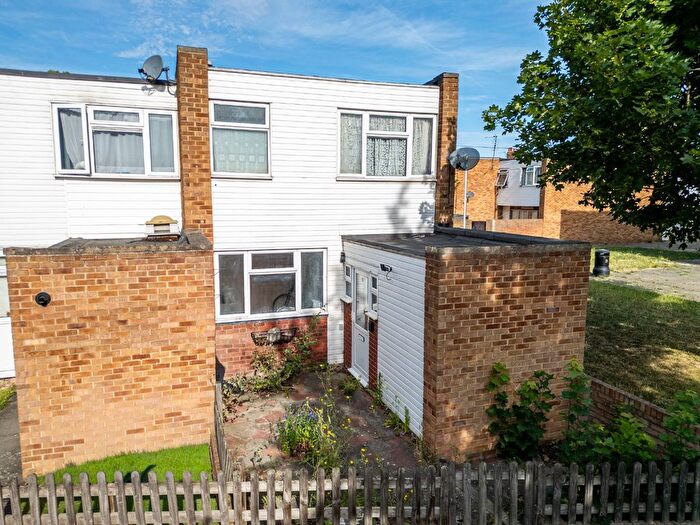
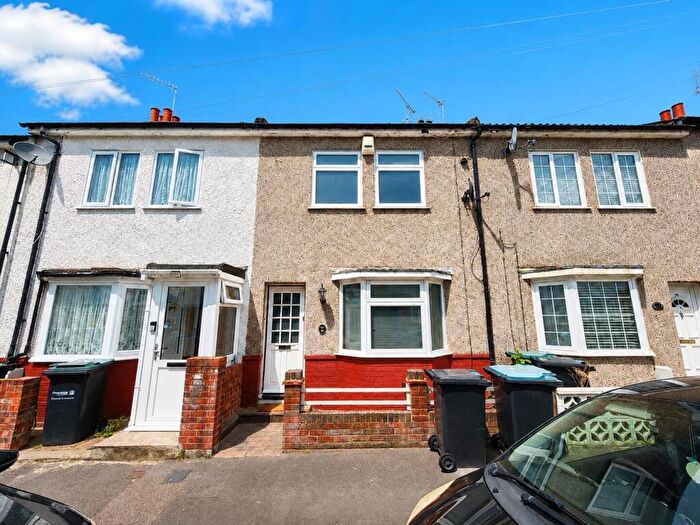
Properties for sale in Northfleet North

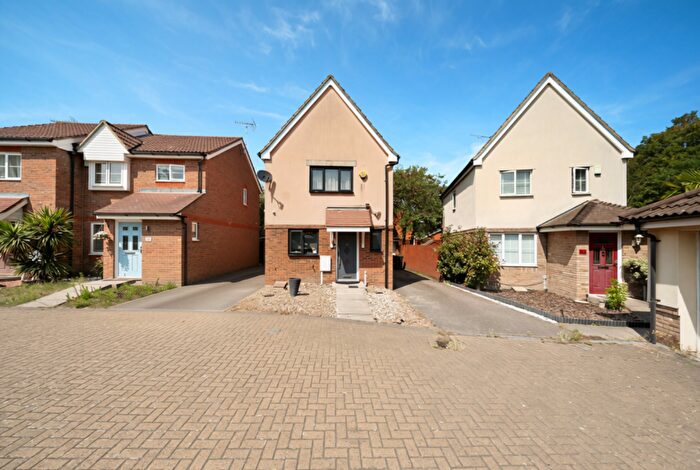

![]()
If you are looking to sell your house, let it out, or receive a property valuation, an expert can help you.
Click the button below to get started.


Roads and Postcodes in Northfleet North
Navigate through our locations to find the location of your next house in Northfleet North, Gravesend for sale or to rent.
| Streets | Postcodes |
|---|---|
| Bankside | DA11 9HR |
| Beaumont Drive | DA11 9NN DA11 9NR DA11 9NS DA11 9NW DA11 9NY DA11 9NZ |
| Beresford Road | DA11 9JU |
| Botany Road | DA11 9BG |
| Burnaby Road | DA11 9JT |
| Capstan Mews | DA11 9ER |
| Church Path | DA11 9ET |
| College Road | DA11 9AU DA11 9DJ DA11 9EJ |
| Collington Close | DA11 9JX |
| Council Avenue | DA11 9HN |
| Covesfield | DA11 0EG |
| Cremorne Road | DA11 9ND |
| Crete Hall Road | DA11 9AD DA11 9BU DA11 9AA |
| Dover Road | DA11 9PL DA11 9PH DA11 9PJ DA11 9QD DA11 9QG DA11 9QN DA11 9QQ DA11 9QW DA11 9QX |
| Dudley Road | DA11 9QH |
| East Kent Avenue | DA11 9HU |
| Ebbsfleet Business Park | DA11 9DZ |
| Ebbsfleet Walk | DA11 9EN DA11 9EW |
| Factory Road | DA11 9HH |
| Fishermens Hill | DA11 9DH |
| Ford Road | DA11 9DD |
| Fountain Walk | DA11 9JY DA11 9JZ DA11 9LA |
| Galleon Mews | DA11 9EE |
| Gordon Road | DA11 9JN DA11 9JW |
| Grove Road | DA11 9AX |
| Hamerton Road | DA11 9DX |
| Hartfield Place | DA11 9QU |
| High Street | DA11 9EZ DA11 9HB DA11 9HF DA11 9HG DA11 9HJ DA11 9HQ DA11 9HY |
| Holly Court | DA11 9HX |
| Huntley Avenue | DA11 9HS |
| Kendall Gardens | DA11 0EE |
| Kingston Court | DA11 9DG |
| Laburnum Grove | DA11 9QL DA11 9QP DA11 9QR DA11 9QS DA11 9RA |
| Lawn Road | DA11 9HW |
| Lightermans Mews | DA11 9EA |
| Lime Avenue | DA11 9PY DA11 9PZ |
| London Road | DA11 9JG DA11 9BN DA11 9JE DA11 9JH DA11 9JQ DA11 9JR DA11 9JS DA11 9LE DA11 9LF DA11 9LY DA11 9NH DA11 9NJ |
| Lower Road | DA11 9BB |
| Marina Drive | DA11 9LG DA11 9LQ |
| Mariners Way | DA11 9EP |
| Maritime Gate | DA11 9EB DA11 9EG DA11 9EH DA11 9EL |
| Mermaid Close | DA11 9ED DA11 9EF |
| Mill Road | DA11 9JP |
| Mountside Close | DA11 9FD |
| North Kent Avenue | DA11 9HP |
| Northfleet Industrial Estate | DA11 9BL |
| Plane Avenue | DA11 9QB |
| Railway Street | DA11 9DU |
| Ranelagh Gardens | DA11 9NT |
| Robinia Avenue | DA11 9QE DA11 9QF |
| Rose Street | DA11 9EQ |
| Rural Vale | DA11 9JJ DA11 9JL |
| Salem Place | DA11 9QA |
| Shepherd Street | DA11 9PR DA11 9PS DA11 9PT DA11 9PX |
| South Kent Avenue | DA11 9HT |
| Springhead Road | DA11 9QT DA11 9QY DA11 9QZ |
| St Marks Avenue | DA11 9LJ DA11 9LL DA11 9LN DA11 9LW |
| Station Road | DA11 9DY |
| Stonebridge Road | DA11 9BJ DA11 9GN DA11 9BA DA11 9DR DA11 9DS DA11 9DT |
| Thames Way | DA11 9QJ |
| The Creek | DA11 9AS |
| The Hill | DA11 9ES DA11 9EU DA11 9EX |
| The Hive | DA11 9DE DA11 9DF |
| The Shore | DA11 9AN |
| Tooley Street | DA11 9PN DA11 9PW |
| Tower Wharf | DA11 9BD |
| Vale Road | DA11 9RE |
| Vauxhall Close | DA11 9NP |
| Vicarage Drive | DA11 9HA |
| Wallis Park | DA11 9DN DA11 9DP DA11 9DW |
| Wardona Court | DA11 9DB |
| Warwick Place | DA11 9DQ |
| Watercress Way | DA11 9BW DA11 9BX DA11 9FE |
| Waterside | DA11 9FA DA11 9FB |
| West Kent Avenue | DA11 9HL |
| York Road | DA11 9PU |
| DA11 9DL |
Property price trends in Northfleet North
According to the latest Land Registry data, the average home in Northfleet North sold for £315,000 in 2026. That figure comes from 3,649 sales logged over the past 31 years.
Prices have continued to climb over the last three years. Compared with 2023, when the typical sale came in around £268,844, that's a rise of roughly 17.2%.
Looking back five years, average prices are up about 22.9% since 2021, a gain of around £58,687 in cash terms.
Zoom out to the past decade for the fuller picture. Back in 2016, homes here averaged £214,334, so the typical sold price has climbed about 47% since then, roughly 3.9% a year. Stretch the view to fifteen years and that annual pace edges up closer to 5.8%.
Frequently asked questions about Northfleet North
What is the average price for a property for sale in Northfleet North?
The average price for a property for sale in Northfleet North is £270,477. This amount is 26% lower than the average price in Gravesend. There are 4,058 property listings for sale in Northfleet North.
What streets have the most expensive properties for sale in Northfleet North?
The streets with the most expensive properties for sale in Northfleet North are Capstan Mews at an average of £400,000, Robinia Avenue at an average of £393,500 and Mermaid Close at an average of £393,000.
What streets have the most affordable properties for sale in Northfleet North?
The streets with the most affordable properties for sale in Northfleet North are Salem Place at an average of £92,500, The Hill at an average of £124,562 and Ford Road at an average of £135,000.
Which train stations are available in or near Northfleet North?
Some of the train stations available in or near Northfleet North are Northfleet, Ebbsfleet International and Gravesend.
Property Price Paid in Northfleet North by Year
The average sold property price by year was:
| Year | Average Sold Price | Price Change |
Sold Properties
|
|---|---|---|---|
| 2026 | £315,000 | 14% |
9 Properties |
| 2025 | £270,365 | 1% |
80 Properties |
| 2024 | £266,868 | -1% |
76 Properties |
| 2023 | £268,844 | -5% |
72 Properties |
| 2022 | £281,066 | 9% |
90 Properties |
| 2021 | £256,313 | 11% |
106 Properties |
| 2020 | £227,120 | -5% |
65 Properties |
| 2019 | £238,414 | -1% |
82 Properties |
| 2018 | £240,602 | 8% |
93 Properties |
| 2017 | £221,672 | 3% |
105 Properties |
Property Price per Property Type in Northfleet North
Here you can find historic sold price data in order to help with your property search.
The average Property Paid Price for specific property types in the last three years are:
| Property Type | Average Sold Price | Sold Properties |
|---|---|---|
| Semi Detached House | £313,362.00 | 29 Semi Detached Houses |
| Detached House | £419,500.00 | 10 Detached Houses |
| Terraced House | £288,541.00 | 142 Terraced Houses |
| Flat | £175,852.00 | 56 Flats |
