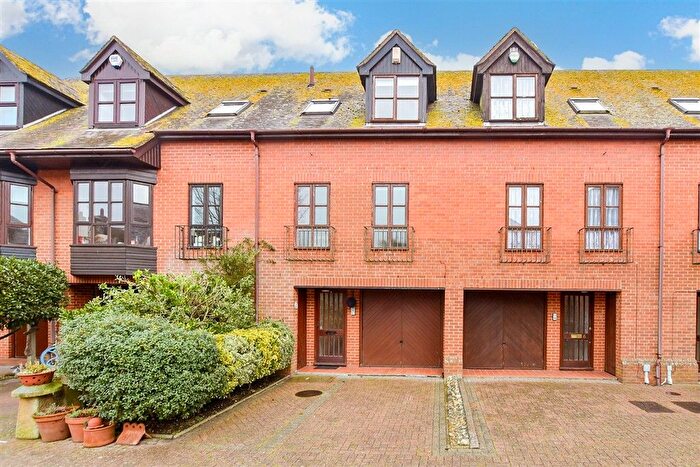
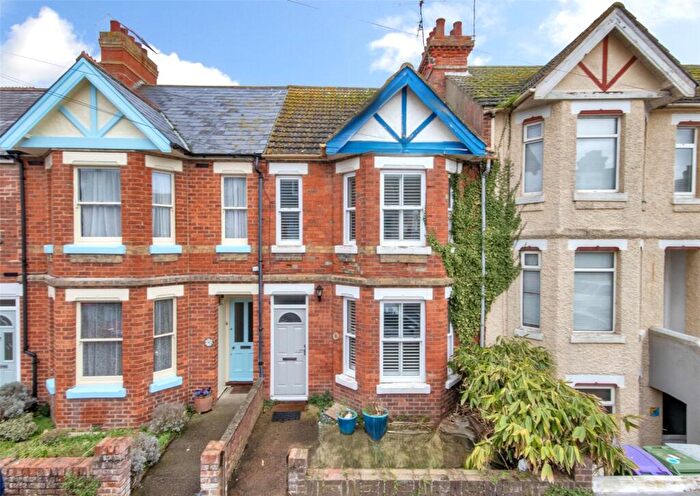
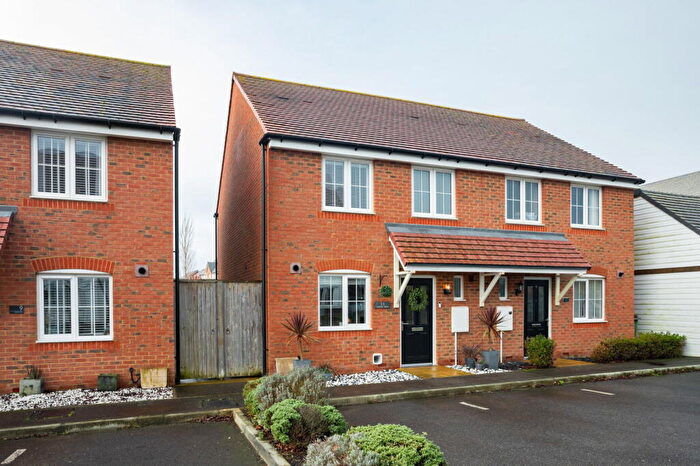
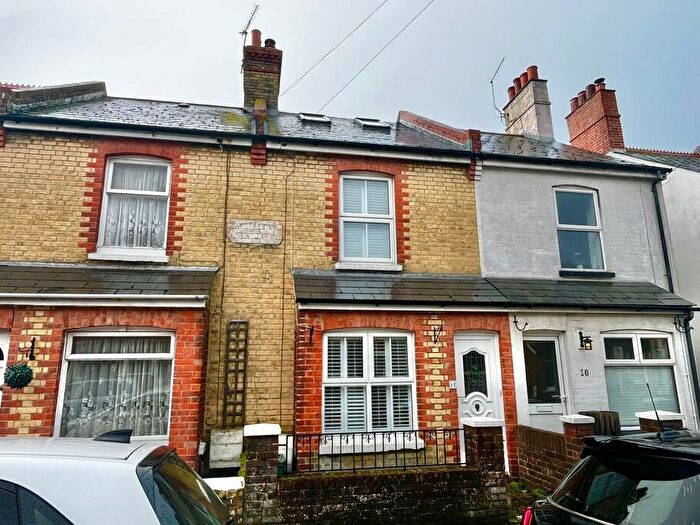
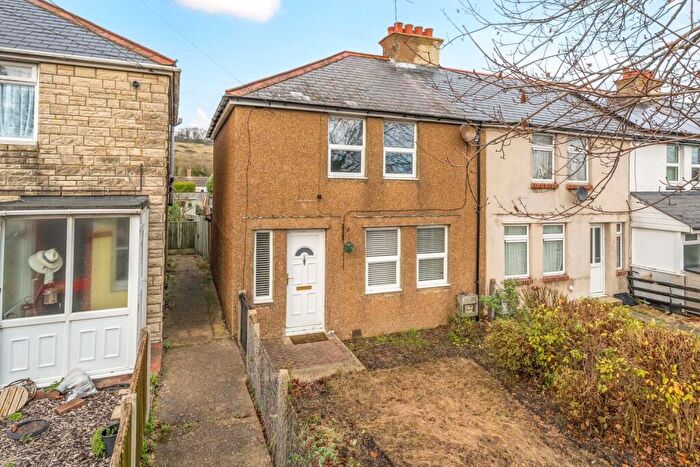
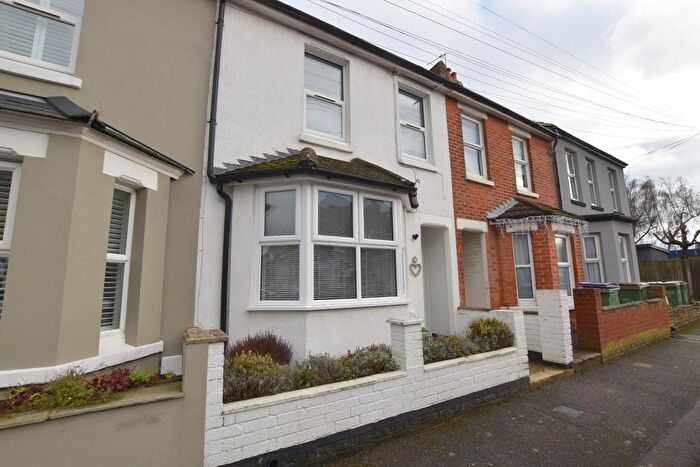
Houses for sale & to rent in Hythe West, Hythe
House Prices in Hythe West
Properties in Hythe West have an average house price of £348,166.00 and had 160 Property Transactions within the last 3 years¹.
Hythe West is an area in Hythe, Kent with 1,758 households², where the most expensive property was sold for £950,000.00.
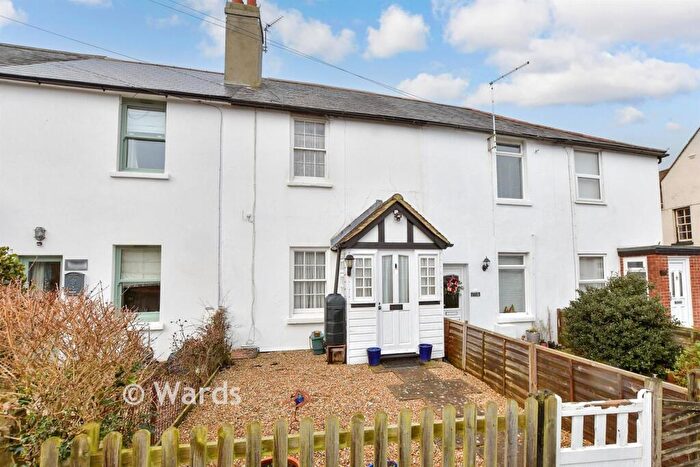
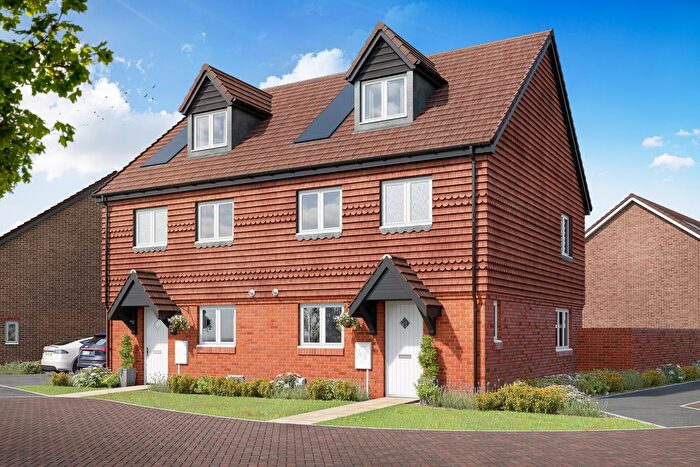
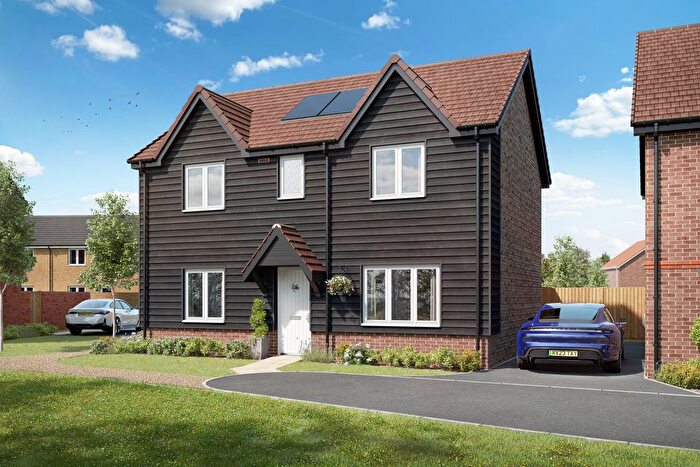
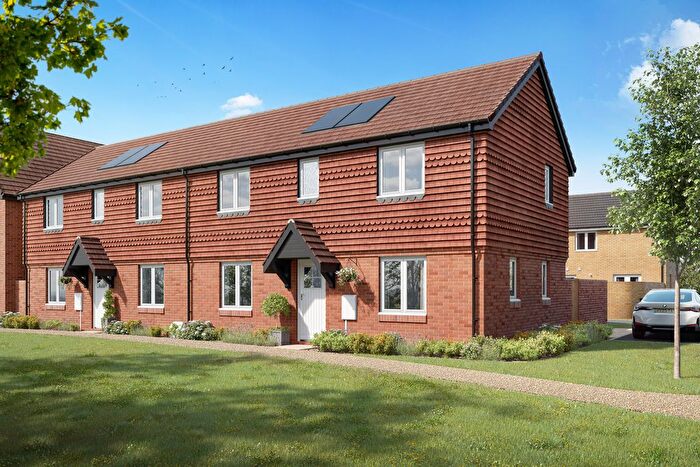
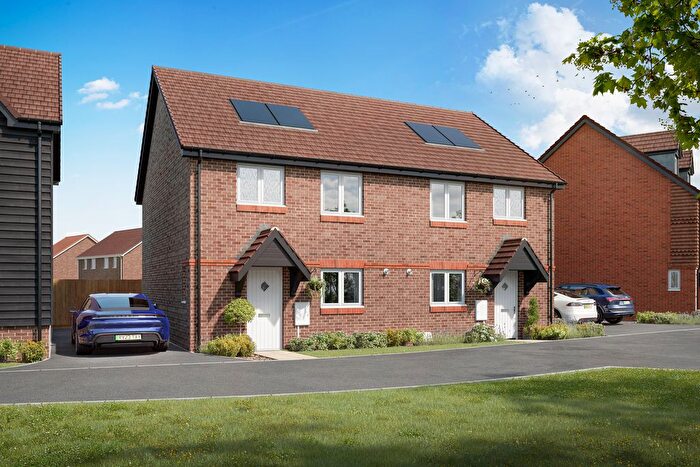
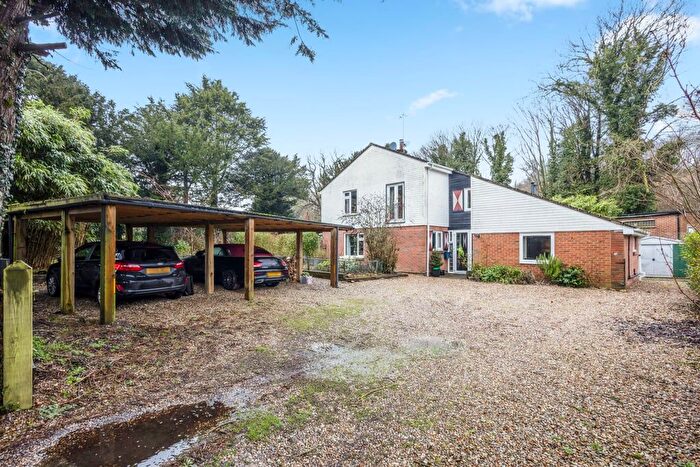
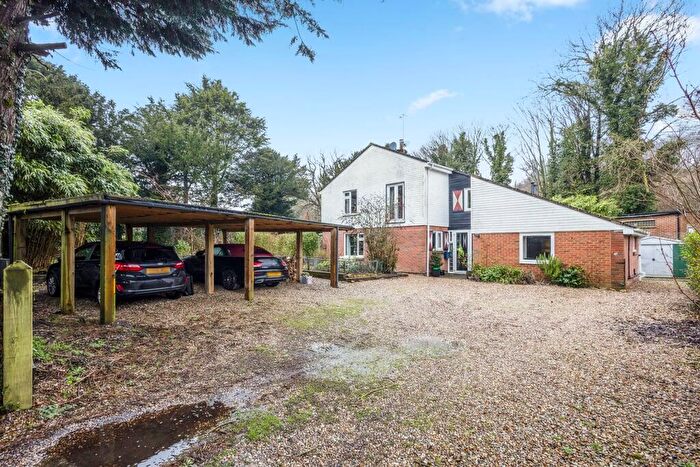
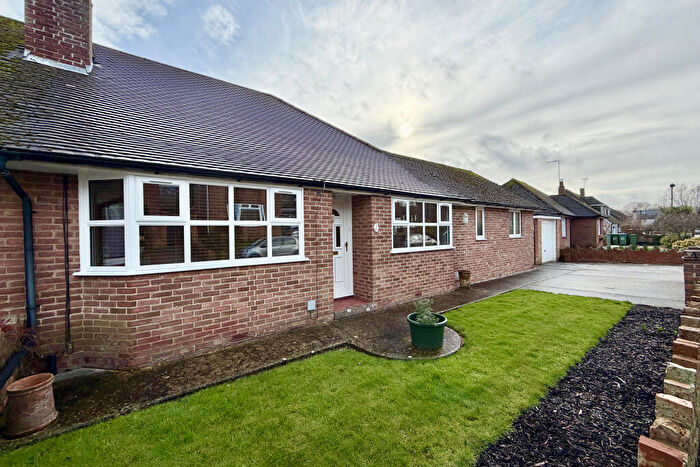
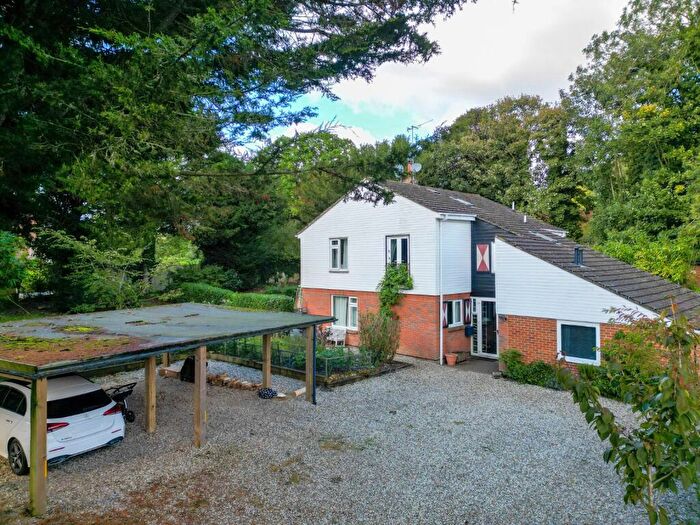
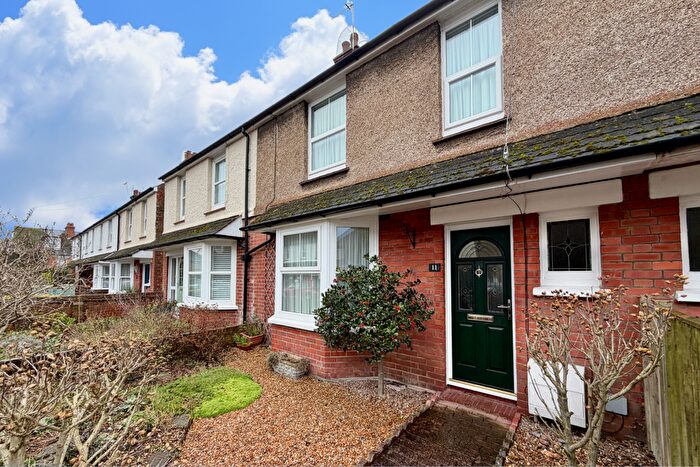
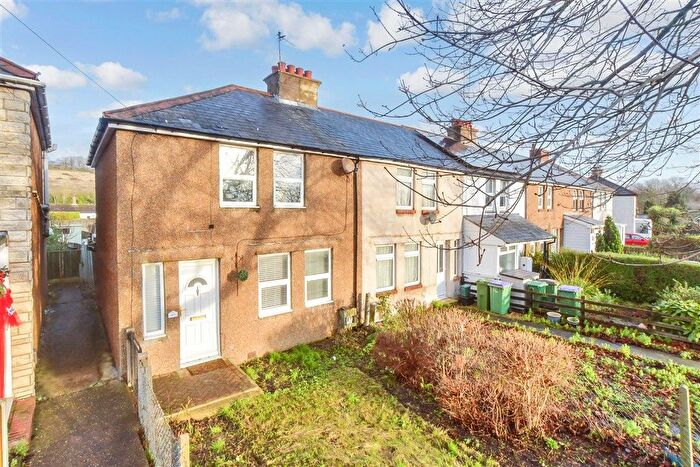
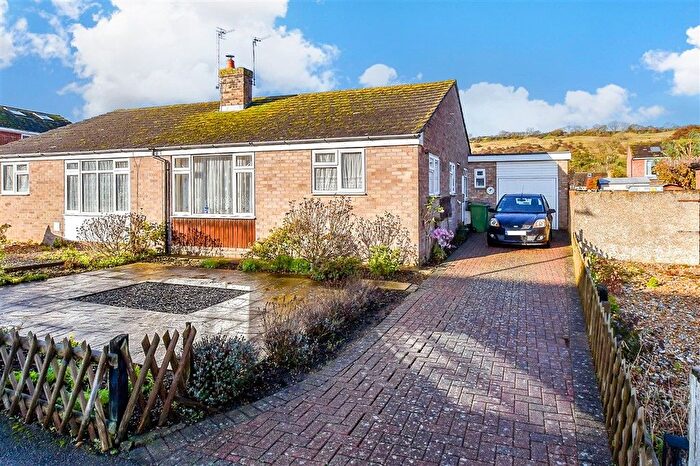
Properties for sale in Hythe West
Roads and Postcodes in Hythe West
Navigate through our locations to find the location of your next house in Hythe West, Hythe for sale or to rent.
| Streets | Postcodes |
|---|---|
| Bridge Close | CT21 4DD |
| Burmarsh Road | CT21 4NH CT21 4NJ CT21 6NA CT21 6QG CT21 6QH CT21 6QL |
| Chestnut Close | CT21 6PT |
| Chestnut Terrace | CT21 6LL |
| Crofters Close | CT21 6QB |
| Dalmeny Terrace | CT21 6LW |
| Dove Close | CT21 6RB |
| Dymchurch Road | CT21 4ND CT21 4NF CT21 6JN CT21 6JR CT21 6JU CT21 6JX CT21 6JZ CT21 6LA CT21 6LB CT21 6LH |
| Elm Court | CT21 6QF |
| Ettrick Terrace | CT21 6LN |
| Fairview | CT21 4NQ |
| Finch Grove | CT21 6QY |
| Fort Road | CT21 6JS |
| Frampton Road | CT21 6JP CT21 6JW |
| Grebe Crescent | CT21 6QN CT21 6QW |
| Green Lane | CT21 4DY |
| Green Lane Avenue | CT21 4DZ |
| Hawthorn Close | CT21 6PX |
| Herons Way | CT21 6QS |
| Jubilee Close | CT21 6NQ |
| Keddows Close | CT21 6NJ |
| Kingfisher Avenue | CT21 6QT CT21 6RA CT21 6RD |
| Kingfisher Gardens | CT21 6QR |
| Kingfisher Mews | CT21 6GY |
| London Road | CT21 4JH |
| Longbridge Terrace | CT21 6LR |
| Lyell Close | CT21 5JB |
| Lympne Hill | CT21 4NX |
| Marsh View | CT21 6NP |
| Martello Cottages | CT21 6LZ |
| Martello Drive | CT21 6PH CT21 6PJ |
| Martins Way | CT21 6QU |
| Millfields Road | CT21 4DH CT21 4DJ |
| Nightingale Avenue | CT21 6QX |
| Nursery Fields | CT21 4DL CT21 4DS |
| Oaks View | CT21 6NS |
| Old London Road | CT21 4DG CT21 4DQ |
| Orchard Valley | CT21 4EA CT21 4EB |
| Palmarsh Avenue | CT21 6NR CT21 6NT |
| Palmarsh Crescent | CT21 6NG CT21 6NU CT21 6NX |
| Palmbeach Avenue | CT21 6NH CT21 6NL CT21 6NW |
| Peregrine Close | CT21 6QZ |
| Princes Terrace | CT21 6LX CT21 6LY |
| Reachfields | CT21 6LQ CT21 6LS |
| Redbrooks Way | CT21 4DN CT21 4DW |
| Robins Close | CT21 6QP |
| Romney Way | CT21 6PL CT21 6PN CT21 6PQ |
| Shepherds Walk | CT21 6PS CT21 6PU CT21 6PW CT21 6PY CT21 6PZ CT21 6QA |
| St Georges Place | CT21 6NE |
| St Marys Road | CT21 4NU |
| St Nicholas Road | CT21 6JQ |
| St Nicholas Terrace | CT21 6JH |
| Studfall Close | CT21 6NN |
| Summer Close | CT21 4DR |
| Sunny Bank | CT21 4DP |
| Sutherland Close | CT21 6JT |
| Sycamore Close | CT21 6PP |
| The Haven | CT21 4PJ |
| Turnpike Close | CT21 4DE |
| Tweed Terrace | CT21 6LP |
| West Hythe Road | CT21 4NS CT21 4NT |
| Willow Close | CT21 6PR |
| Woodland Rise | CT21 4NA |
| Wych Elm Way | CT21 6QE |
Transport near Hythe West
- FAQ
- Price Paid By Year
- Property Type Price
Frequently asked questions about Hythe West
What is the average price for a property for sale in Hythe West?
The average price for a property for sale in Hythe West is £348,166. This amount is 16% lower than the average price in Hythe. There are 1,356 property listings for sale in Hythe West.
What streets have the most expensive properties for sale in Hythe West?
The streets with the most expensive properties for sale in Hythe West are The Haven at an average of £635,000, Old London Road at an average of £557,500 and Millfields Road at an average of £555,000.
What streets have the most affordable properties for sale in Hythe West?
The streets with the most affordable properties for sale in Hythe West are Elm Court at an average of £172,000, St Georges Place at an average of £201,250 and Ettrick Terrace at an average of £210,000.
Which train stations are available in or near Hythe West?
Some of the train stations available in or near Hythe West are Sandling, Westenhanger and Folkestone West.
Property Price Paid in Hythe West by Year
The average sold property price by year was:
| Year | Average Sold Price | Price Change |
Sold Properties
|
|---|---|---|---|
| 2025 | £336,883 | -5% |
43 Properties |
| 2024 | £354,655 | 1% |
45 Properties |
| 2023 | £350,849 | -6% |
72 Properties |
| 2022 | £371,228 | 16% |
58 Properties |
| 2021 | £313,412 | 4% |
82 Properties |
| 2020 | £300,158 | 0,1% |
58 Properties |
| 2019 | £299,887 | 6% |
60 Properties |
| 2018 | £280,891 | 3% |
81 Properties |
| 2017 | £271,607 | 7% |
78 Properties |
| 2016 | £251,867 | 10% |
73 Properties |
| 2015 | £226,962 | 8% |
87 Properties |
| 2014 | £209,460 | 11% |
79 Properties |
| 2013 | £185,567 | -1% |
64 Properties |
| 2012 | £187,317 | -4% |
48 Properties |
| 2011 | £195,688 | 1% |
48 Properties |
| 2010 | £193,781 | -2% |
48 Properties |
| 2009 | £198,609 | 8% |
64 Properties |
| 2008 | £182,844 | -12% |
53 Properties |
| 2007 | £205,627 | 8% |
90 Properties |
| 2006 | £190,104 | 2% |
111 Properties |
| 2005 | £186,308 | 3% |
93 Properties |
| 2004 | £181,479 | 18% |
84 Properties |
| 2003 | £149,234 | 22% |
93 Properties |
| 2002 | £117,015 | 12% |
108 Properties |
| 2001 | £103,063 | 18% |
82 Properties |
| 2000 | £84,053 | 9% |
89 Properties |
| 1999 | £76,280 | 8% |
106 Properties |
| 1998 | £70,474 | 10% |
77 Properties |
| 1997 | £63,448 | 11% |
87 Properties |
| 1996 | £56,368 | 2% |
85 Properties |
| 1995 | £55,126 | - |
77 Properties |
Property Price per Property Type in Hythe West
Here you can find historic sold price data in order to help with your property search.
The average Property Paid Price for specific property types in the last three years are:
| Property Type | Average Sold Price | Sold Properties |
|---|---|---|
| Semi Detached House | £345,904.00 | 73 Semi Detached Houses |
| Detached House | £467,777.00 | 36 Detached Houses |
| Terraced House | £273,515.00 | 43 Terraced Houses |
| Flat | £231,812.00 | 8 Flats |

