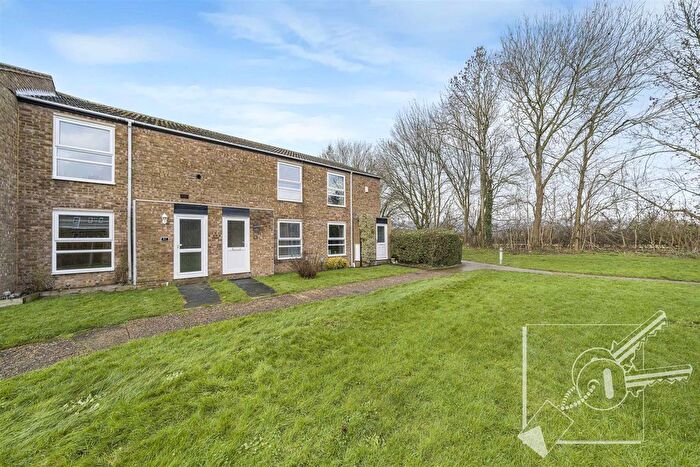
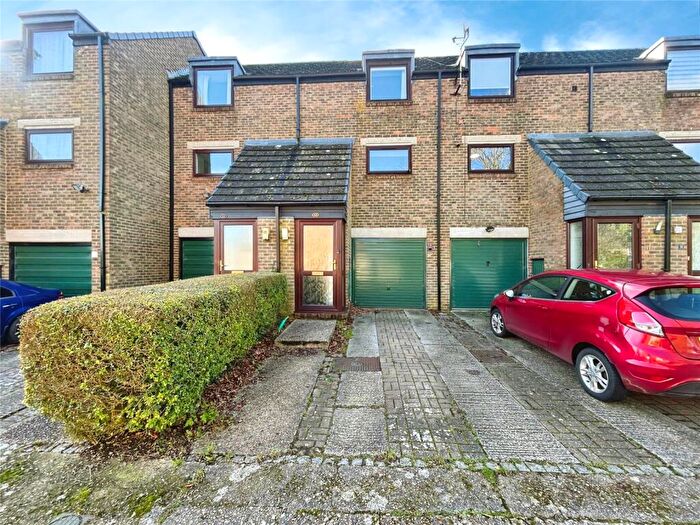
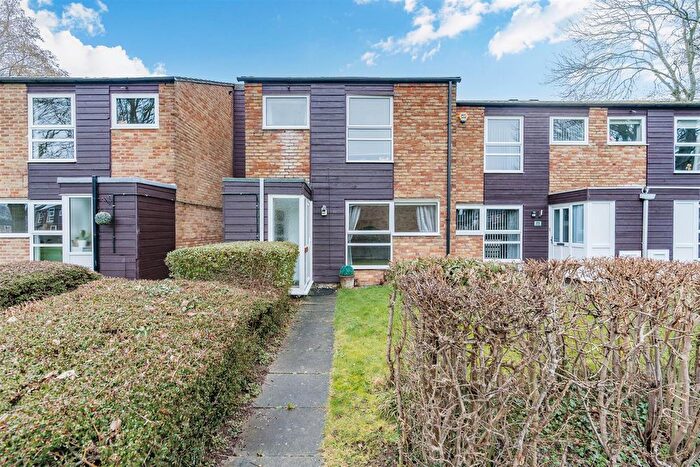
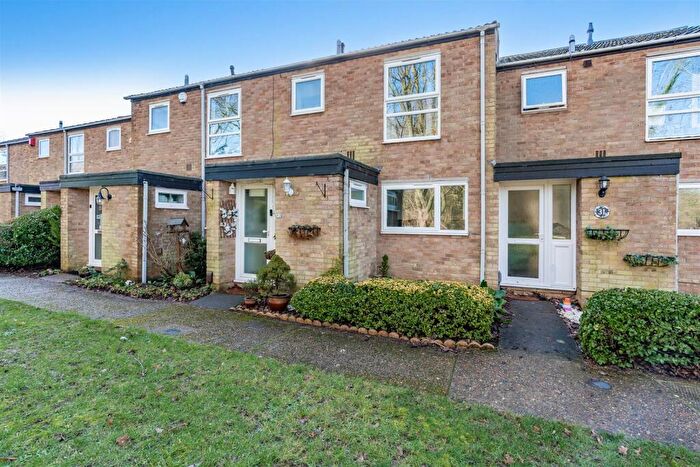
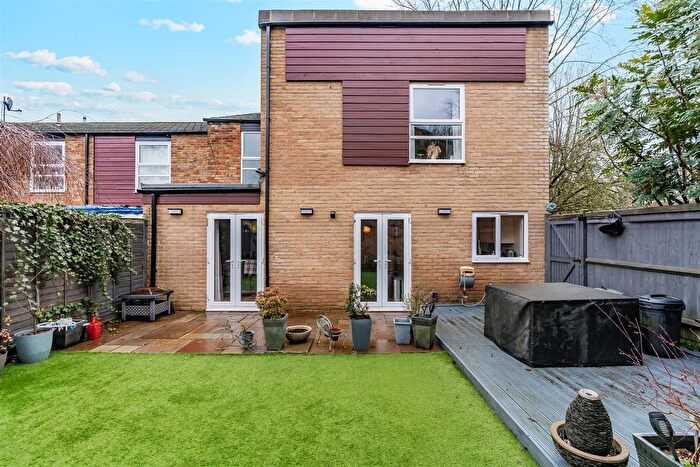
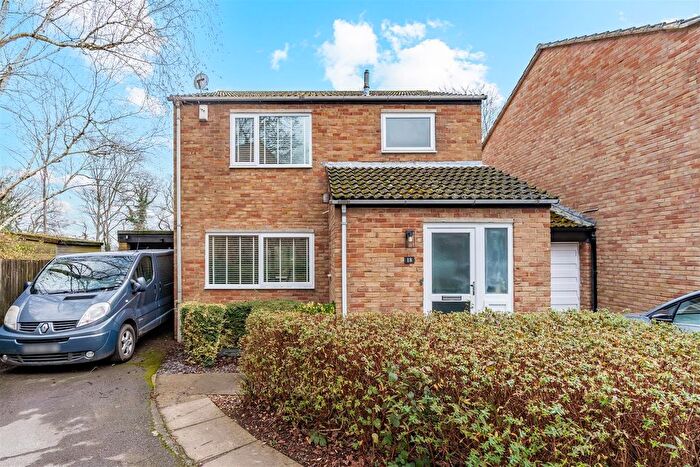
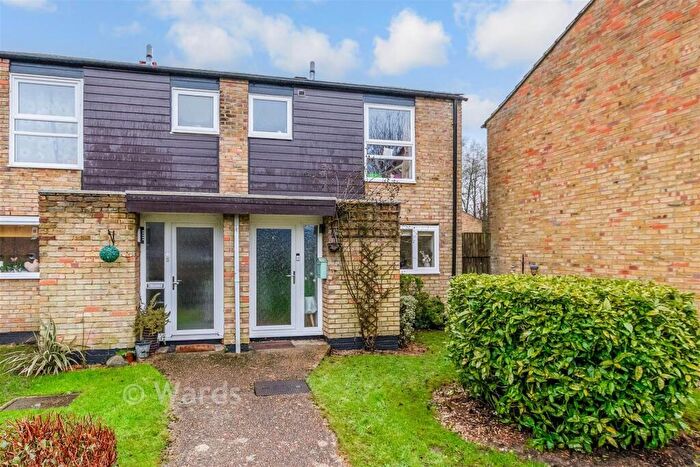
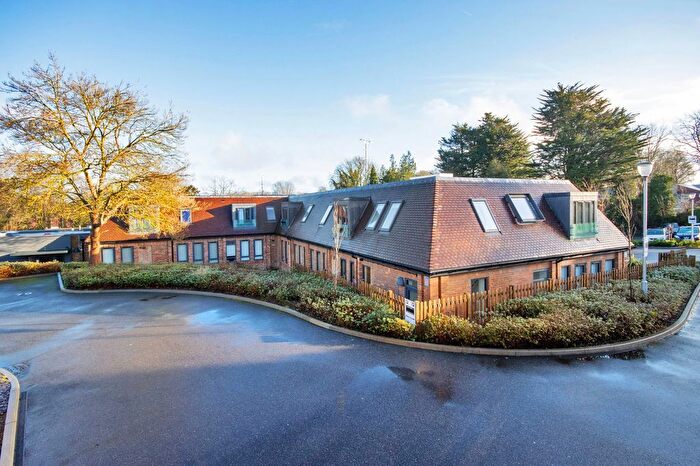
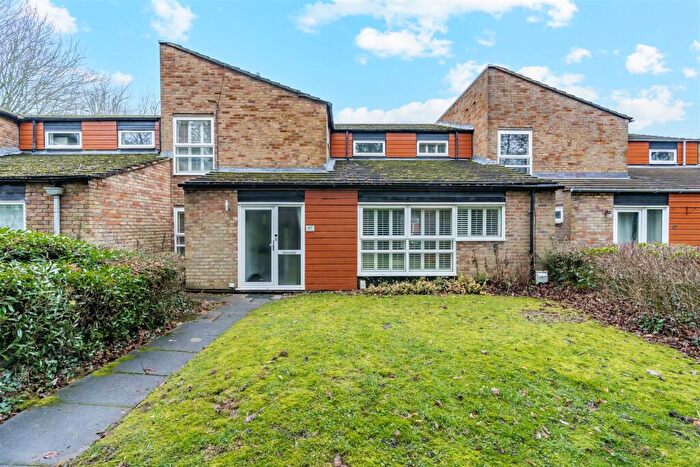
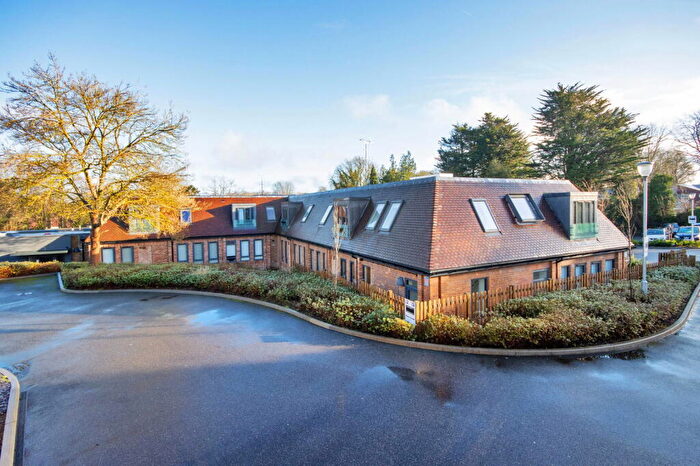
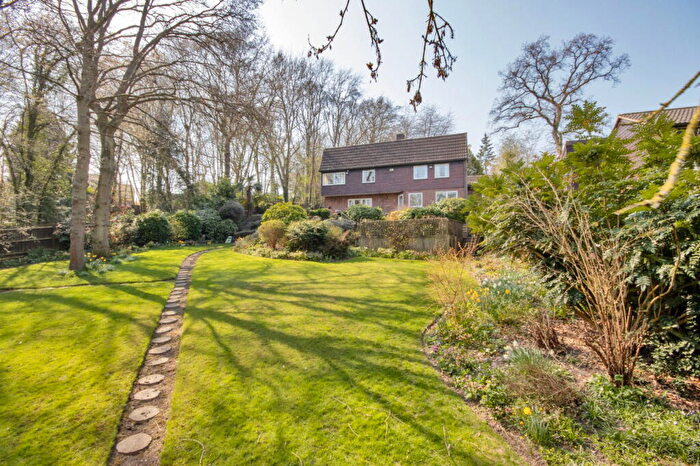
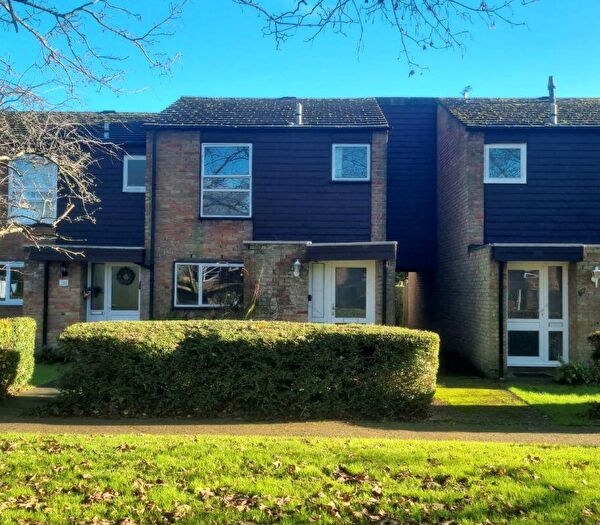
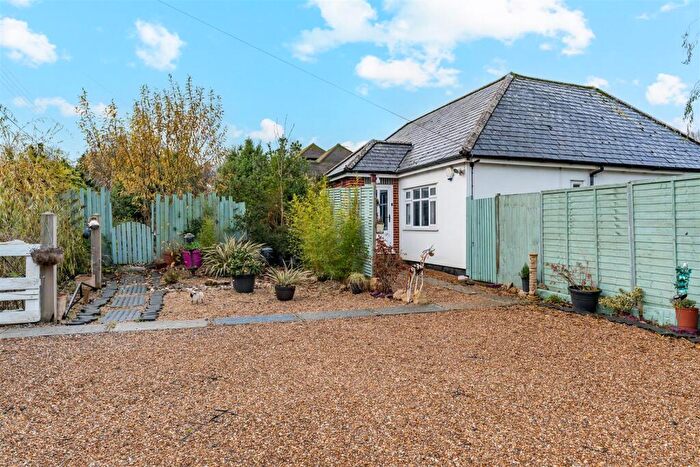
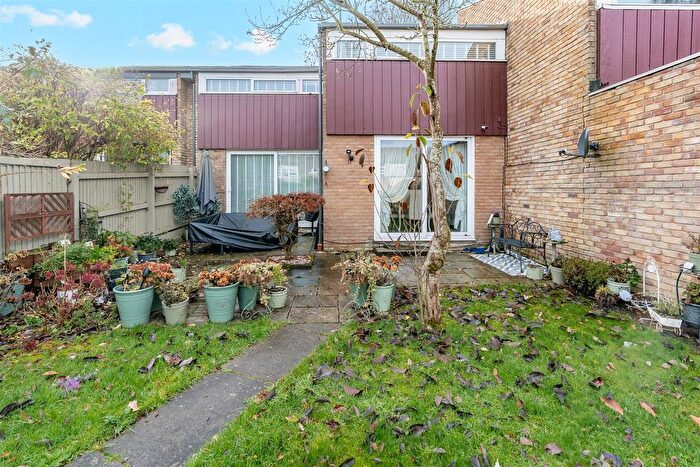
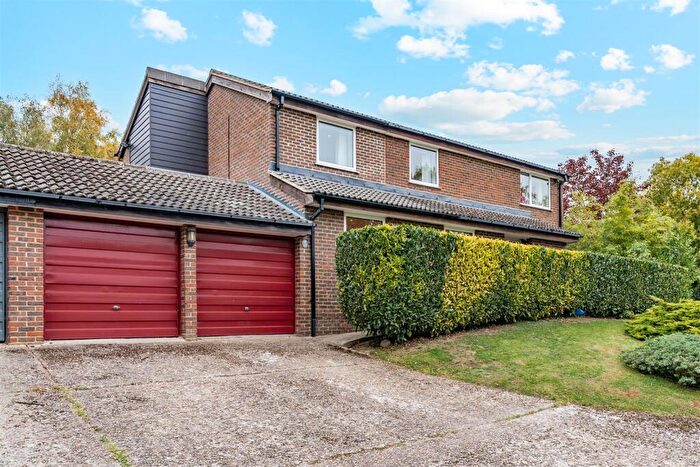
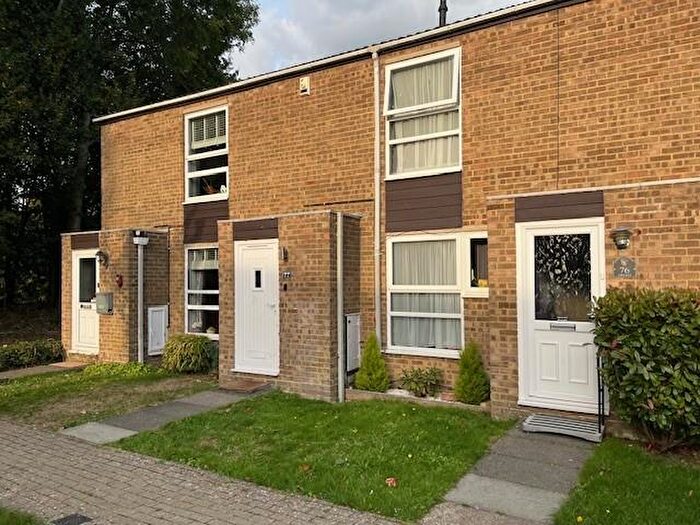
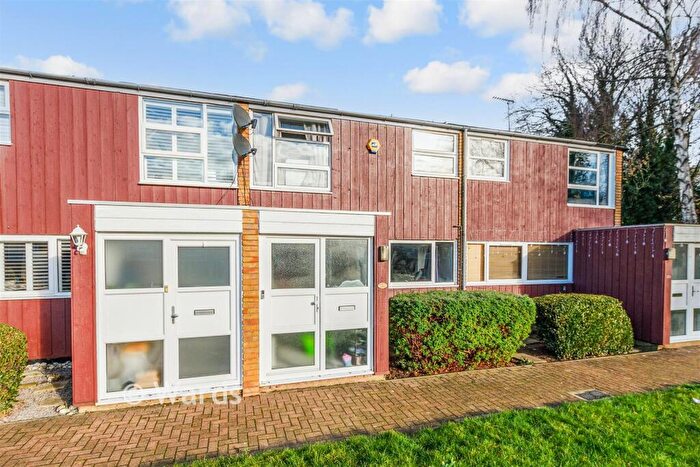
Houses for sale & to rent in Ash And New Ash Green, Longfield
House Prices in Ash And New Ash Green
Properties in Ash And New Ash Green have an average house price of £343,051.00 and had 241 Property Transactions within the last 3 years¹.
Ash And New Ash Green is an area in Longfield, Kent with 2,310 households², where the most expensive property was sold for £850,000.00.
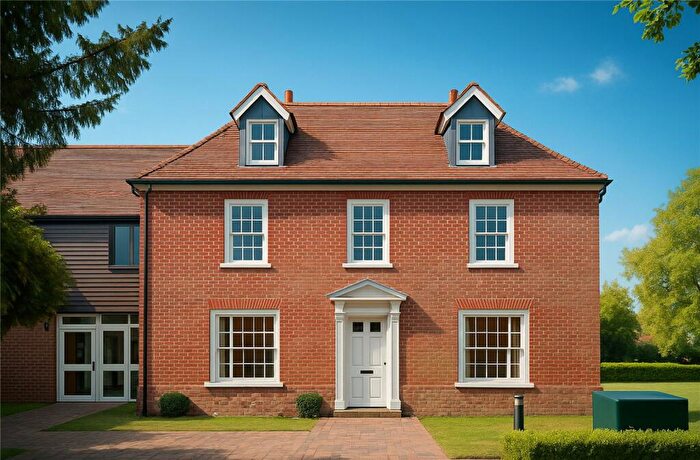
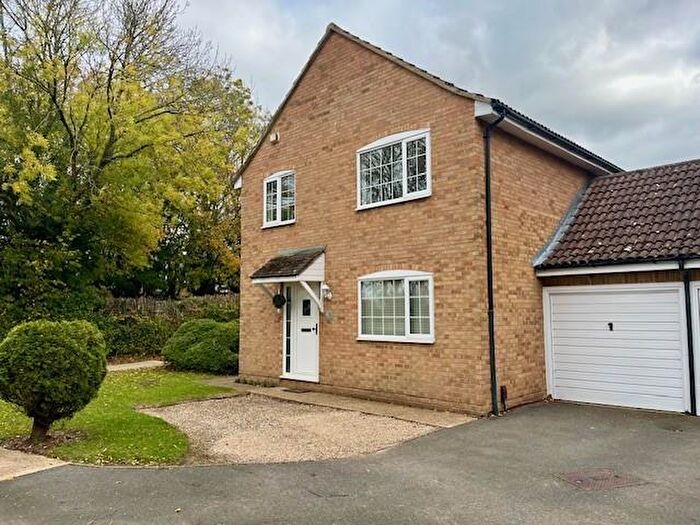
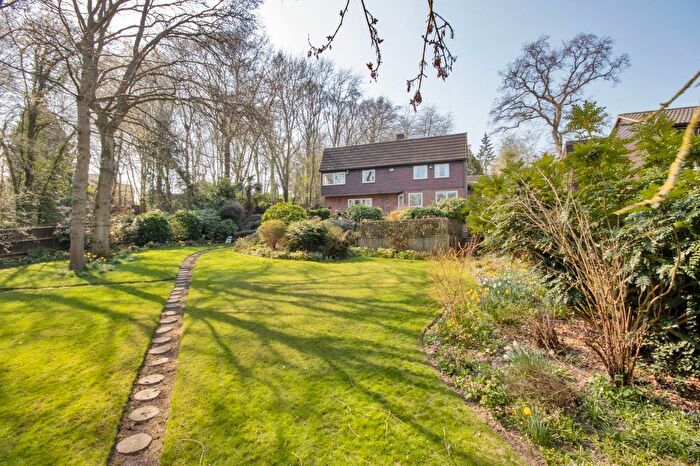
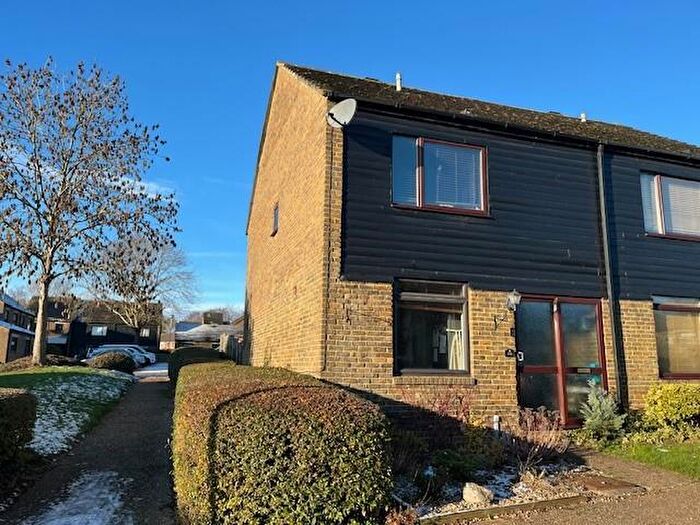
Properties for sale in Ash And New Ash Green
Previously listed properties in Ash And New Ash Green
Roads and Postcodes in Ash And New Ash Green
Navigate through our locations to find the location of your next house in Ash And New Ash Green, Longfield for sale or to rent.
| Streets | Postcodes |
|---|---|
| Ash Croft Court | DA3 8HJ |
| Ash Road | DA3 8JD DA3 8JF DA3 8JY DA3 8JZ |
| Ayelands | DA3 8JN DA3 8JU DA3 8JW |
| Bazes Shaw | DA3 8QX DA3 8QY DA3 8QZ |
| Bowes Wood | DA3 8QJ DA3 8QL |
| Caling Croft | DA3 8PX DA3 8PY DA3 8PZ |
| Capelands | DA3 8LG DA3 8LQ |
| Centre Road | DA3 8HH |
| Chapel Wood | DA3 8RA DA3 8RB DA3 8RD |
| Church Road | DA3 8JT |
| Colt Stead | DA3 8LN DA3 8LW |
| Farm Holt | DA3 8QA DA3 8QB DA3 8QD |
| Foxbury | DA3 8LP |
| Hanover Place | DA3 8JH |
| Knights Croft | DA3 8HT DA3 8HY DA3 8HZ DA3 8JS |
| Lambardes | DA3 8HU DA3 8HX |
| Lance Croft | DA3 8PP |
| Manor Forstal | DA3 8JG DA3 8JQ |
| Meadow Lane | DA3 8PW DA3 8PR |
| Millfield | DA3 8HN DA3 8HW DA3 8JP |
| New Ash Green | DA3 8RH |
| North Square | DA3 8QT |
| Olivers Mill | DA3 8RE DA3 8RF |
| Over Minnis | DA3 8JA |
| Penenden | DA3 8LR DA3 8LS DA3 8LT |
| Punch Croft | DA3 8HP DA3 8HR DA3 8HS |
| Redhill Wood | DA3 8QH DA3 8QP |
| Seven Acres | DA3 8RN DA3 8RW |
| Spring Cross | DA3 8QG DA3 8QQ |
| The Link | DA3 8HG |
| The Mead | DA3 8EZ |
| The Row | DA3 8JB DA3 8JL |
| Turners Oak | DA3 8JX |
| Upper Street North | DA3 8JR |
| Upper Street South | DA3 8JJ |
| Westfield | DA3 8QN DA3 8QW |
| DA3 8AJ |
Transport near Ash And New Ash Green
- FAQ
- Price Paid By Year
- Property Type Price
Frequently asked questions about Ash And New Ash Green
What is the average price for a property for sale in Ash And New Ash Green?
The average price for a property for sale in Ash And New Ash Green is £343,051. This amount is 34% lower than the average price in Longfield. There are 477 property listings for sale in Ash And New Ash Green.
What streets have the most expensive properties for sale in Ash And New Ash Green?
The streets with the most expensive properties for sale in Ash And New Ash Green are Redhill Wood at an average of £689,000, Westfield at an average of £512,500 and Spring Cross at an average of £511,250.
What streets have the most affordable properties for sale in Ash And New Ash Green?
The streets with the most affordable properties for sale in Ash And New Ash Green are Lance Croft at an average of £208,235, Meadow Lane at an average of £217,636 and Ash Croft Court at an average of £241,500.
Which train stations are available in or near Ash And New Ash Green?
Some of the train stations available in or near Ash And New Ash Green are Longfield, Meopham and Sole Street.
Property Price Paid in Ash And New Ash Green by Year
The average sold property price by year was:
| Year | Average Sold Price | Price Change |
Sold Properties
|
|---|---|---|---|
| 2025 | £358,141 | 5% |
82 Properties |
| 2024 | £341,225 | 4% |
93 Properties |
| 2023 | £326,874 | -0,5% |
66 Properties |
| 2022 | £328,356 | -2% |
119 Properties |
| 2021 | £335,358 | 9% |
135 Properties |
| 2020 | £304,188 | -1% |
62 Properties |
| 2019 | £305,863 | -6% |
83 Properties |
| 2018 | £322,737 | 6% |
98 Properties |
| 2017 | £301,836 | 5% |
90 Properties |
| 2016 | £287,880 | 7% |
100 Properties |
| 2015 | £266,817 | 11% |
98 Properties |
| 2014 | £238,075 | 16% |
103 Properties |
| 2013 | £201,058 | -1% |
80 Properties |
| 2012 | £202,102 | 4% |
83 Properties |
| 2011 | £194,030 | 3% |
89 Properties |
| 2010 | £189,067 | 3% |
72 Properties |
| 2009 | £182,892 | -6% |
101 Properties |
| 2008 | £193,615 | -4% |
61 Properties |
| 2007 | £200,403 | 4% |
155 Properties |
| 2006 | £192,797 | 6% |
132 Properties |
| 2005 | £180,975 | 5% |
95 Properties |
| 2004 | £171,671 | 10% |
145 Properties |
| 2003 | £154,355 | 14% |
132 Properties |
| 2002 | £132,917 | 14% |
182 Properties |
| 2001 | £114,925 | 6% |
139 Properties |
| 2000 | £108,309 | 18% |
126 Properties |
| 1999 | £88,332 | 10% |
159 Properties |
| 1998 | £79,654 | 8% |
134 Properties |
| 1997 | £73,514 | 11% |
148 Properties |
| 1996 | £65,342 | 2% |
129 Properties |
| 1995 | £63,853 | - |
112 Properties |
Property Price per Property Type in Ash And New Ash Green
Here you can find historic sold price data in order to help with your property search.
The average Property Paid Price for specific property types in the last three years are:
| Property Type | Average Sold Price | Sold Properties |
|---|---|---|
| Semi Detached House | £407,540.00 | 25 Semi Detached Houses |
| Detached House | £525,590.00 | 22 Detached Houses |
| Terraced House | £329,727.00 | 167 Terraced Houses |
| Flat | £217,009.00 | 27 Flats |

