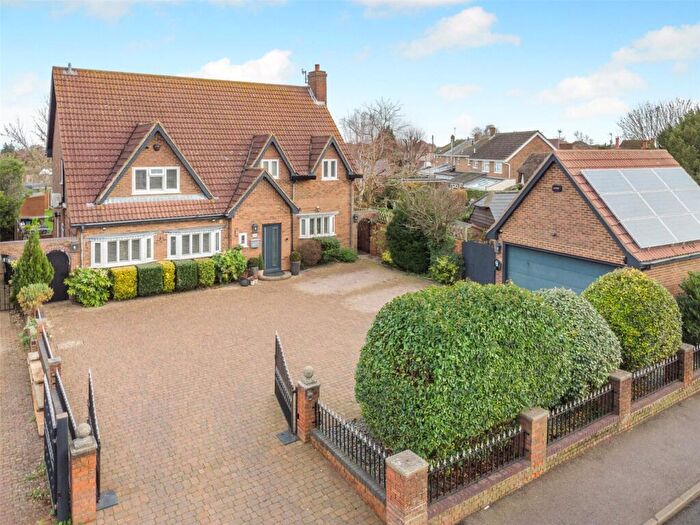
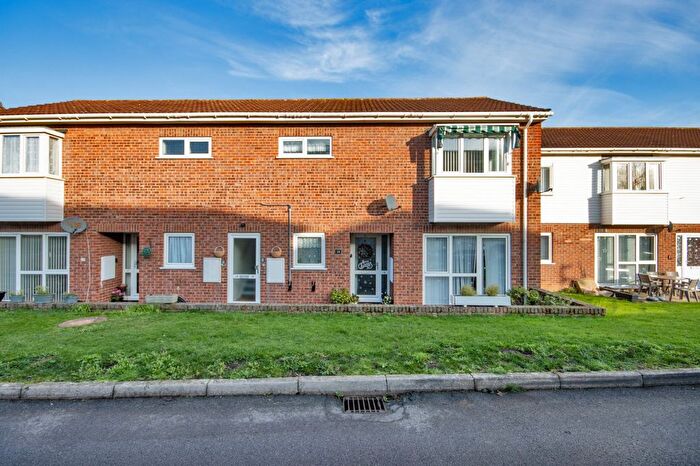
Houses for sale & to rent in Hartley And Hodsoll Street, Longfield
House Prices in Hartley And Hodsoll Street
Properties in Hartley And Hodsoll Street have an average house price of £623,361.00 and had 244 Property Transactions within the last 3 years¹.
Hartley And Hodsoll Street is an area in Longfield, Kent with 2,231 households², where the most expensive property was sold for £2,300,000.00.
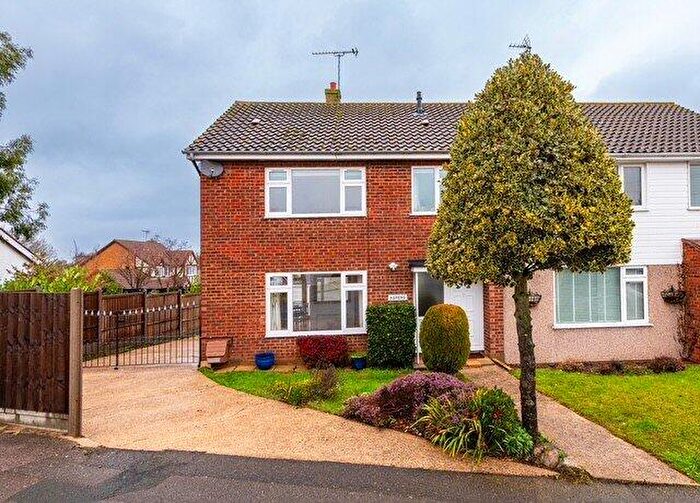
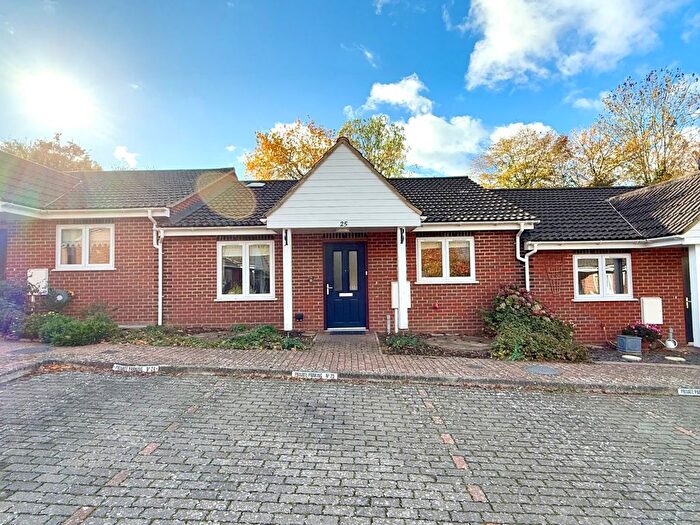
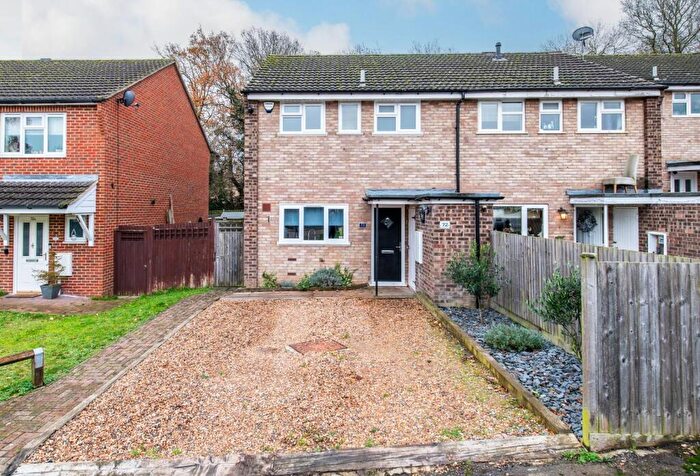
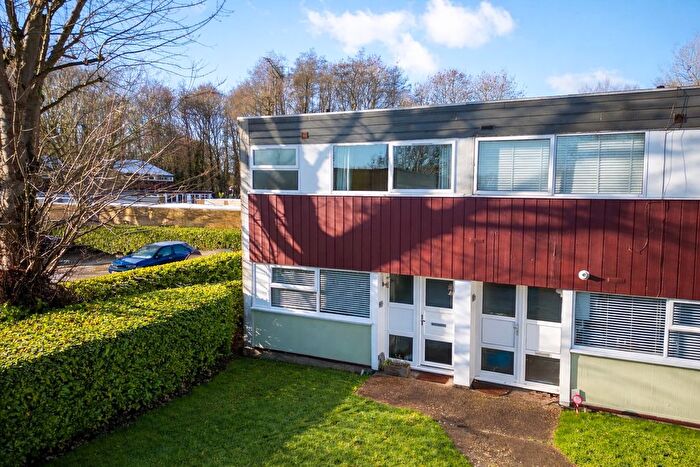
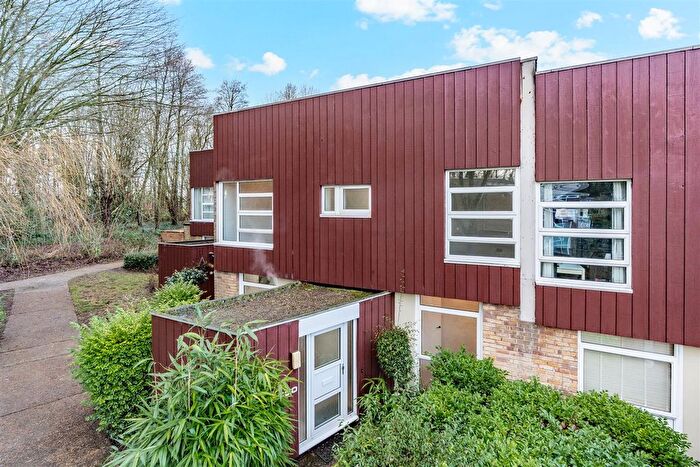
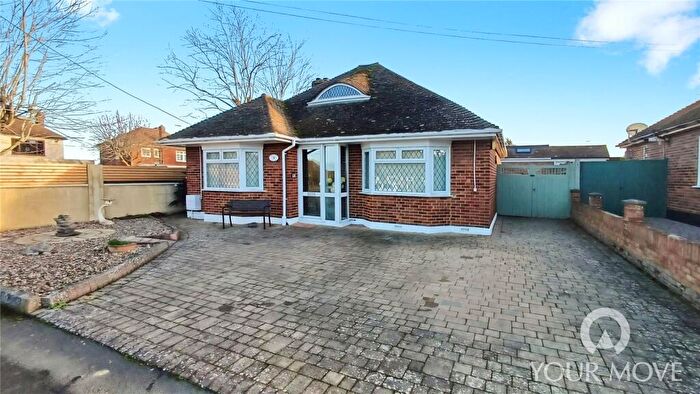
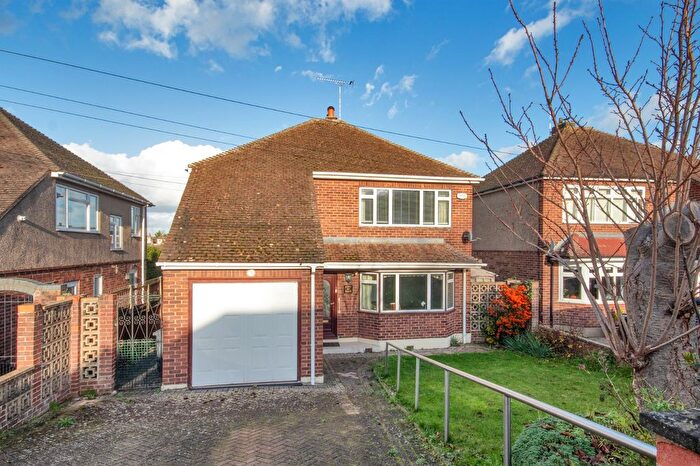
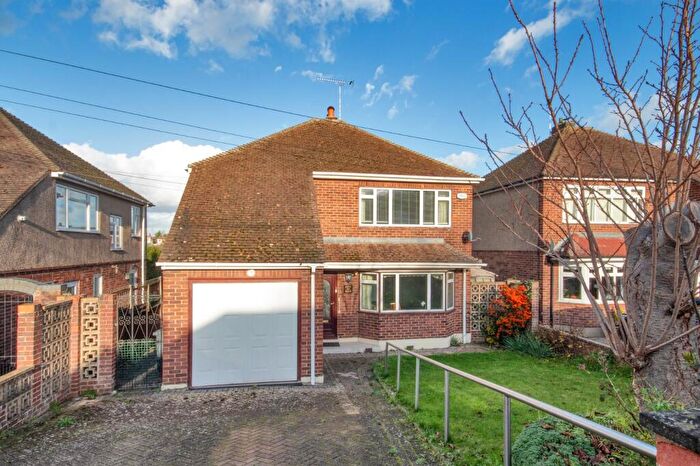
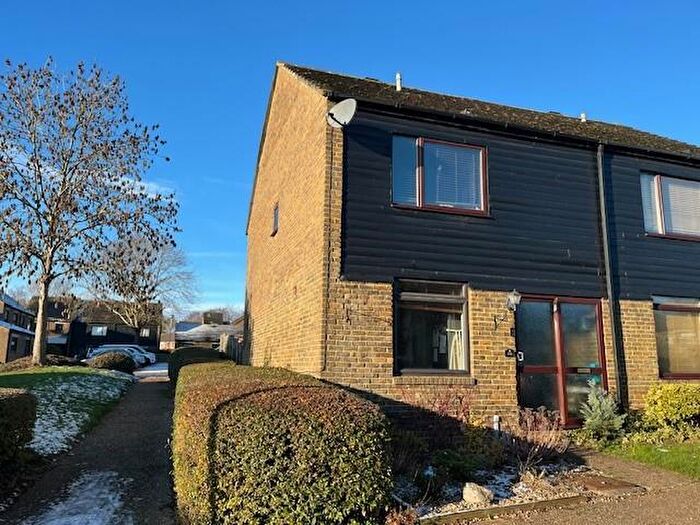
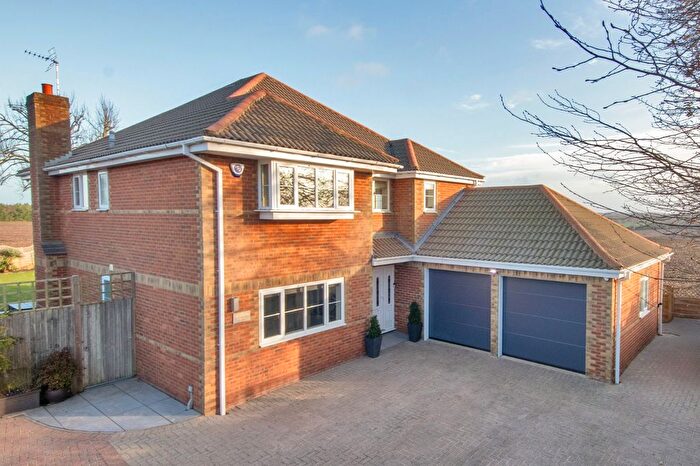
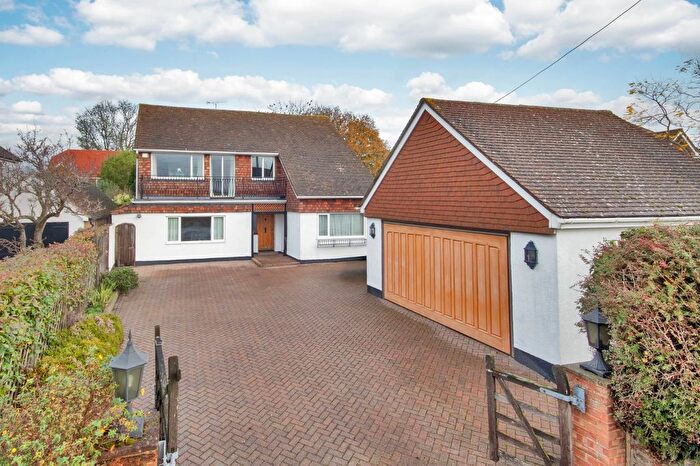
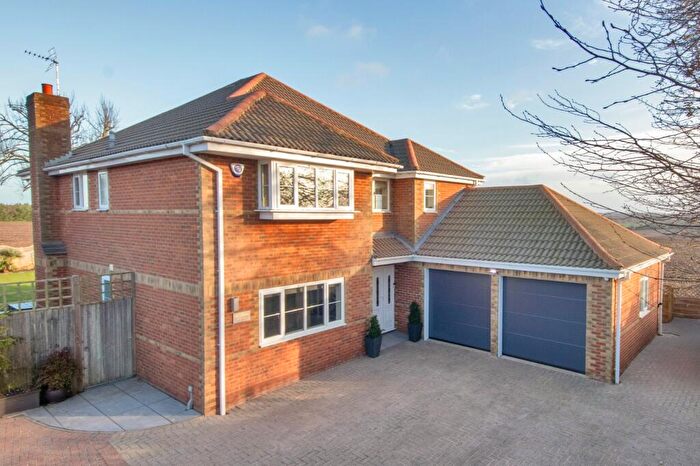
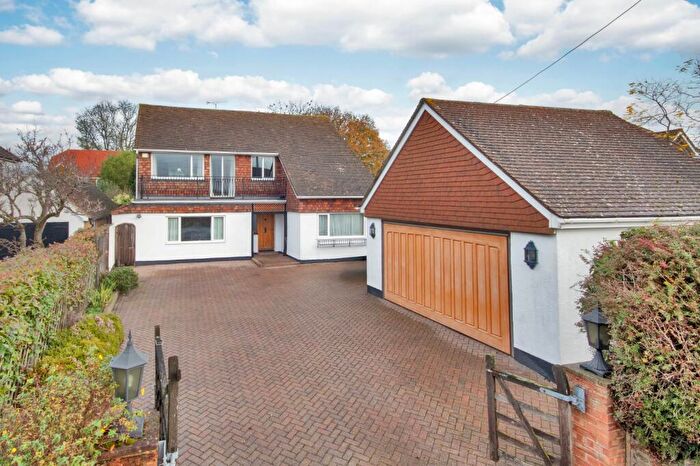
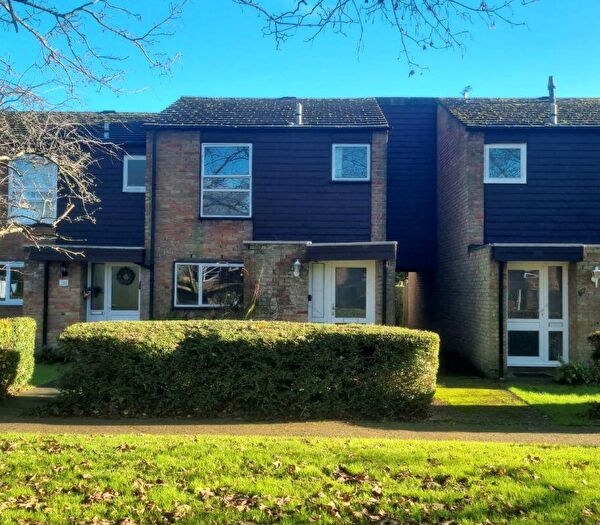
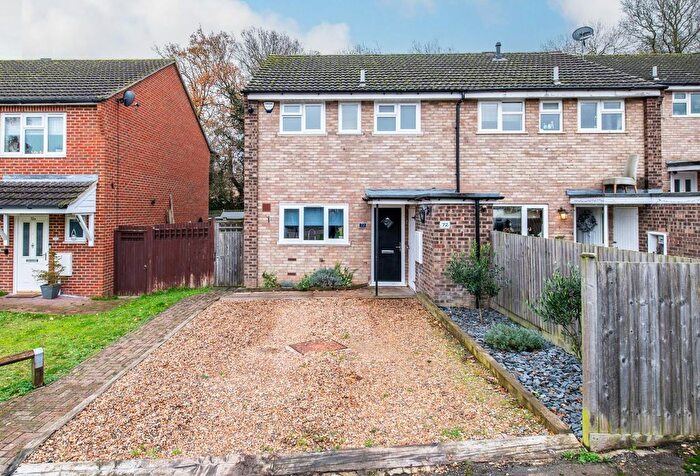
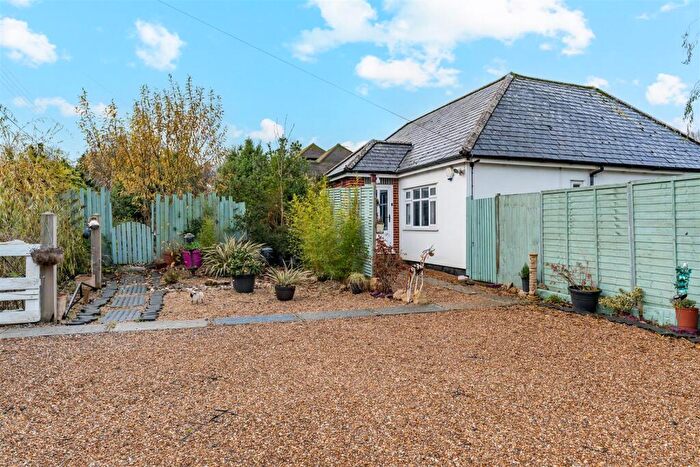
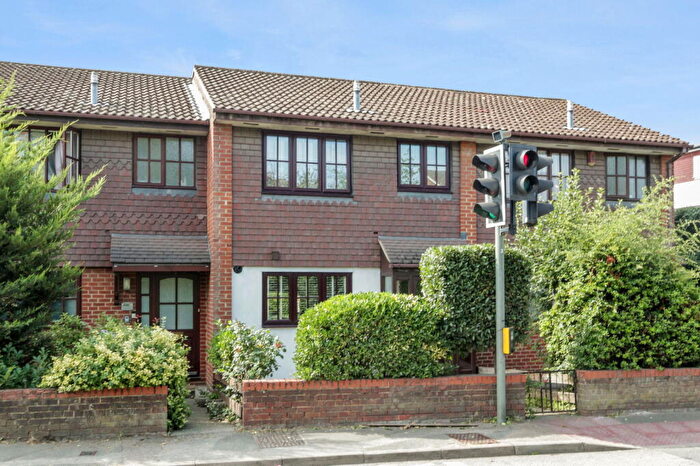
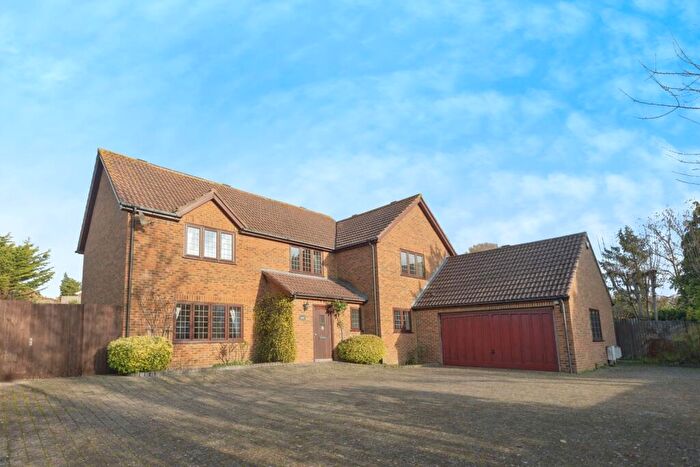
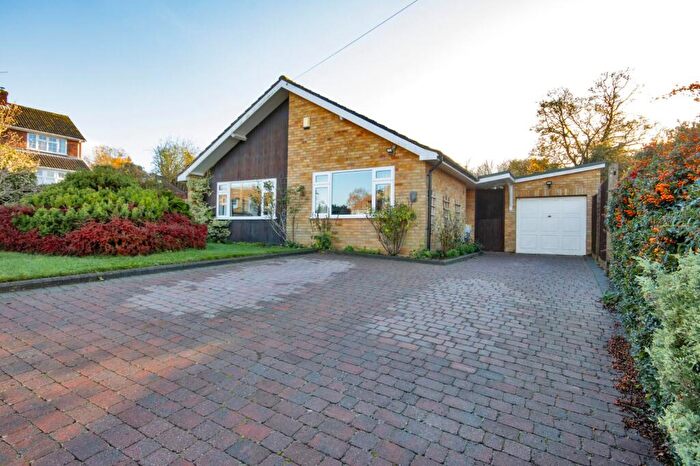
Properties for sale in Hartley And Hodsoll Street
Roads and Postcodes in Hartley And Hodsoll Street
Navigate through our locations to find the location of your next house in Hartley And Hodsoll Street, Longfield for sale or to rent.
| Streets | Postcodes |
|---|---|
| Ash Road | DA3 7DT DA3 7DY DA3 7DZ DA3 7EE DA3 7EF DA3 7EL DA3 8BH DA3 8BQ DA3 8EH DA3 8EL DA3 8EN DA3 8EP DA3 8EX DA3 8EY DA3 8HA DA3 8EW |
| Banckside | DA3 7RD |
| Bedford Square | DA3 7RJ |
| Beechlands Close | DA3 8AB |
| Berrylands | DA3 8AP |
| Billings Hill Shaw | DA3 8EU |
| Brambledown | DA3 7EP DA3 7ER DA3 7EY |
| Bramblefield Close | DA3 7BP DA3 7RL DA3 7RP |
| Brands Hatch Road | DA3 8AL |
| Briars Way | DA3 8AD |
| Broomfields | DA3 8BW |
| Carmelite Way | DA3 8BP |
| Castle Hill | DA3 7BH |
| Cavendish Square | DA3 7RG |
| Caxton Close | DA3 7DG DA3 7DL DA3 7DP |
| Chantry Avenue | DA3 8DD |
| Chapel Wood Road | DA3 8HB |
| Cherry Trees | DA3 8DS |
| Cheyne Walk | DA3 7RN |
| Church Road | DA3 8DJ DA3 8DL DA3 8DN DA3 8DR DA3 8DT DA3 8DW DA3 8DY DA3 8DZ |
| Conifer Avenue | DA3 8BX |
| Copseside | DA3 7DU |
| Culcroft | DA3 7EN |
| Culvey Close | DA3 8BS |
| Dickens Close | DA3 8DP |
| Downs Valley | DA3 7RA |
| Eaton Square | DA3 7RH |
| Ellerby Mews | DA3 8ER |
| Everglade Close | DA3 7EZ |
| Fairacre Place | DA3 7DW |
| Fairby Lane | DA3 8DA |
| Fortuna Close | DA3 7DR |
| Gorse Way | DA3 8AA DA3 8AE DA3 8AF |
| Gorsewood Road | DA3 7DE DA3 7DF DA3 7DH |
| Grange Lane | DA3 8LH |
| Grange Way | DA3 8ES |
| Green Way | DA3 8BJ |
| Gresham Avenue | DA3 7BT |
| Grosvenor Square | DA3 7RU |
| Hartley Bottom Road | DA3 8LA DA3 8LB DA3 8LF DA3 8LJ |
| Hartley Green | DA3 7BL |
| Hartley Hill | DA3 8LL |
| Hawthorns | DA3 7ET |
| Hoselands View | DA3 7ED |
| Hottsfield | DA3 7DX |
| Johns Close | DA3 7DA |
| Larks Field | DA3 7EH DA3 7EJ |
| Larkwell Lane | DA3 7BW |
| Manor Drive | DA3 8AN DA3 8AT DA3 8AU DA3 8AW |
| Manor Lane | DA3 8AX |
| Manor Road | DA3 8LD |
| Manor View | DA3 8BA |
| Merryfields Close | DA3 7HW |
| Merton Avenue | DA3 7EB DA3 7BS |
| North Ash Road | DA3 8JE |
| Northfield | DA3 7EW |
| Oast Way | DA3 8BU |
| Old Downs | DA3 7AA |
| Parkfield | DA3 7RB |
| Perran Close | DA3 7EU |
| Pitfield | DA3 7ES |
| Porchester Close | DA3 7DQ |
| Portland Place | DA3 7RW |
| Quakers Close | DA3 7EA |
| Round Ash Way | DA3 8BT |
| Russell Square | DA3 7RY |
| Silverdale | DA3 7DS |
| Simmonds Drive | DA3 8AG |
| Sloane Square | DA3 7RR |
| Springcroft | DA3 8AR DA3 8AS |
| St Georges Square | DA3 7RS |
| St James Square | DA3 7RX |
| St Johns Lane | DA3 8ET |
| Stack Lane | DA3 8BL |
| Tates Orchard | DA3 8EB |
| The Crescent | DA3 7RT |
| The Parade | DA3 8BG DA3 8HE |
| The Warrens | DA3 8DB |
| Wellfield | DA3 7EG DA3 7EQ |
| Wickhams Way | DA3 8DH |
| Woodland Avenue | DA3 7BY DA3 7BZ DA3 7DB |
| DA3 8WF DA3 8ZA DA3 8ZS DA3 9BW DA3 9BX DA3 9BY DA3 9DE DA3 9DL DA3 9DU DA3 9DY DA3 9DZ DA3 9EB |
Transport near Hartley And Hodsoll Street
-
Longfield Station
-
Meopham Station
-
Sole Street Station
-
Farningham Road Station
-
Ebbsfleet International Station
-
Northfleet Station
-
Swanscombe Station
-
Greenhithe Station
-
Gravesend Station
-
Eynsford Station
- FAQ
- Price Paid By Year
- Property Type Price
Frequently asked questions about Hartley And Hodsoll Street
What is the average price for a property for sale in Hartley And Hodsoll Street?
The average price for a property for sale in Hartley And Hodsoll Street is £623,361. This amount is 24% higher than the average price in Longfield. There are 1,196 property listings for sale in Hartley And Hodsoll Street.
What streets have the most expensive properties for sale in Hartley And Hodsoll Street?
The streets with the most expensive properties for sale in Hartley And Hodsoll Street are Manor Drive at an average of £1,186,000, Banckside at an average of £873,666 and Ash Road at an average of £868,904.
What streets have the most affordable properties for sale in Hartley And Hodsoll Street?
The streets with the most affordable properties for sale in Hartley And Hodsoll Street are Brambledown at an average of £228,000, Pitfield at an average of £268,250 and Porchester Close at an average of £283,000.
Which train stations are available in or near Hartley And Hodsoll Street?
Some of the train stations available in or near Hartley And Hodsoll Street are Longfield, Meopham and Sole Street.
Property Price Paid in Hartley And Hodsoll Street by Year
The average sold property price by year was:
| Year | Average Sold Price | Price Change |
Sold Properties
|
|---|---|---|---|
| 2025 | £630,828 | -9% |
38 Properties |
| 2024 | £686,428 | 14% |
63 Properties |
| 2023 | £592,753 | -0,3% |
71 Properties |
| 2022 | £594,420 | 3% |
72 Properties |
| 2021 | £578,407 | 10% |
81 Properties |
| 2020 | £522,536 | 1% |
55 Properties |
| 2019 | £515,096 | 1% |
57 Properties |
| 2018 | £511,215 | 4% |
51 Properties |
| 2017 | £489,270 | -2% |
73 Properties |
| 2016 | £499,507 | 6% |
69 Properties |
| 2015 | £469,696 | 14% |
68 Properties |
| 2014 | £401,624 | 16% |
82 Properties |
| 2013 | £337,634 | -17% |
70 Properties |
| 2012 | £394,999 | 12% |
57 Properties |
| 2011 | £349,005 | -6% |
60 Properties |
| 2010 | £371,172 | -5% |
59 Properties |
| 2009 | £391,255 | 14% |
47 Properties |
| 2008 | £338,406 | -14% |
48 Properties |
| 2007 | £384,403 | 15% |
81 Properties |
| 2006 | £325,490 | 6% |
93 Properties |
| 2005 | £306,870 | 1% |
65 Properties |
| 2004 | £304,978 | 13% |
60 Properties |
| 2003 | £265,207 | 7% |
80 Properties |
| 2002 | £247,513 | 11% |
89 Properties |
| 2001 | £219,283 | 11% |
85 Properties |
| 2000 | £194,993 | 17% |
80 Properties |
| 1999 | £161,771 | 21% |
75 Properties |
| 1998 | £127,597 | -10% |
65 Properties |
| 1997 | £140,475 | 16% |
73 Properties |
| 1996 | £117,726 | 9% |
74 Properties |
| 1995 | £107,547 | - |
69 Properties |
Property Price per Property Type in Hartley And Hodsoll Street
Here you can find historic sold price data in order to help with your property search.
The average Property Paid Price for specific property types in the last three years are:
| Property Type | Average Sold Price | Sold Properties |
|---|---|---|
| Semi Detached House | £550,642.00 | 65 Semi Detached Houses |
| Detached House | £784,394.00 | 128 Detached Houses |
| Terraced House | £334,785.00 | 35 Terraced Houses |
| Flat | £261,781.00 | 16 Flats |

