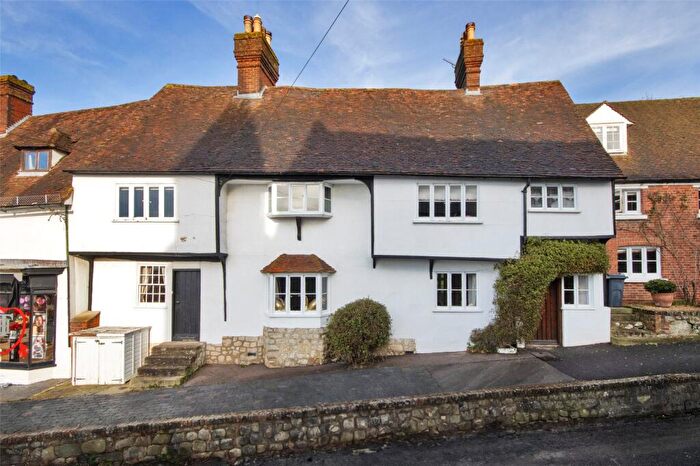
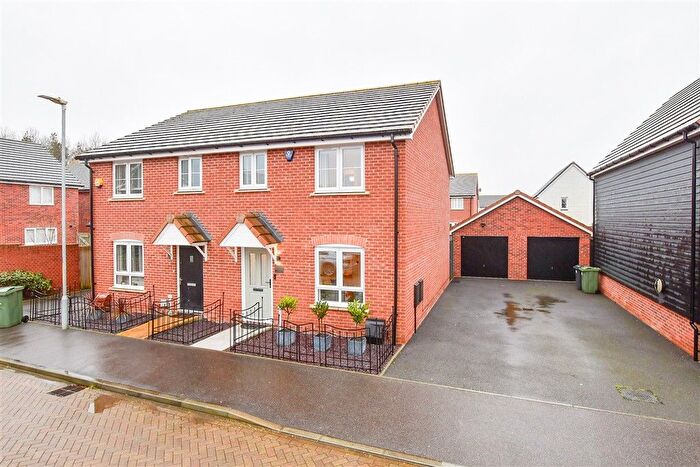
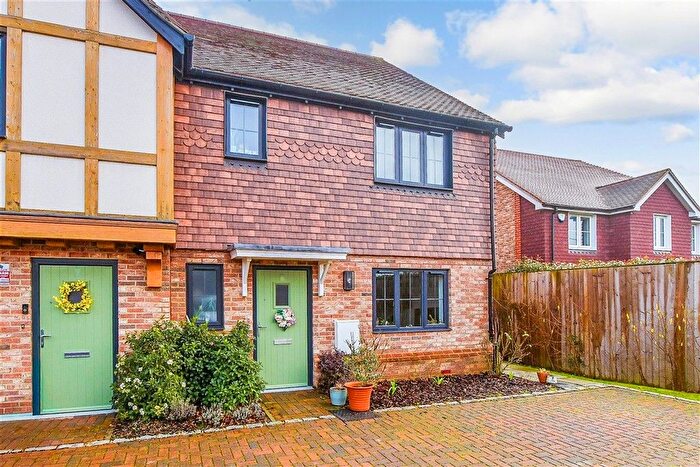
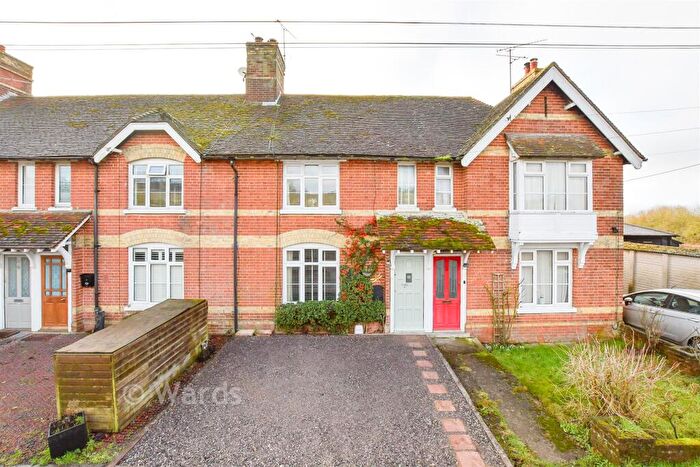
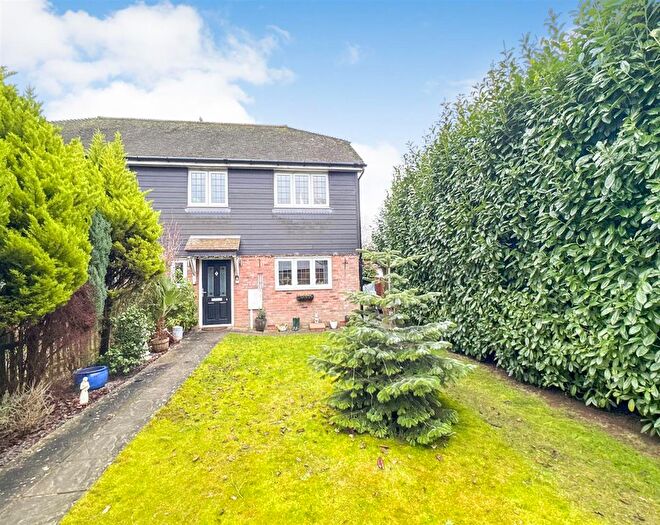
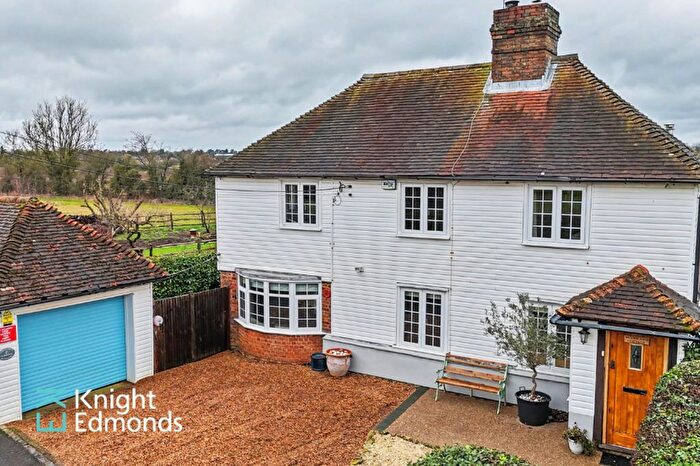
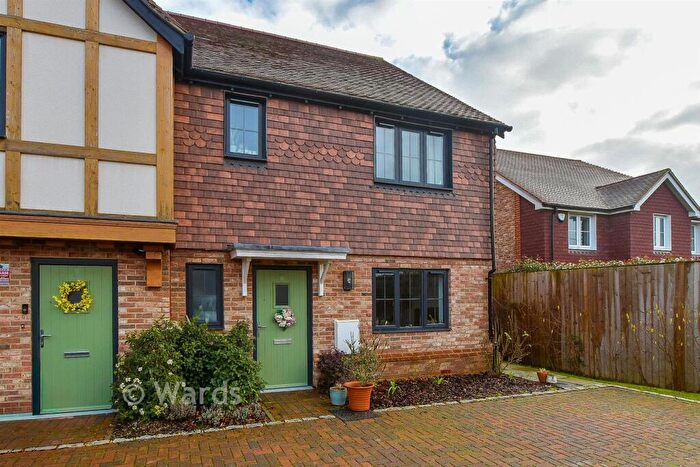
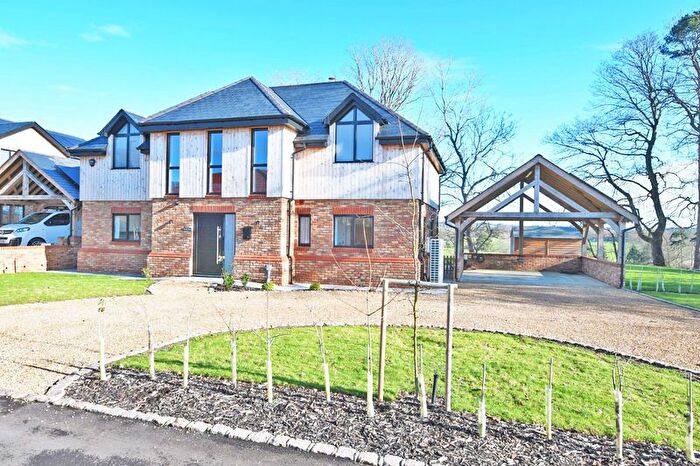
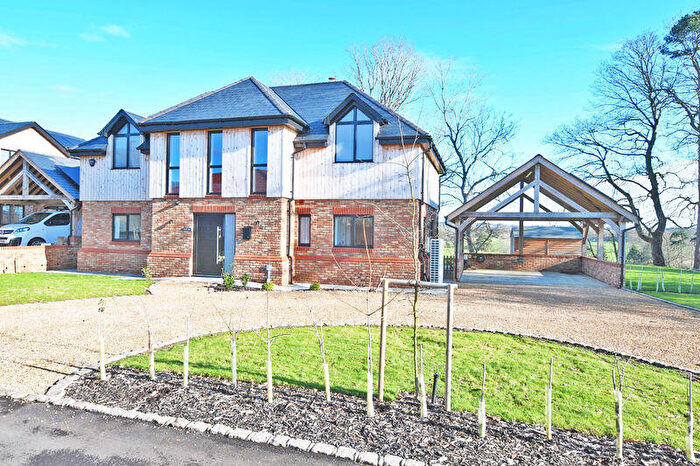
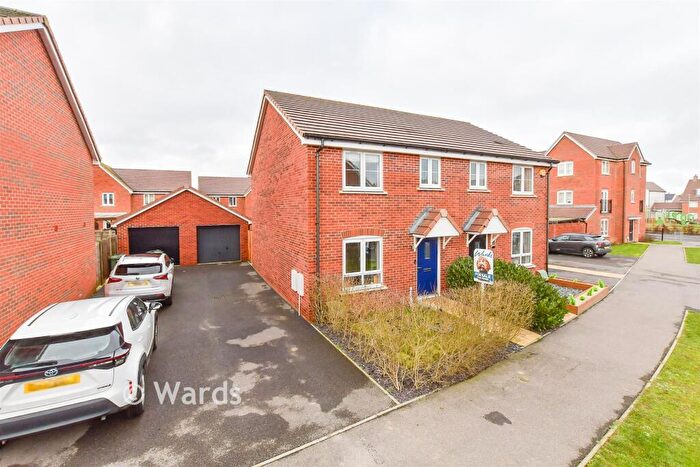
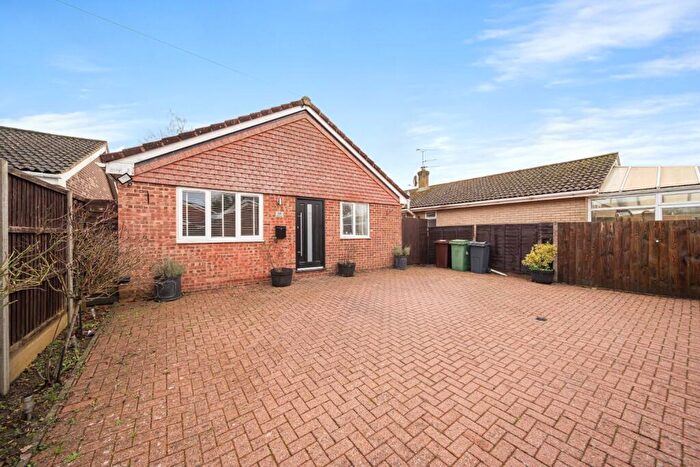
Houses for sale & to rent in Sutton Valence And Langley, Maidstone
House Prices in Sutton Valence And Langley
Properties in Sutton Valence And Langley have an average house price of £490,565.00 and had 91 Property Transactions within the last 3 years¹.
Sutton Valence And Langley is an area in Maidstone, Kent with 1,078 households², where the most expensive property was sold for £1,475,000.00.
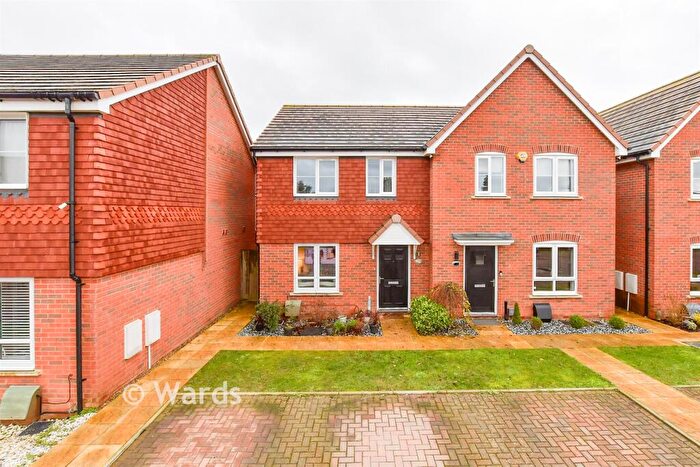
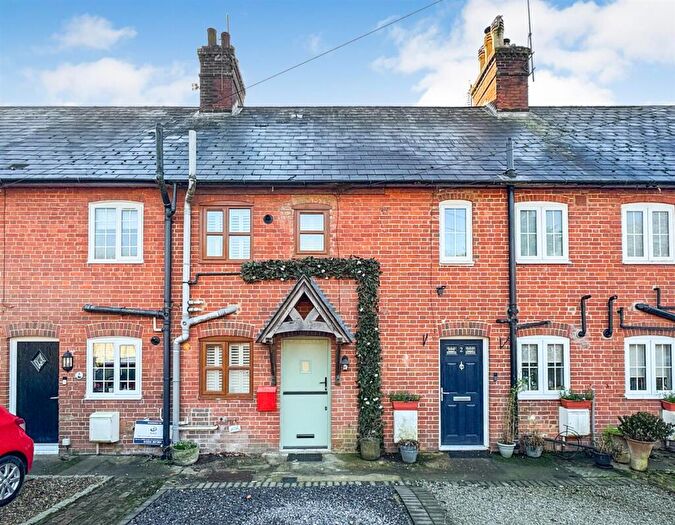
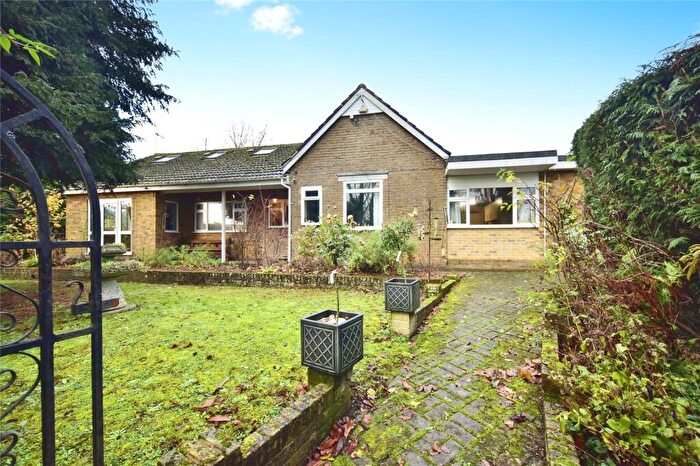
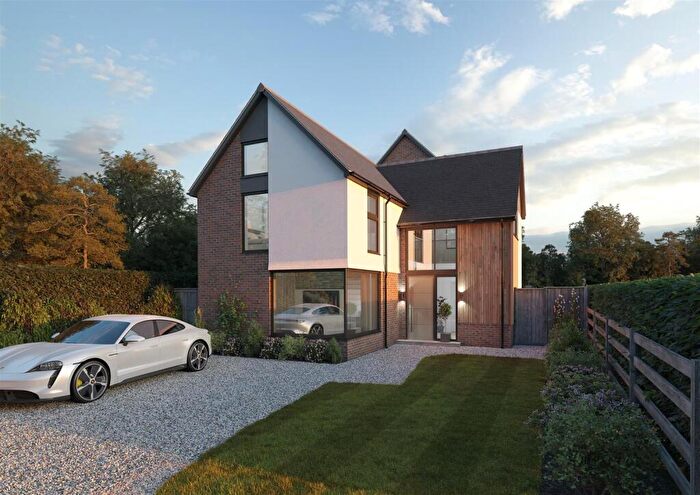
Properties for sale in Sutton Valence And Langley
Roads and Postcodes in Sutton Valence And Langley
Navigate through our locations to find the location of your next house in Sutton Valence And Langley, Maidstone for sale or to rent.
| Streets | Postcodes |
|---|---|
| Albertine Road | ME17 3UP |
| Bella Rosa Drive | ME17 3US |
| Boyton Court Road | ME17 3BX ME17 3BY ME17 3EG |
| Brishing Road | ME17 3SP |
| Broad Street | ME17 3AJ |
| Captains Close | ME17 3BA |
| Chapel Road | ME17 3AH |
| Chart Road | ME17 3AW |
| Chartway Street | ME17 3HX ME17 3JA ME17 3DN |
| Collingwood Industrial Estate | ME17 3QS |
| Copperfield Drive | ME17 1SX ME17 1SY |
| Dickens Close | ME17 1TB |
| East Sutton Road | ME17 3DB |
| Eden Road | ME17 3UG ME17 3UH |
| Forsham Lane | ME17 3EW |
| Forsters | ME17 3JT |
| Four Wents | ME17 3JF |
| Gardenia Road | ME17 3UF |
| Grasslands | ME17 3JJ |
| Green Lane | ME17 3JP ME17 3JR ME17 3JW |
| Greensand Meadow | ME17 3FP |
| Gullands | ME17 1SU |
| Handel Road | ME17 3UR |
| Haven Close | ME17 3EQ |
| Headcorn Road | ME17 3EH ME17 3EL |
| Heath Field | ME17 3JL |
| Heath Road | ME17 3JX ME17 3LD ME17 3LH |
| Heniker Lane | ME17 3ED ME17 3EE |
| High Street | ME17 3AG |
| Hopfields | ME17 3FR |
| Horseshoes Lane | ME17 1SR ME17 3JY ME17 3JZ ME17 1ST ME17 1TD ME17 3NA |
| Lacey Close | ME17 3LA |
| Leeds Road | ME17 3JG ME17 3JH ME17 3JN ME17 3JQ ME17 3LT |
| Lower Road | ME17 3AL ME17 3BH ME17 3BJ ME17 3BL ME17 3BN ME17 3BP ME17 3BW |
| Maidstone Road | ME17 3LN ME17 3LR ME17 3LW |
| Mandarin Road | ME17 3UJ |
| Milford Place | ME17 3GL |
| New Road | ME17 3NE |
| North Street | ME17 3HS ME17 3HT ME17 3AP ME17 3HJ ME17 3HL ME17 3HN ME17 3HP ME17 3HR ME17 3HW |
| Oast Gardens | ME17 3YZ |
| Oast View | ME17 3FS |
| Orchard Close | ME17 3LL |
| Pearl Close | ME17 3UQ |
| Porters Corner | ME17 3JS |
| Porters Walk | ME17 3JU |
| Rectory Lane | ME17 3BS ME17 3BT |
| Ruby Close | ME17 3UT |
| Sapphire Park | ME17 3XZ |
| School Lane | ME17 3HH |
| Shepherds Close | ME17 3FQ |
| Shepherds Way | ME17 3LJ |
| Skinners Way | ME17 3LB |
| South Bank | ME17 3BE |
| South Lane | ME17 3AY ME17 3AZ ME17 3BB ME17 3BD ME17 3BG |
| Spring Gardens | ME17 3YE |
| Staplehurst Road | ME17 3EN |
| Sutton Road | ME17 3LX ME17 3LZ ME17 3ND ME17 3NF ME17 3NN ME17 3NQ ME17 3LU ME17 3LY |
| Sutton Valence Hill | ME17 3AU ME17 3AX ME17 3AR ME17 3AS ME17 3AT |
| The Brambles | ME17 3GZ |
| The Cobbs | ME17 3FT |
| The Harbour | ME17 3AB |
| The Oaks | ME17 3GJ |
| The Platt | ME17 3BQ |
| Tumblers Hill | ME17 3AD ME17 3AE ME17 3AF ME17 3DA |
| Turgis Close | ME17 3HD |
| Ulcombe Road | ME17 3JE |
| Valdene Close | ME17 3GS |
| Victory Terrace | ME17 3HU |
| Warmlake Business Estate | ME17 3LQ |
| Warmlake Orchard | ME17 3TU |
| Warmlake Road | ME17 3LP |
| Warrens Drive | ME17 3FN |
| Windmill Row | ME17 3LS |
| ME17 1EQ ME17 1WX ME17 3UZ ME17 3WD ME17 3WH ME17 3WJ ME17 3WZ ME17 3TY ME17 3TZ ME17 3UB ME17 3UD ME17 3UE ME17 3YD ME17 3ZA |
Transport near Sutton Valence And Langley
-
Hollingbourne Station
-
Harrietsham Station
-
Bearsted Station
-
Staplehurst Station
-
Headcorn Station
-
Maidstone West Station
- FAQ
- Price Paid By Year
- Property Type Price
Frequently asked questions about Sutton Valence And Langley
What is the average price for a property for sale in Sutton Valence And Langley?
The average price for a property for sale in Sutton Valence And Langley is £490,565. This amount is 33% higher than the average price in Maidstone. There are 1,175 property listings for sale in Sutton Valence And Langley.
What streets have the most expensive properties for sale in Sutton Valence And Langley?
The streets with the most expensive properties for sale in Sutton Valence And Langley are Maidstone Road at an average of £975,000, East Sutton Road at an average of £859,000 and Chart Road at an average of £804,500.
What streets have the most affordable properties for sale in Sutton Valence And Langley?
The streets with the most affordable properties for sale in Sutton Valence And Langley are School Lane at an average of £235,000, Sutton Valence Hill at an average of £250,000 and The Harbour at an average of £256,666.
Which train stations are available in or near Sutton Valence And Langley?
Some of the train stations available in or near Sutton Valence And Langley are Hollingbourne, Harrietsham and Bearsted.
Property Price Paid in Sutton Valence And Langley by Year
The average sold property price by year was:
| Year | Average Sold Price | Price Change |
Sold Properties
|
|---|---|---|---|
| 2025 | £477,235 | -4% |
34 Properties |
| 2024 | £497,821 | -0,3% |
28 Properties |
| 2023 | £499,189 | -5% |
29 Properties |
| 2022 | £523,664 | 11% |
47 Properties |
| 2021 | £465,439 | -1% |
81 Properties |
| 2020 | £468,964 | 5% |
28 Properties |
| 2019 | £444,445 | -25% |
47 Properties |
| 2018 | £554,866 | 15% |
68 Properties |
| 2017 | £472,752 | 14% |
52 Properties |
| 2016 | £407,730 | 18% |
46 Properties |
| 2015 | £335,259 | 4% |
48 Properties |
| 2014 | £321,693 | -2% |
54 Properties |
| 2013 | £328,422 | 1% |
38 Properties |
| 2012 | £323,770 | -4% |
35 Properties |
| 2011 | £336,968 | 8% |
35 Properties |
| 2010 | £311,360 | -8% |
43 Properties |
| 2009 | £336,321 | 20% |
28 Properties |
| 2008 | £267,897 | -10% |
22 Properties |
| 2007 | £295,203 | -9% |
53 Properties |
| 2006 | £322,129 | 21% |
50 Properties |
| 2005 | £254,689 | -14% |
42 Properties |
| 2004 | £289,449 | 29% |
40 Properties |
| 2003 | £204,576 | -1% |
40 Properties |
| 2002 | £207,325 | 19% |
55 Properties |
| 2001 | £167,111 | 7% |
42 Properties |
| 2000 | £155,790 | -2% |
41 Properties |
| 1999 | £158,706 | 24% |
49 Properties |
| 1998 | £121,135 | -3% |
35 Properties |
| 1997 | £124,555 | 7% |
41 Properties |
| 1996 | £116,340 | 14% |
34 Properties |
| 1995 | £100,413 | - |
33 Properties |
Property Price per Property Type in Sutton Valence And Langley
Here you can find historic sold price data in order to help with your property search.
The average Property Paid Price for specific property types in the last three years are:
| Property Type | Average Sold Price | Sold Properties |
|---|---|---|
| Semi Detached House | £379,823.00 | 17 Semi Detached Houses |
| Detached House | £615,666.00 | 48 Detached Houses |
| Terraced House | £343,804.00 | 23 Terraced Houses |
| Flat | £241,666.00 | 3 Flats |

