
Houses for sale in Maidstone, Kent
House Prices in Maidstone
Properties in Maidstone have an average house price of £372k and had 6,212 Property Transactions within the last 3 years.¹
Maidstone is an area in Kent with 64,139 households², where the most expensive property was sold for £2.7M.
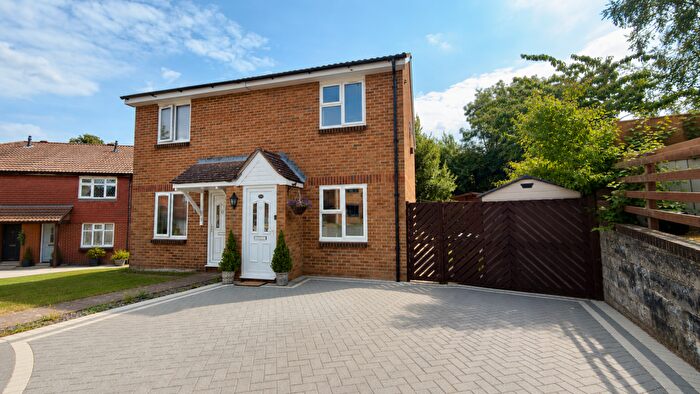
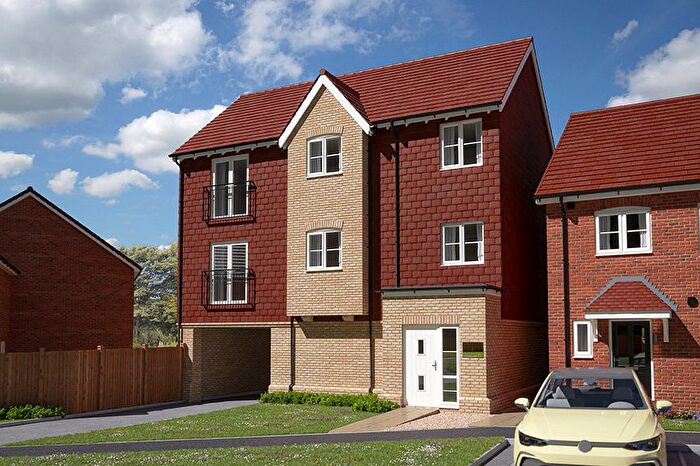
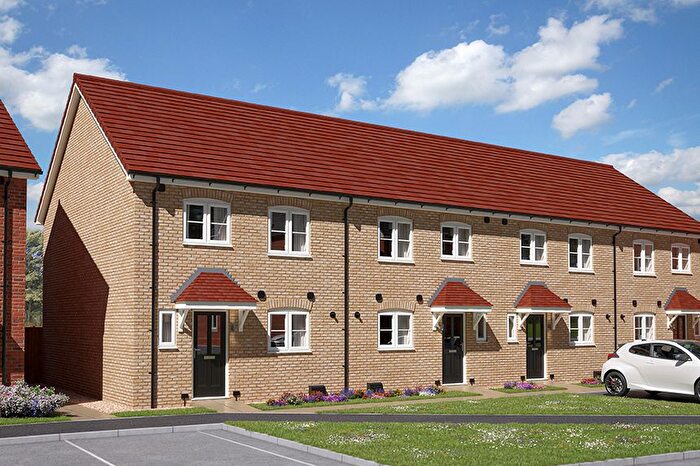
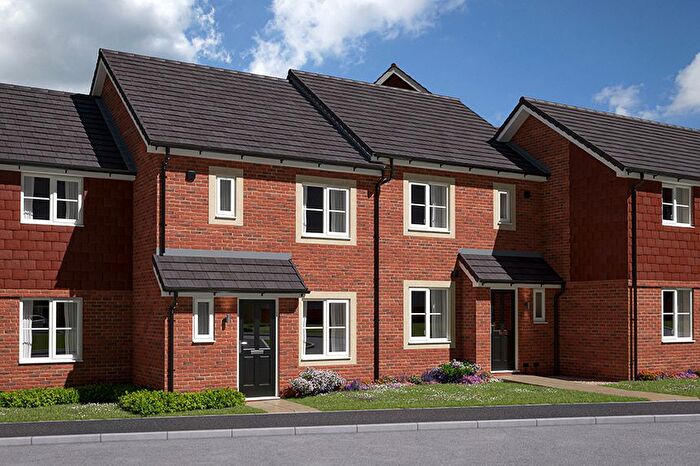
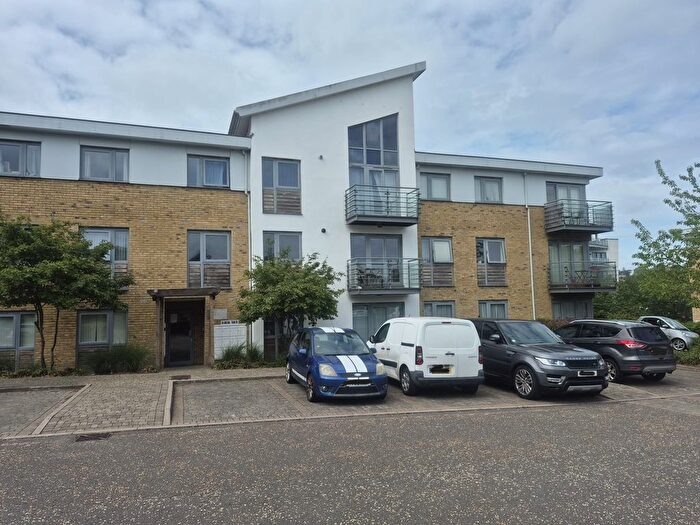
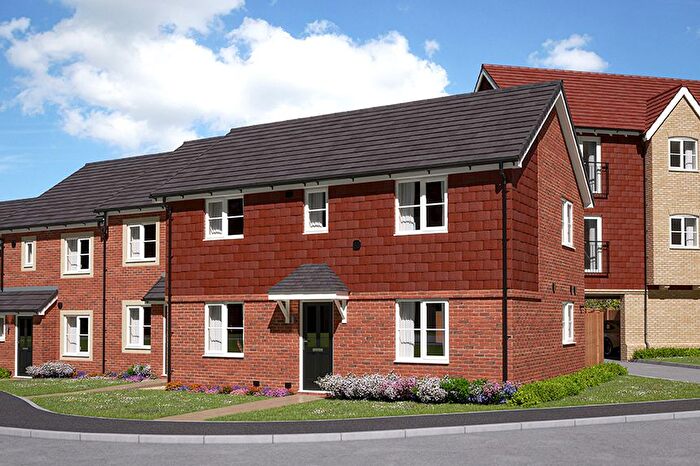
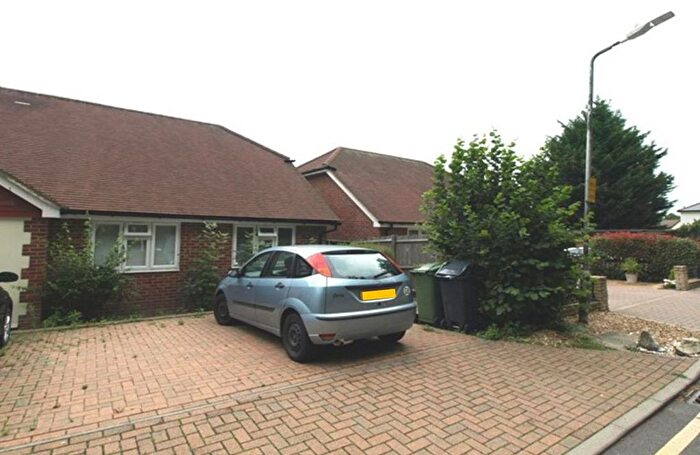
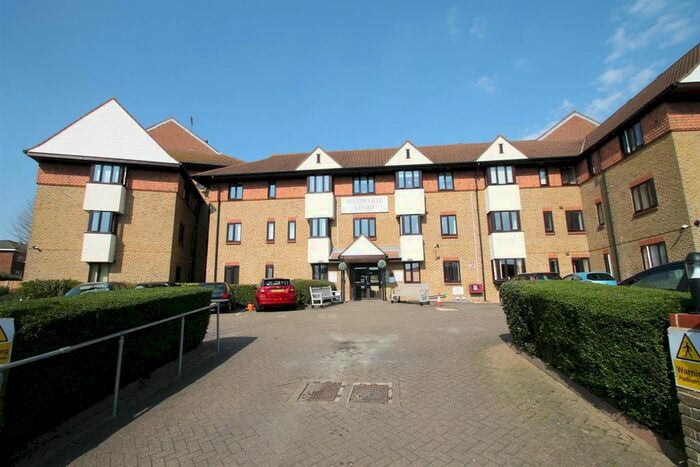
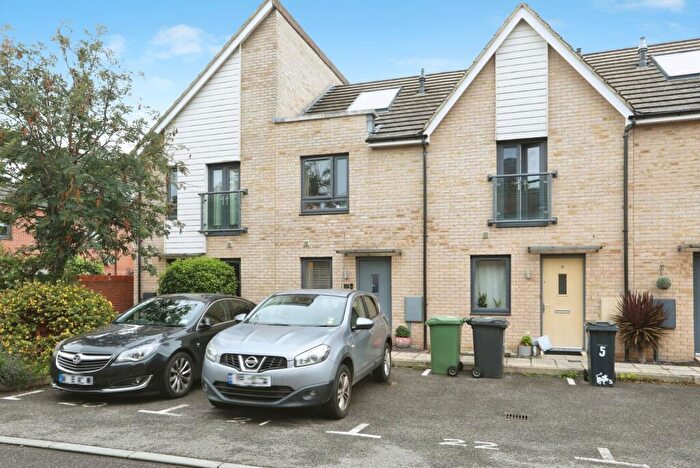
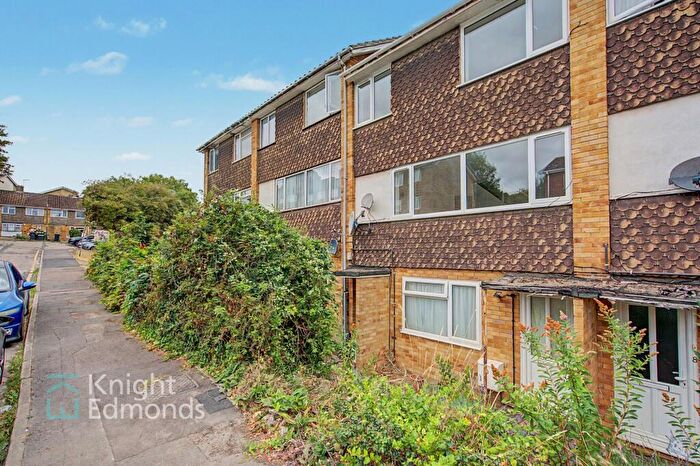
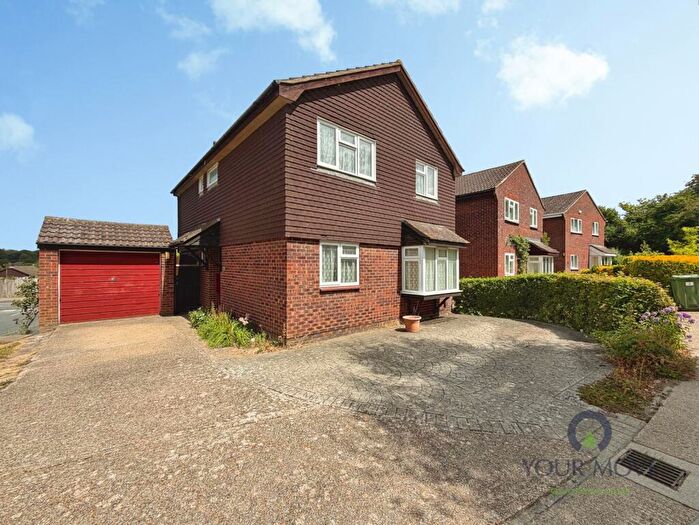
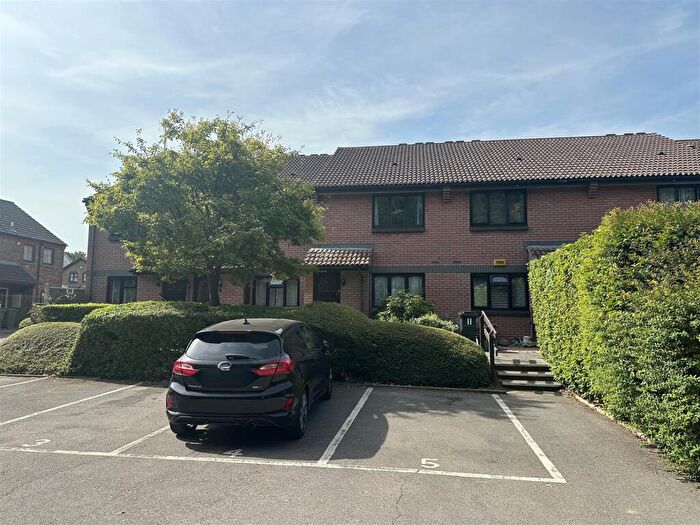
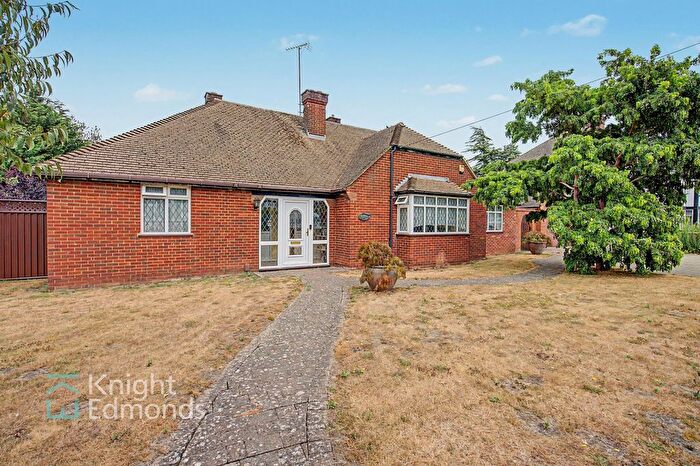
Properties for sale in Maidstone
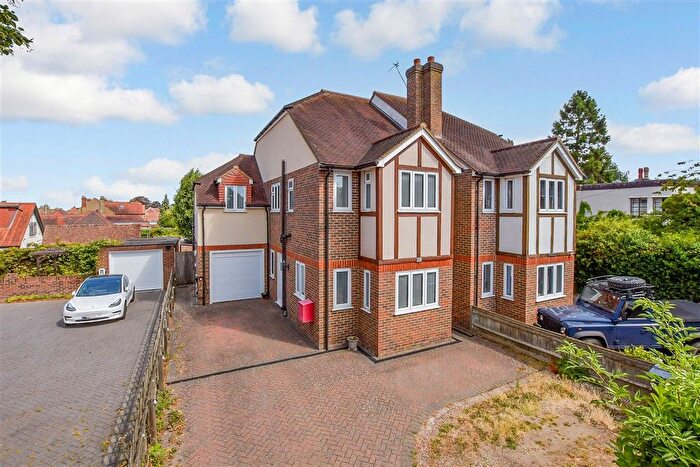
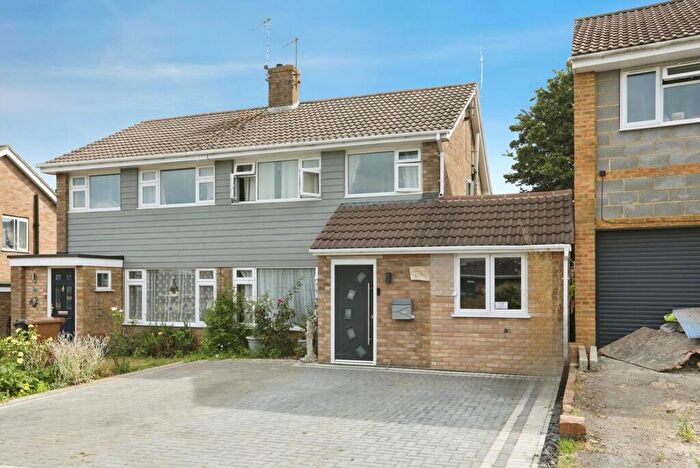
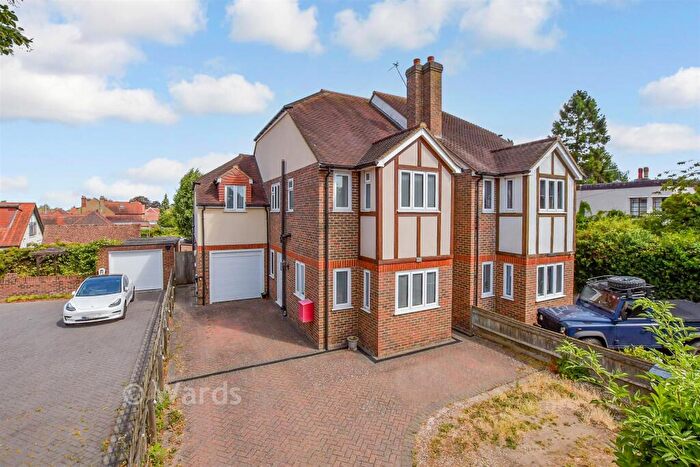
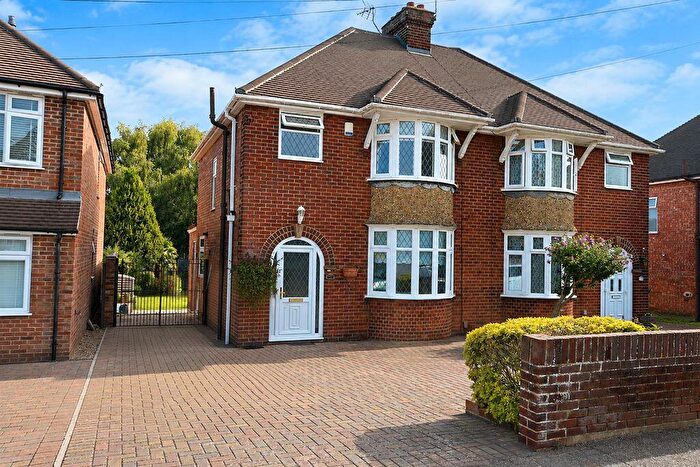
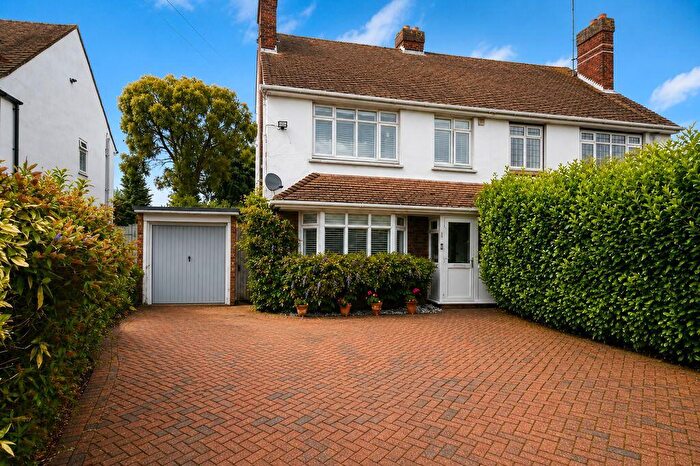

![]()
If you are looking to sell your house, let it out, or receive a property valuation, an expert can help you.
Click the button below to get started.

Neighbourhoods in Maidstone
Navigate through our locations to find the location of your next house in Maidstone, Kent for sale or to rent.
- Fant
- Allington
- Aylesford
- Barming
- Bearsted
- Boughton Monchelsea And Chart Sutton
- Boxley
- Bridge
- Coxheath And Hunton
- Detling And Thurnham
- Downswood And Otham
- East
- East Peckham And Golden Green
- Hadlow, Mereworth And West Peckham
- Harrietsham And Lenham
- Headcorn
- Heath
- High Street
- Leeds
- Loose
- Marden And Yalding
- North
- North Downs
- Park Wood
- Shepway North
- Shepway South
- South
- Sutton Valence And Langley
- Wateringbury
- Weald Central
- Aylesford South
- Barming and Teston
- Upper Weald
- Downs and Mereworth
- East And West Peckham, Mereworth & Wateringbury
Property price trends in Maidstone
According to the latest Land Registry data, the average home in Maidstone sold for £391,131 in 2026. That figure comes from a substantial record of 80,309 sales logged over the past 31 years.
Prices have continued to climb over the last three years. Compared with 2023, when the typical sale came in around £364,135, that's a rise of roughly 7.4%.
Looking back five years, average prices are up about 5.6% since 2021, a gain of around £20,676 in cash terms.
Zoom out to the past decade for the fuller picture. Back in 2016, homes here averaged £288,596, so the typical sold price has climbed about 35.5% since then, roughly 3.1% a year. Stretch the view to fifteen years and that annual pace edges up closer to 3.8%.
Frequently asked questions about Maidstone
What is the average price for a property for sale in Maidstone?
The average price for a property for sale in Maidstone is £371,945. This amount is 5% lower than the average price in Kent. There are more than 10,000 property listings for sale in Maidstone.
What locations have the most expensive properties for sale in Maidstone?
The locations with the most expensive properties for sale in Maidstone are Headcorn at an average of £654,930, North Downs at an average of £650,603 and Hadlow, Mereworth And West Peckham at an average of £648,000.
What locations have the most affordable properties for sale in Maidstone?
The locations with the most affordable properties for sale in Maidstone are High Street at an average of £250,683, Fant at an average of £273,232 and North at an average of £301,091.
Which train stations are available in or near Maidstone?
Some of the train stations available in or near Maidstone are Maidstone West, Maidstone East and Maidstone Barracks.
Property Price Paid in Maidstone by Year
The average sold property price by year was:
| Year | Average Sold Price | Price Change |
Sold Properties
|
|---|---|---|---|
| 2026 | £391,131 | 2% |
164 Properties |
| 2025 | £383,453 | 4% |
2,014 Properties |
| 2024 | £366,624 | 1% |
2,081 Properties |
| 2023 | £364,135 | -5% |
1,953 Properties |
| 2022 | £382,665 | 3% |
2,432 Properties |
| 2021 | £370,455 | 9% |
3,443 Properties |
| 2020 | £337,105 | 4% |
2,406 Properties |
| 2019 | £323,551 | -1% |
2,342 Properties |
| 2018 | £326,428 | 4% |
2,822 Properties |
| 2017 | £312,424 | 8% |
3,310 Properties |
Property Price per Property Type in Maidstone
Here you can find historic sold price data in order to help with your property search.
The average Property Paid Price for specific property types in the last three years are:
| Property Type | Average Sold Price | Sold Properties |
|---|---|---|
| Semi Detached House | £388,188.00 | 2,041 Semi Detached Houses |
| Terraced House | £301,000.00 | 1,773 Terraced Houses |
| Detached House | £598,441.00 | 1,304 Detached Houses |
| Flat | £186,645.00 | 1,094 Flats |
Transport in Maidstone
Please see below transportation links in this area:
