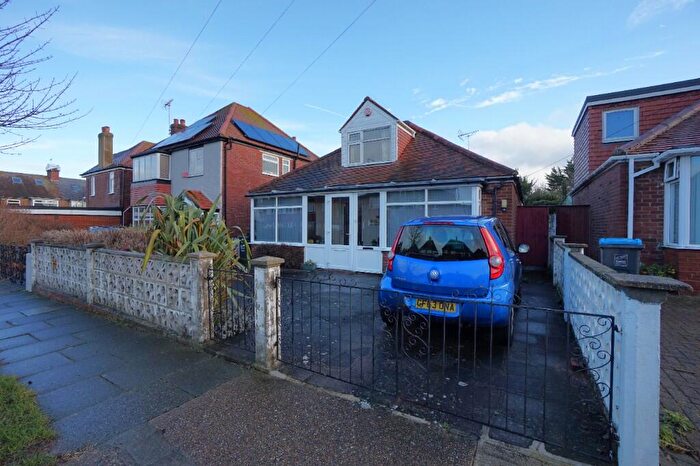
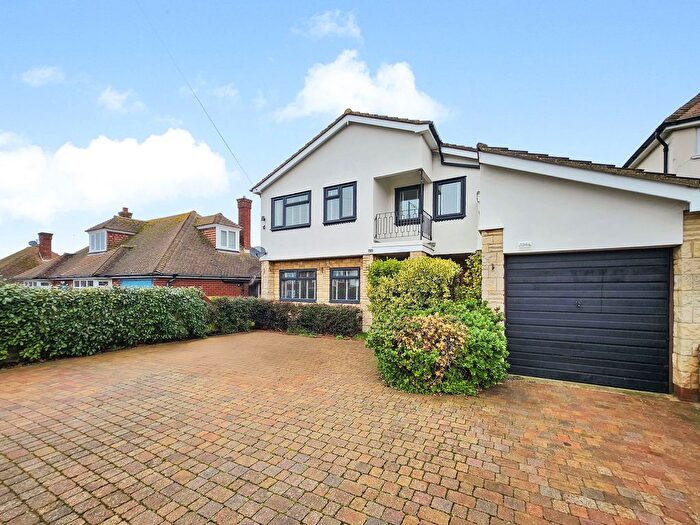
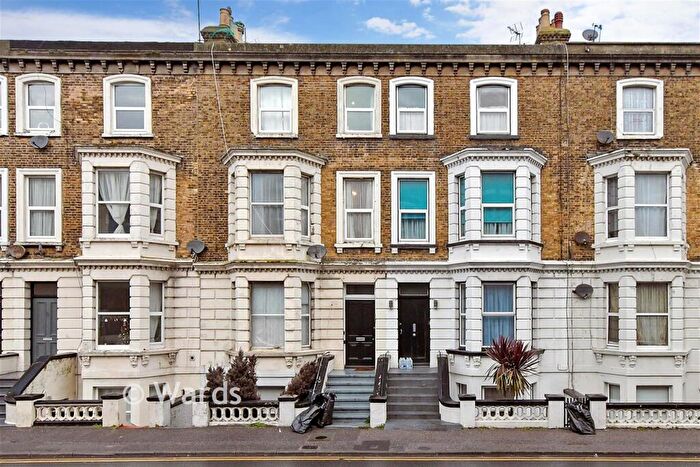
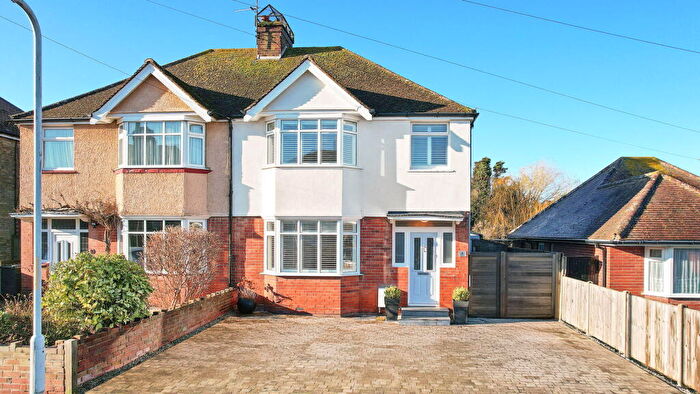
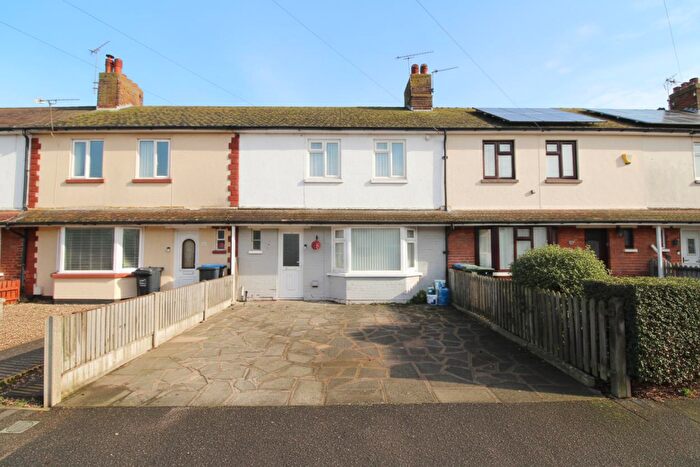
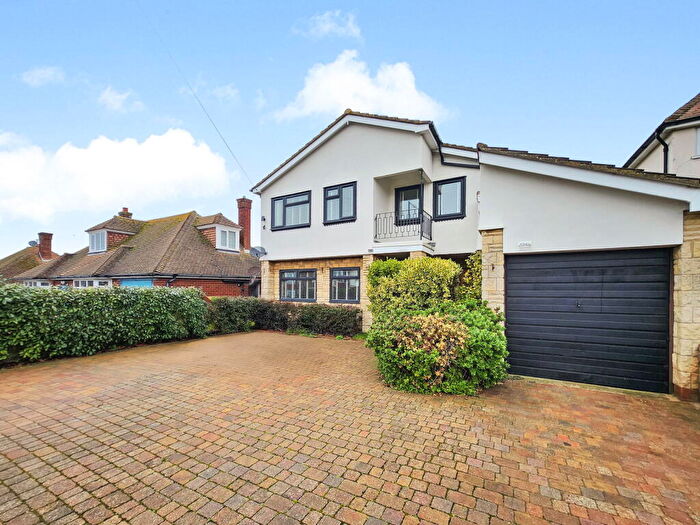
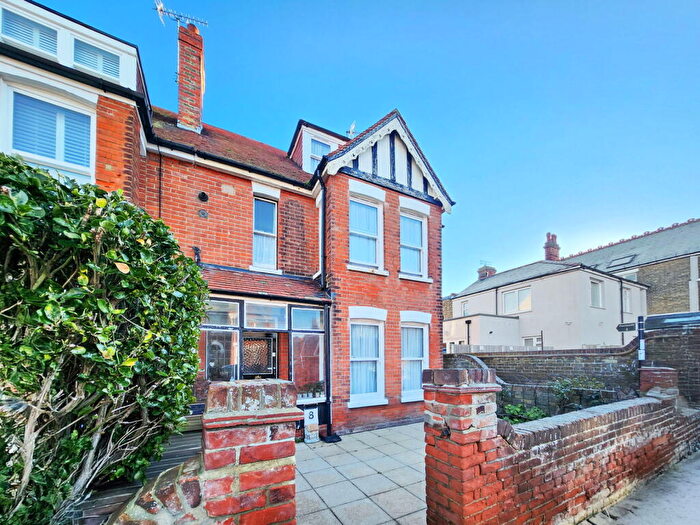
Houses for sale & to rent in Garlinge, Margate
House Prices in Garlinge
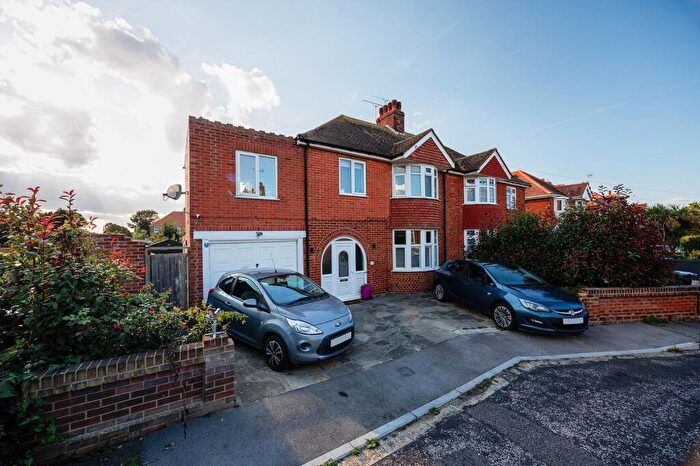
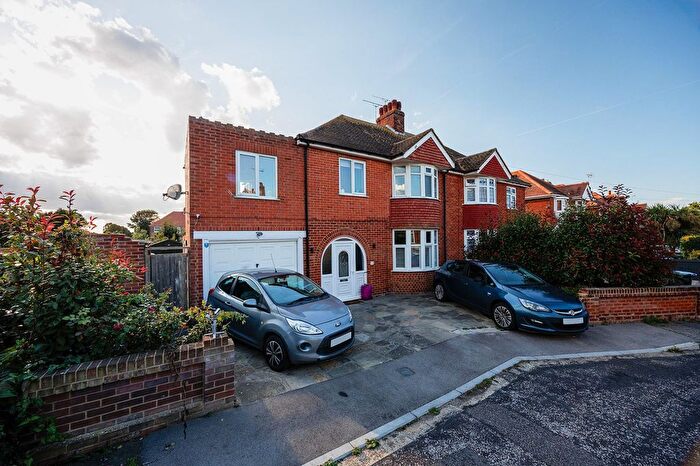
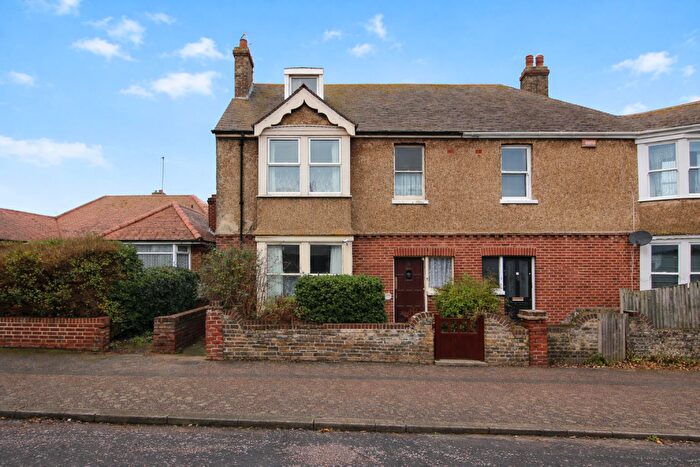
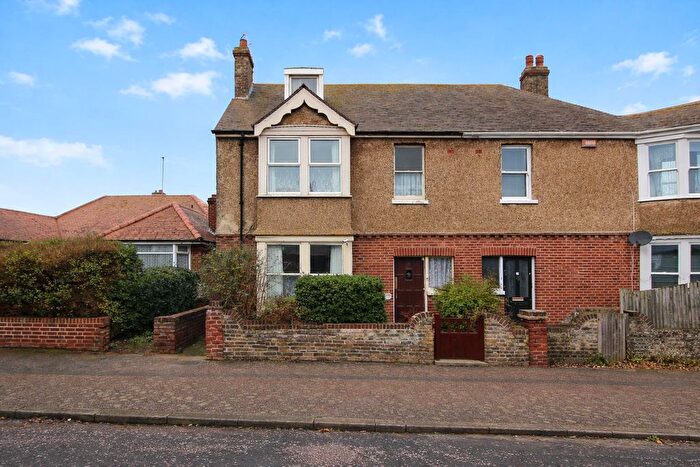
Properties in Garlinge have an average house price of £317,525.00 and had 146 Property Transactions within the last 3 years¹.
Garlinge is an area in Margate, Kent with 1,974 households², where the most expensive property was sold for £680,000.00.
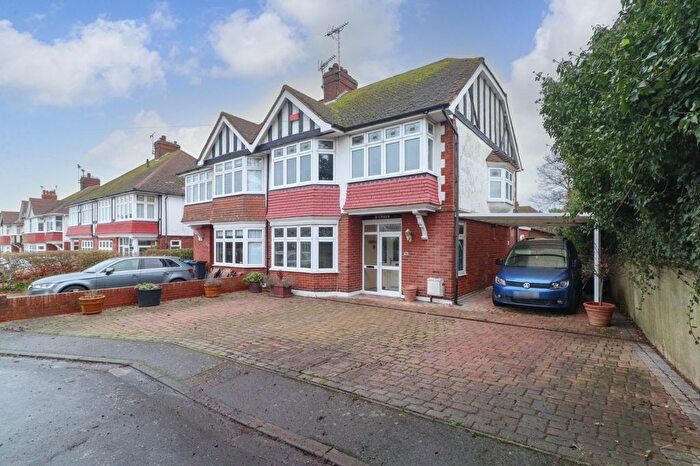
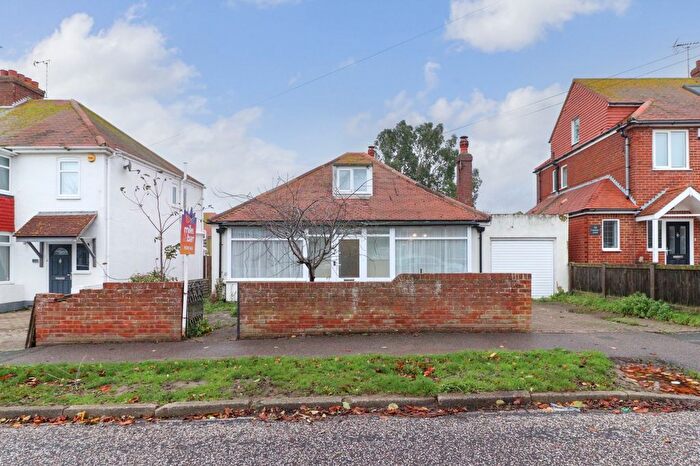
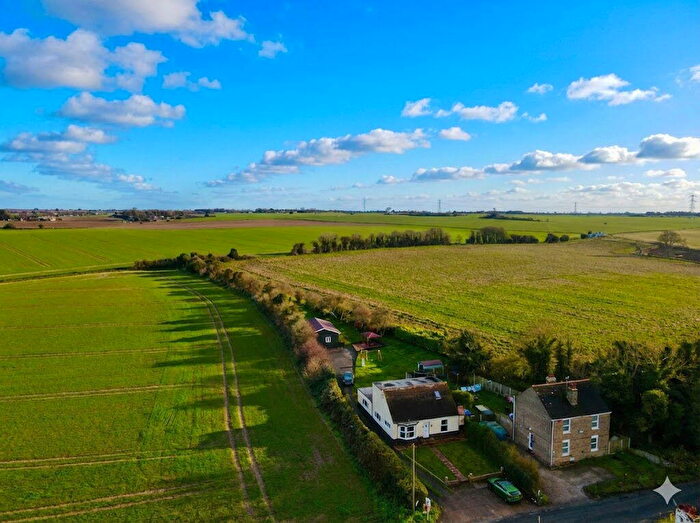
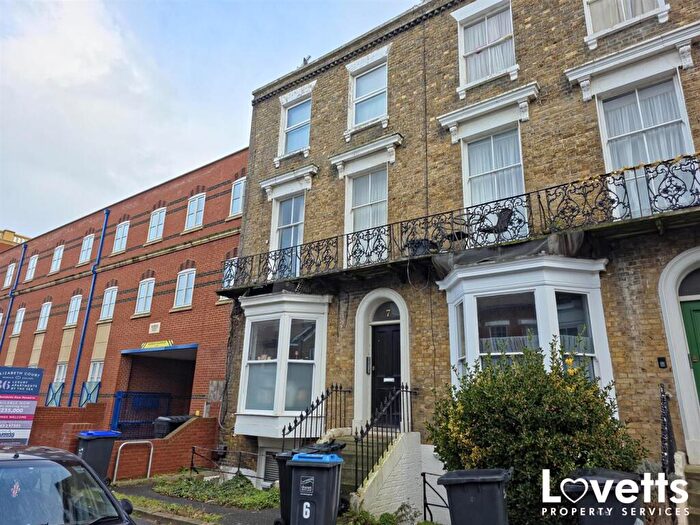
Properties for sale in Garlinge
Roads and Postcodes in Garlinge
Navigate through our locations to find the location of your next house in Garlinge, Margate for sale or to rent.
| Streets | Postcodes |
|---|---|
| Aby Court | CT9 5BU |
| Alicia Avenue | CT9 5JY CT9 5JZ |
| All Saints Avenue | CT9 5QH CT9 5QJ CT9 5QL CT9 5QN CT9 5QW |
| Argyle Avenue | CT9 5RN CT9 5RW |
| Argyle Gardens | CT9 5RL |
| Balmoral Road | CT9 5PG CT9 5PQ |
| Birds Avenue | CT9 5ND CT9 5NE |
| Briary Close | CT9 5HX |
| Brooke Avenue | CT9 5NG CT9 5NQ |
| Burlington Gardens | CT9 5QD |
| Camellia Close | CT9 5BX |
| Canterbury Road | CT9 5BY CT9 5DA CT9 5JA CT9 5JP CT9 5JR |
| Caxton Road | CT9 5NP CT9 5NR |
| Coronation Crescent | CT9 5PN CT9 5PW |
| Craven Close | CT9 5NW |
| Crowhill Road | CT9 5PE CT9 5PF |
| Dent De Lion Road | CT9 5LB CT9 5LE CT9 5LG |
| Dent De Lion Court | CT9 5LL |
| Edinburgh Road | CT9 5PH CT9 5PJ |
| Edinburgh Walk | CT9 5PL |
| Ellington Avenue | CT9 5PP |
| Fulham Avenue | CT9 5NL CT9 5NN |
| Fulsam Place | CT9 5QG |
| Garrard Avenue | CT9 5PY |
| George V Avenue | CT9 5PX CT9 5QA CT9 5RF CT9 5RH CT9 5RE |
| Glebe Gardens | CT9 5PS |
| Glebe Road | CT9 5PR |
| Grove Gardens | CT9 5RQ |
| Hartsdown Park | CT9 5QX |
| Hartsdown Road | CT9 5QP CT9 5QS CT9 5QT CT9 5RD CT9 5QY CT9 5QZ |
| Heather Close | CT9 5UL |
| High Street | CT9 5LN CT9 5LP CT9 5LR CT9 5LW CT9 5LX CT9 5LY CT9 5NA CT9 5EU |
| Highfield Gardens | CT9 5QU |
| Honeysuckle Close | CT9 5UN |
| Kingfisher Close | CT9 5LU |
| Kingston Avenue | CT9 5NH CT9 5NJ |
| Lavender Close | CT9 5UP |
| Lenham Gardens | CT9 5LT |
| Leslie Avenue | CT9 5NF |
| Leybourne Drive | CT9 5LQ |
| Maynard Avenue | CT9 5PT CT9 5PU |
| Michelle Gardens | CT9 5JX |
| Naylands | CT9 5QF |
| Noble Court | CT9 5LH |
| Noble Gardens | CT9 5LD |
| Oak Tree Grove | CT9 5LF |
| Roselawn Gardens | CT9 5JD |
| Stephens Close | CT9 5LZ |
| Swallow Close | CT9 5UJ |
| Troughton Mews | CT9 5QQ |
| Waverley Road | CT9 5QB |
| Wellis Gardens | CT9 5RG |
| Welsdene Road | CT9 5LS |
| Westfield Road | CT9 5NX CT9 5NY CT9 5NZ CT9 5PA CT9 5PB |
| Willow Way | CT9 5UA |
| CT9 5LA |
Transport near Garlinge
- FAQ
- Price Paid By Year
- Property Type Price
Frequently asked questions about Garlinge
What is the average price for a property for sale in Garlinge?
The average price for a property for sale in Garlinge is £317,525. This amount is 10% higher than the average price in Margate. There are 1,504 property listings for sale in Garlinge.
What streets have the most expensive properties for sale in Garlinge?
The streets with the most expensive properties for sale in Garlinge are Dent De Lion Court at an average of £670,000, Grove Gardens at an average of £500,000 and George V Avenue at an average of £486,000.
What streets have the most affordable properties for sale in Garlinge?
The streets with the most affordable properties for sale in Garlinge are Ellington Avenue at an average of £95,000, Fulsam Place at an average of £110,000 and Balmoral Road at an average of £111,666.
Which train stations are available in or near Garlinge?
Some of the train stations available in or near Garlinge are Margate, Westgate-On-Sea and Birchington-On-Sea.
Property Price Paid in Garlinge by Year
The average sold property price by year was:
| Year | Average Sold Price | Price Change |
Sold Properties
|
|---|---|---|---|
| 2025 | £333,813 | 11% |
43 Properties |
| 2024 | £298,624 | -8% |
48 Properties |
| 2023 | £321,285 | 2% |
55 Properties |
| 2022 | £316,327 | 5% |
77 Properties |
| 2021 | £300,736 | 11% |
103 Properties |
| 2020 | £267,227 | 6% |
67 Properties |
| 2019 | £250,183 | 3% |
65 Properties |
| 2018 | £242,109 | -8% |
68 Properties |
| 2017 | £260,374 | 12% |
66 Properties |
| 2016 | £229,165 | 16% |
72 Properties |
| 2015 | £192,866 | 10% |
83 Properties |
| 2014 | £173,896 | 6% |
68 Properties |
| 2013 | £162,638 | 4% |
69 Properties |
| 2012 | £155,405 | 5% |
54 Properties |
| 2011 | £147,685 | -14% |
52 Properties |
| 2010 | £167,705 | 9% |
49 Properties |
| 2009 | £152,107 | -9% |
53 Properties |
| 2008 | £166,443 | -9% |
56 Properties |
| 2007 | £180,740 | 4% |
90 Properties |
| 2006 | £174,071 | 7% |
106 Properties |
| 2005 | £161,817 | 6% |
97 Properties |
| 2004 | £151,938 | 14% |
112 Properties |
| 2003 | £130,160 | 16% |
84 Properties |
| 2002 | £109,051 | 20% |
121 Properties |
| 2001 | £87,746 | 8% |
91 Properties |
| 2000 | £80,335 | 21% |
75 Properties |
| 1999 | £63,549 | 13% |
71 Properties |
| 1998 | £55,470 | 3% |
79 Properties |
| 1997 | £53,922 | 9% |
100 Properties |
| 1996 | £49,201 | 2% |
62 Properties |
| 1995 | £48,206 | - |
56 Properties |
Property Price per Property Type in Garlinge
Here you can find historic sold price data in order to help with your property search.
The average Property Paid Price for specific property types in the last three years are:
| Property Type | Average Sold Price | Sold Properties |
|---|---|---|
| Semi Detached House | £342,725.00 | 83 Semi Detached Houses |
| Detached House | £472,382.00 | 17 Detached Houses |
| Terraced House | £270,076.00 | 26 Terraced Houses |
| Flat | £143,000.00 | 20 Flats |

