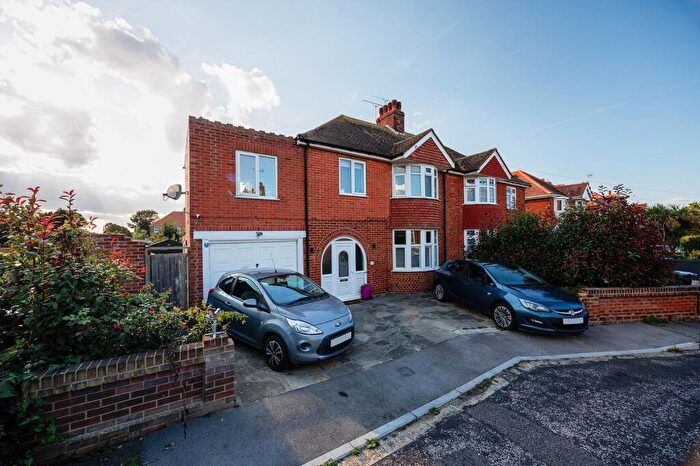
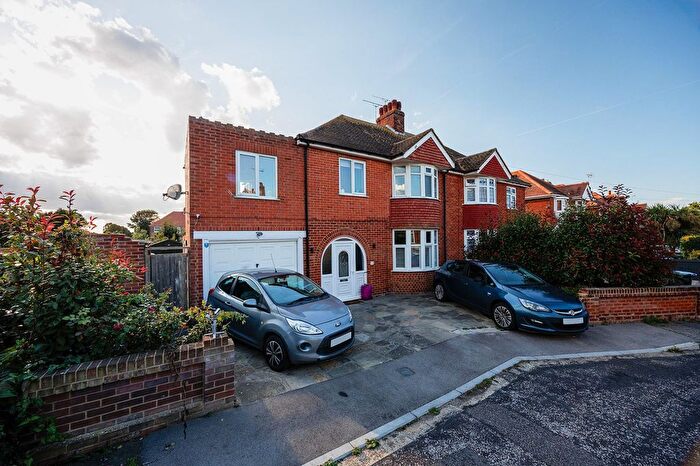
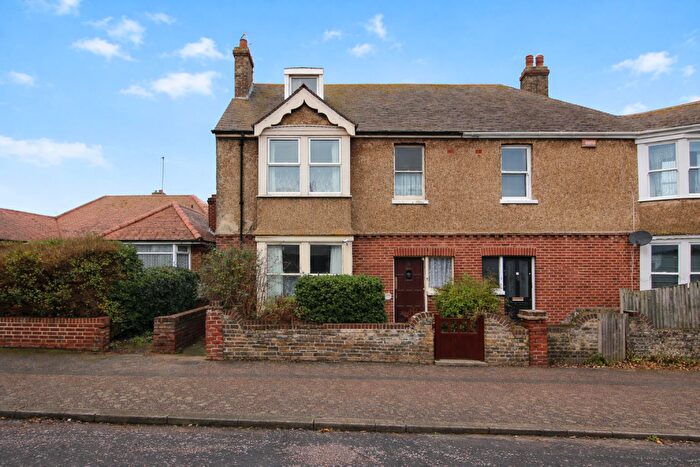
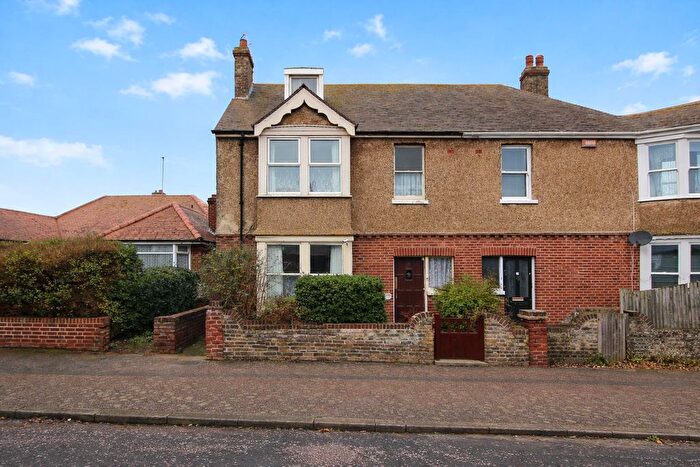
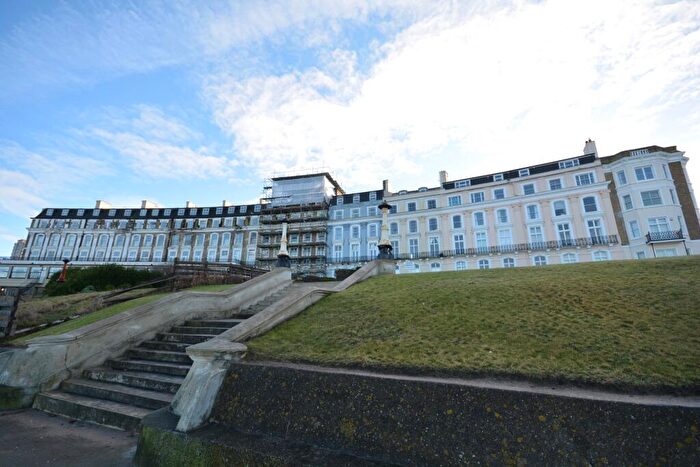
Houses for sale & to rent in Westbrook, Margate
House Prices in Westbrook
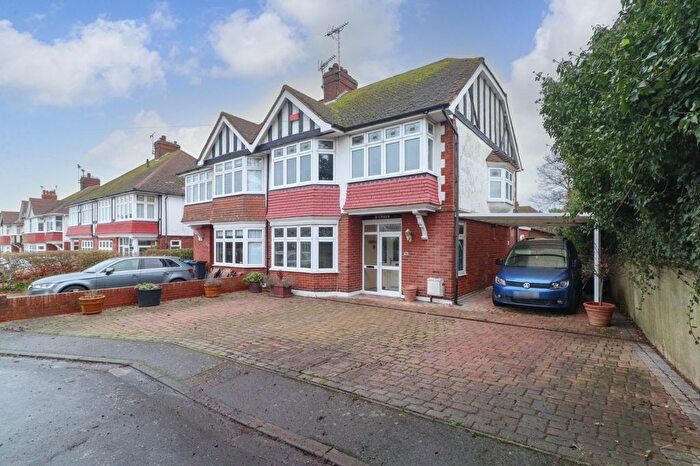
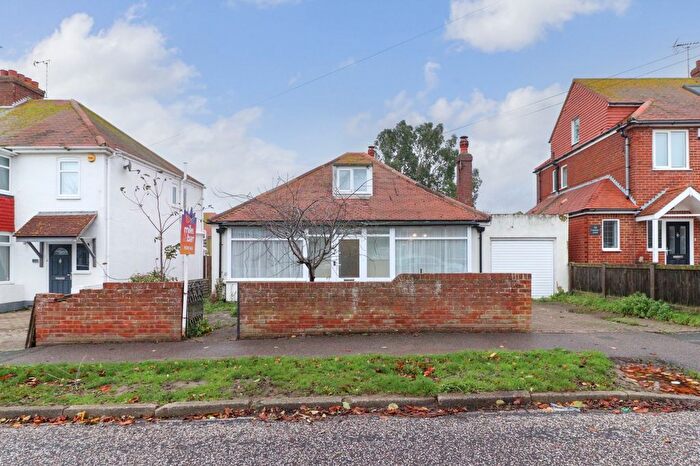
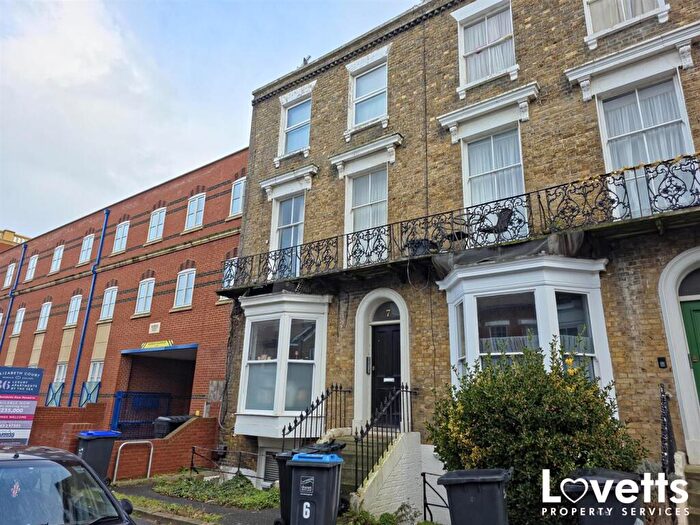
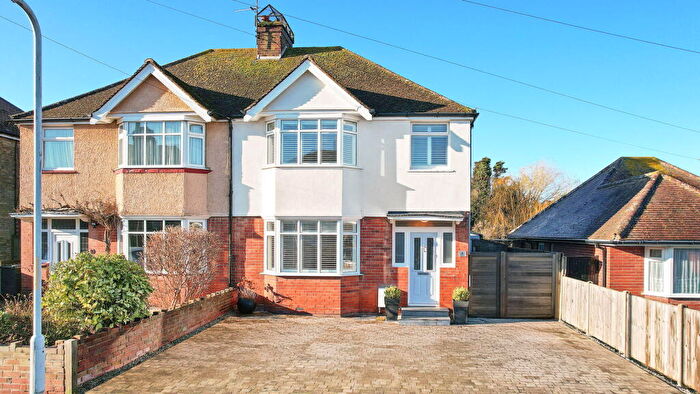
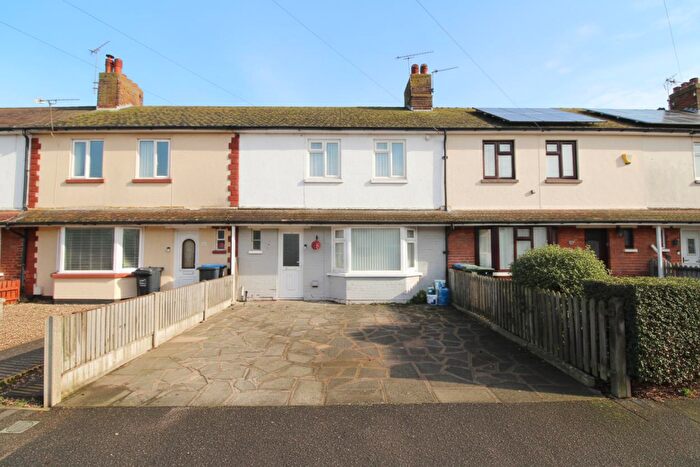
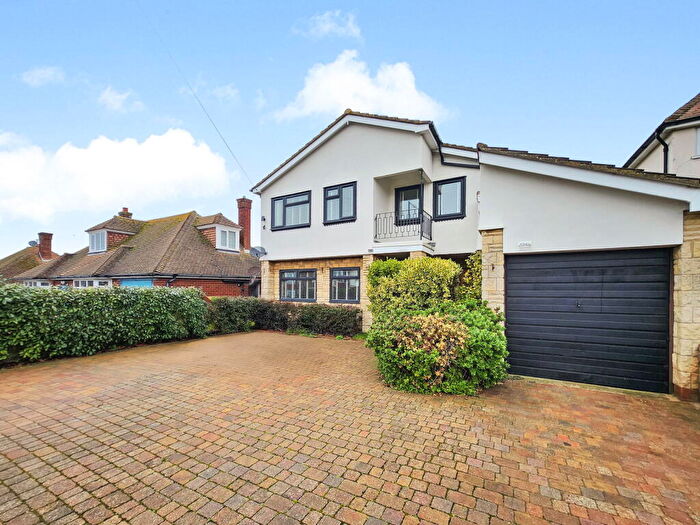
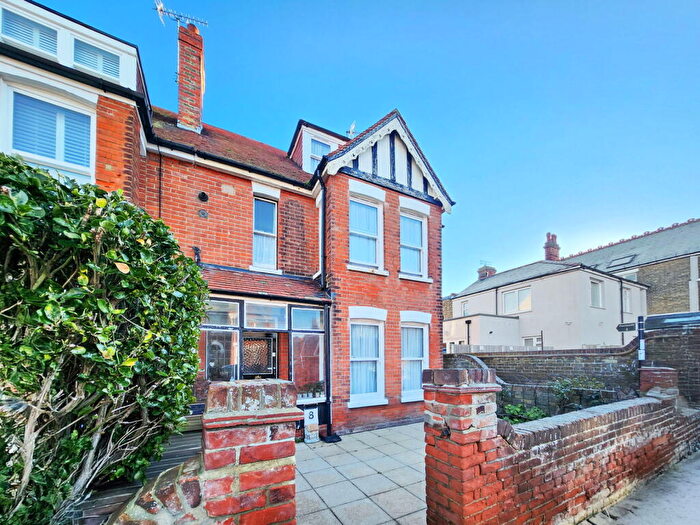
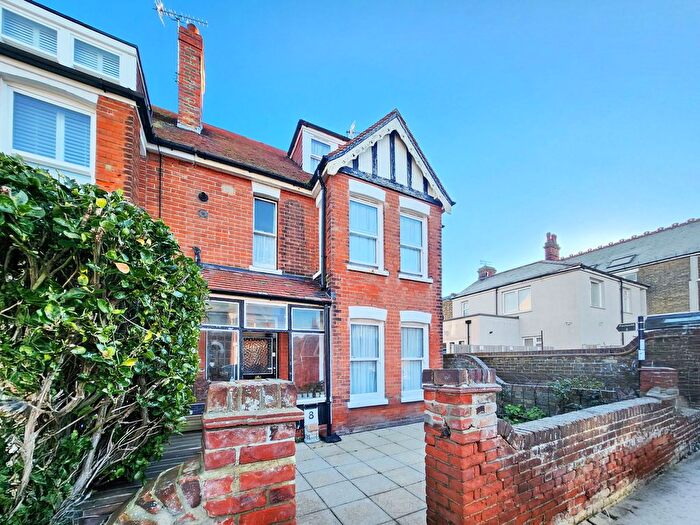
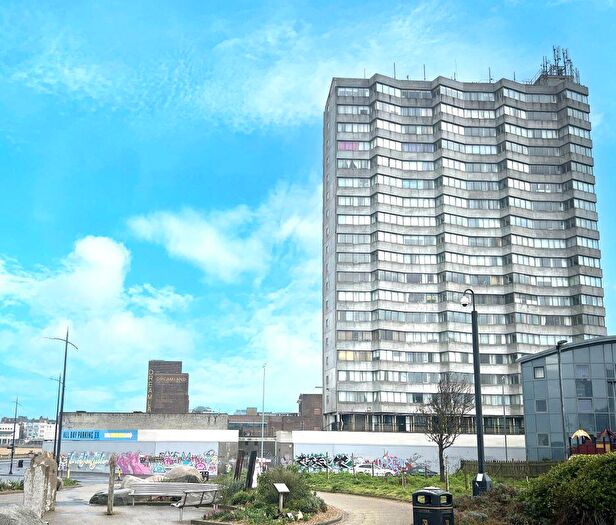
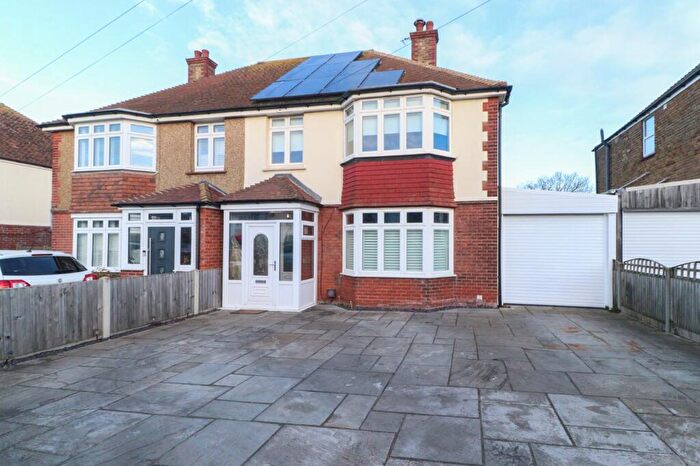
Properties in Westbrook have an average house price of £398,323.00 and had 163 Property Transactions within the last 3 years¹.
Westbrook is an area in Margate, Kent with 1,647 households², where the most expensive property was sold for £1,125,000.00.
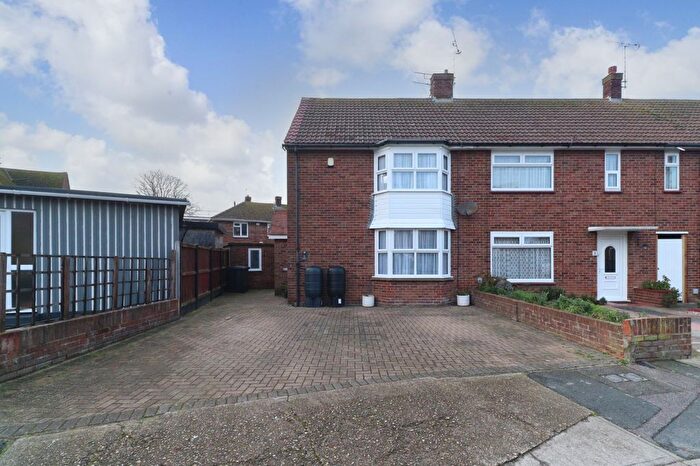
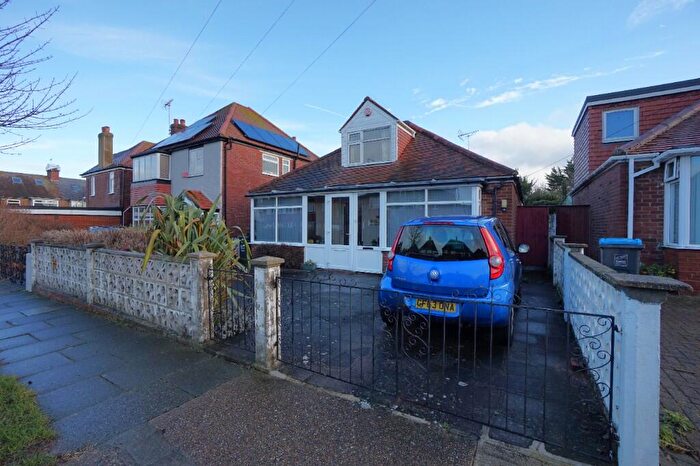
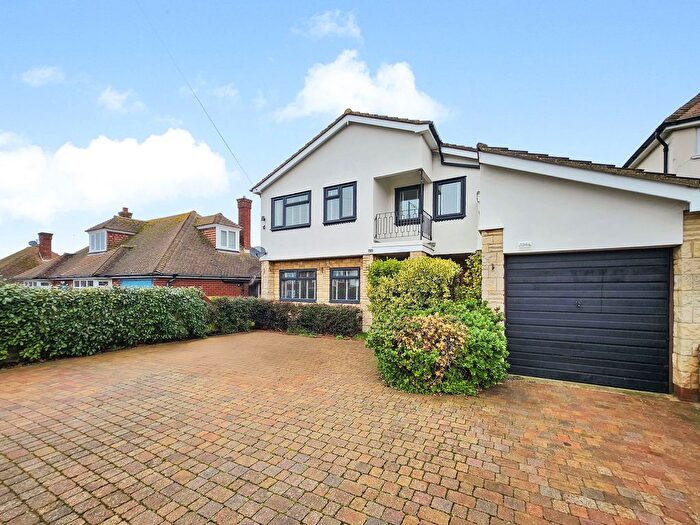
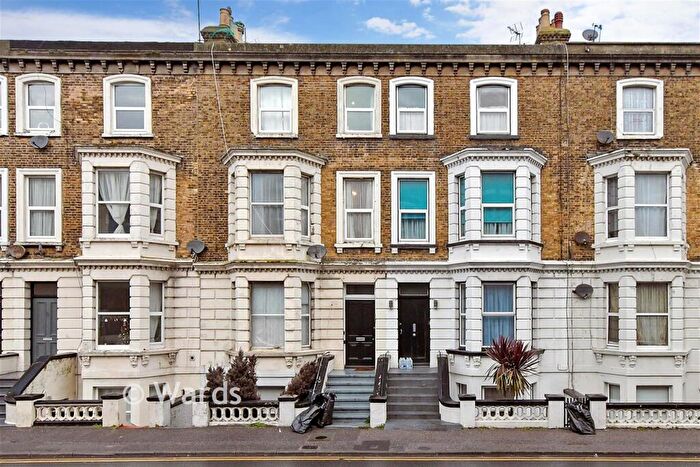
Properties for sale in Westbrook
Roads and Postcodes in Westbrook
Navigate through our locations to find the location of your next house in Westbrook, Margate for sale or to rent.
| Streets | Postcodes |
|---|---|
| Albert Road | CT9 5AN |
| All Saints Avenue | CT9 5FE |
| Audley Avenue | CT9 5HJ |
| Barn Crescent | CT9 5HF |
| Barnes Avenue | CT9 5EQ |
| Beach Houses | CT9 5AL |
| Boleyn Avenue | CT9 5HL |
| Bowes Avenue | CT9 5EP |
| Bridge Road | CT9 5JN |
| Buenos Ayres | CT9 5AE |
| Canterbury Road | CT9 5AQ CT9 5AS CT9 5AW CT9 5AX CT9 5BD CT9 5BG CT9 5BP CT9 5BS CT9 5BT CT9 5BW CT9 5DB CT9 5DF CT9 5JB CT9 5JU CT9 5JW CT9 5BN CT9 5DD CT9 5FB CT9 5FD CT9 5FH |
| Chapel Mews | CT9 5FL |
| Cliffe Avenue | CT9 5DU |
| Crescent Road | CT9 5AP |
| Edmanson Avenue | CT9 5EW |
| Fitzmary Avenue | CT9 5EL |
| Garfield Road | CT9 5AR |
| George Park | CT9 5ED CT9 5EY |
| Gresham Avenue | CT9 5EH |
| Hartsdown Road | CT9 5BB |
| Hatfeild Road | CT9 5AT CT9 5BL |
| Langham Close | CT9 5BZ |
| Marine Terrace | CT9 5BF |
| Meadow Road | CT9 5JJ |
| Mutrix Gardens | CT9 5HQ |
| Mutrix Road | CT9 5JL |
| Old Crossing Road | CT9 5JG CT9 5JH CT9 5JQ |
| Orchard Gardens | CT9 5JT |
| Orchard Road | CT9 5JS |
| Pembroke Avenue | CT9 5EA |
| Rancorn Road | CT9 5DG CT9 5DQ |
| Royal Crescent | CT9 5AJ |
| Royal Esplanade | CT9 5DL CT9 5DW CT9 5DX CT9 5DZ CT9 5EG CT9 5EJ CT9 5EN CT9 5ET CT9 5QE |
| Sea Bathing Terrace | CT9 5BQ |
| Sea View Terrace | CT9 5BJ |
| Seymour Avenue | CT9 5HT |
| Shakespeare Passage | CT9 5AG |
| St James Park Road | CT9 5HY CT9 5HZ |
| Station Approach | CT9 5AD |
| Station Road | CT9 5AF |
| The Courts | CT9 5HP |
| The Royal Seabathing | CT9 5NB CT9 5NT CT9 5NU |
| Tyson Avenue | CT9 5ER CT9 5ES |
| Wentworth Avenue | CT9 5HW |
| Westbrook Avenue | CT9 5HA CT9 5HB CT9 5HD CT9 5HE CT9 5HG CT9 5HH CT9 5HN CT9 5HS |
| Westbrook Cottages | CT9 5BE |
| Westbrook Gardens | CT9 5DJ CT9 5FN |
| Westbrook Road | CT9 5AU CT9 5BH |
| Westcliff Gardens | CT9 5DS CT9 5DT |
| Westcliff Road | CT9 5DH CT9 5DN |
| Westonville Avenue | CT9 5DY |
| CT9 5FJ |
Transport near Westbrook
- FAQ
- Price Paid By Year
- Property Type Price
Frequently asked questions about Westbrook
What is the average price for a property for sale in Westbrook?
The average price for a property for sale in Westbrook is £398,323. This amount is 38% higher than the average price in Margate. There are 1,569 property listings for sale in Westbrook.
What streets have the most expensive properties for sale in Westbrook?
The streets with the most expensive properties for sale in Westbrook are Beach Houses at an average of £1,115,000, Westcliff Gardens at an average of £798,750 and Barnes Avenue at an average of £640,333.
What streets have the most affordable properties for sale in Westbrook?
The streets with the most affordable properties for sale in Westbrook are Westbrook Road at an average of £175,000, The Royal Seabathing at an average of £190,357 and Hatfeild Road at an average of £238,900.
Which train stations are available in or near Westbrook?
Some of the train stations available in or near Westbrook are Margate, Westgate-On-Sea and Birchington-On-Sea.
Property Price Paid in Westbrook by Year
The average sold property price by year was:
| Year | Average Sold Price | Price Change |
Sold Properties
|
|---|---|---|---|
| 2025 | £374,809 | -12% |
55 Properties |
| 2024 | £418,481 | 4% |
55 Properties |
| 2023 | £401,805 | 9% |
53 Properties |
| 2022 | £366,501 | 5% |
117 Properties |
| 2021 | £348,768 | 3% |
126 Properties |
| 2020 | £338,419 | 13% |
68 Properties |
| 2019 | £295,176 | 3% |
78 Properties |
| 2018 | £285,307 | 7% |
108 Properties |
| 2017 | £266,229 | -1% |
116 Properties |
| 2016 | £269,152 | 12% |
117 Properties |
| 2015 | £235,555 | 20% |
81 Properties |
| 2014 | £188,302 | -3% |
135 Properties |
| 2013 | £193,702 | 6% |
74 Properties |
| 2012 | £181,942 | -6% |
72 Properties |
| 2011 | £192,285 | -6% |
54 Properties |
| 2010 | £203,749 | -5% |
62 Properties |
| 2009 | £214,300 | 13% |
48 Properties |
| 2008 | £186,250 | -2% |
64 Properties |
| 2007 | £189,484 | 3% |
160 Properties |
| 2006 | £184,208 | -3% |
122 Properties |
| 2005 | £188,962 | 13% |
77 Properties |
| 2004 | £165,167 | 6% |
127 Properties |
| 2003 | £155,925 | 28% |
109 Properties |
| 2002 | £113,015 | 16% |
96 Properties |
| 2001 | £94,500 | 5% |
77 Properties |
| 2000 | £89,793 | 19% |
89 Properties |
| 1999 | £73,166 | 4% |
97 Properties |
| 1998 | £69,945 | 11% |
101 Properties |
| 1997 | £62,464 | 3% |
94 Properties |
| 1996 | £60,608 | 14% |
71 Properties |
| 1995 | £51,940 | - |
73 Properties |
Property Price per Property Type in Westbrook
Here you can find historic sold price data in order to help with your property search.
The average Property Paid Price for specific property types in the last three years are:
| Property Type | Average Sold Price | Sold Properties |
|---|---|---|
| Semi Detached House | £400,137.00 | 40 Semi Detached Houses |
| Detached House | £610,205.00 | 39 Detached Houses |
| Terraced House | £494,625.00 | 24 Terraced Houses |
| Flat | £220,870.00 | 60 Flats |

