
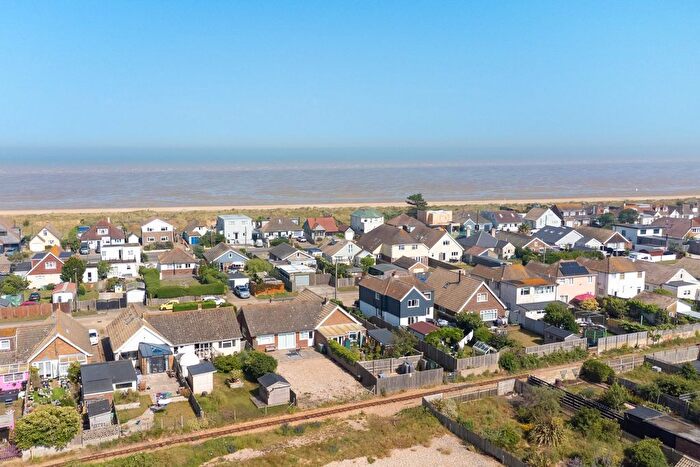
Houses for sale in Lydd, New Romney
House Prices in Lydd
Properties in Lydd have an average house price of £335k and had 43 Property Transactions within the last 3 years¹.
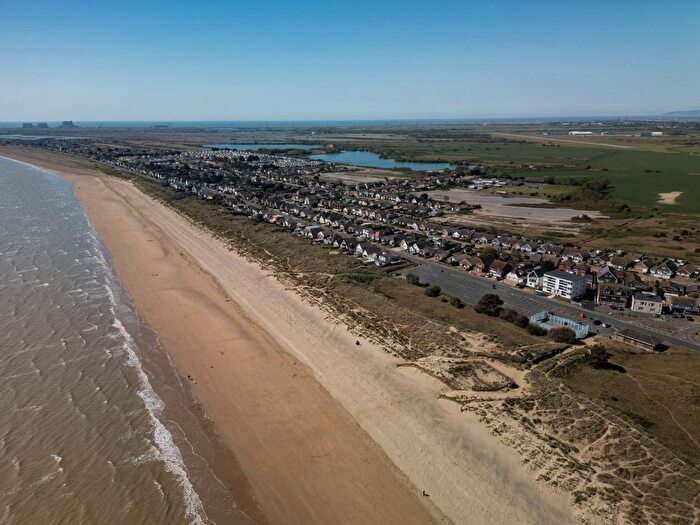
Lydd is an area in New Romney, Kent with 577 households², where the most expensive property was sold for £655k.
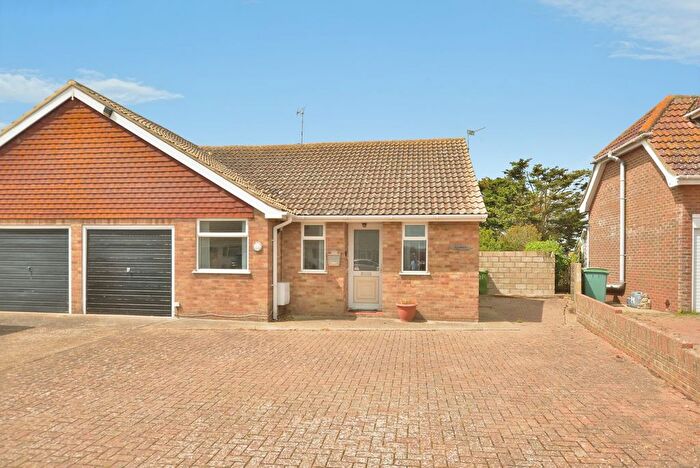
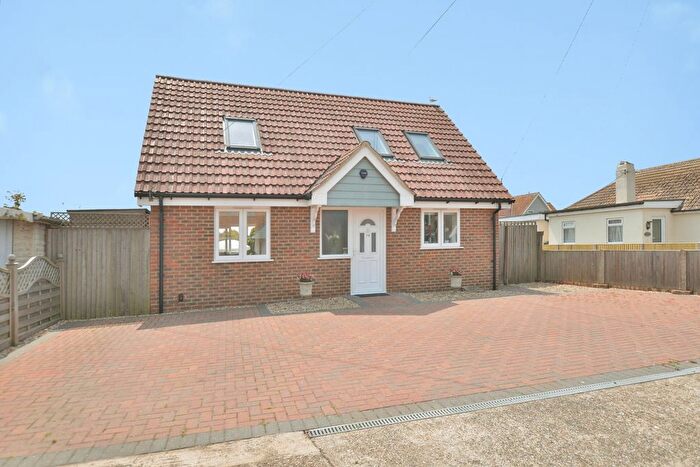
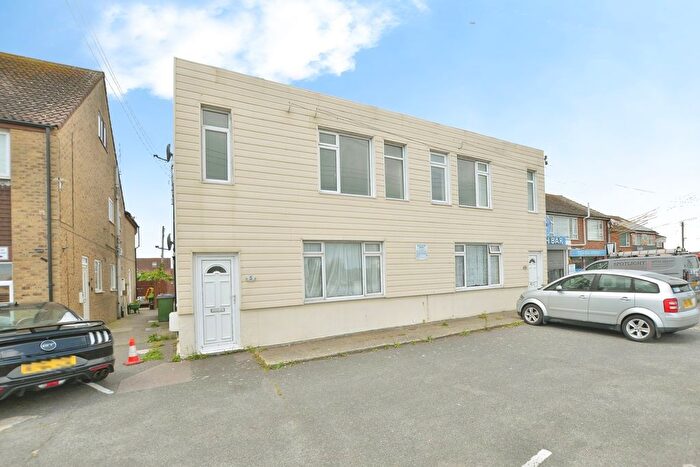
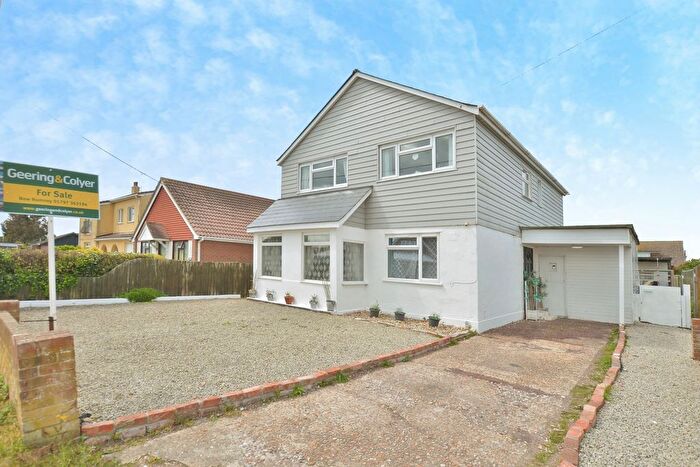
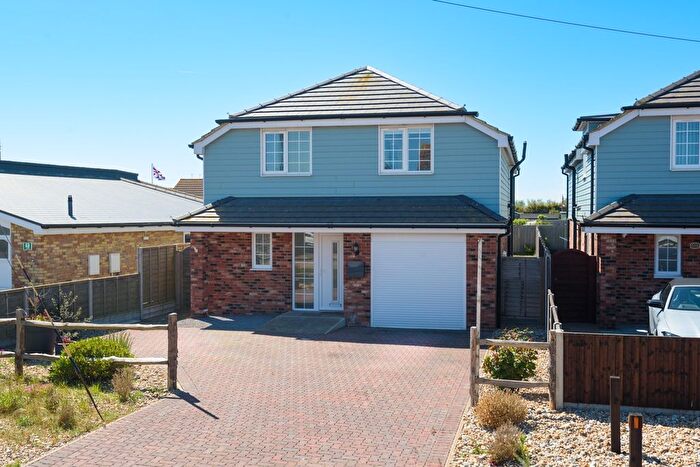
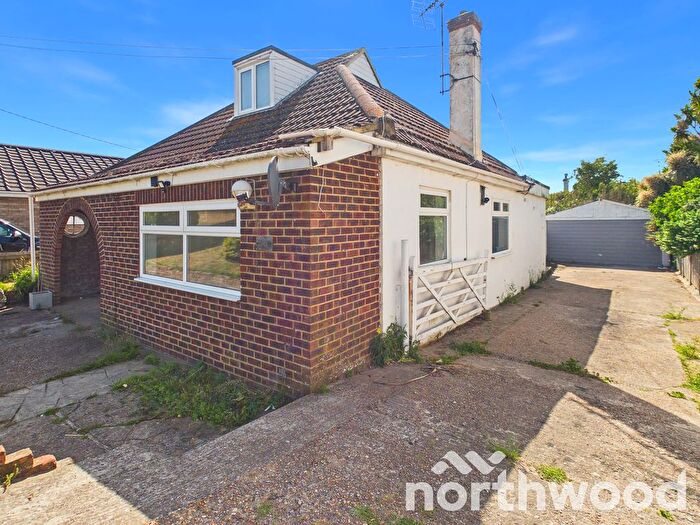
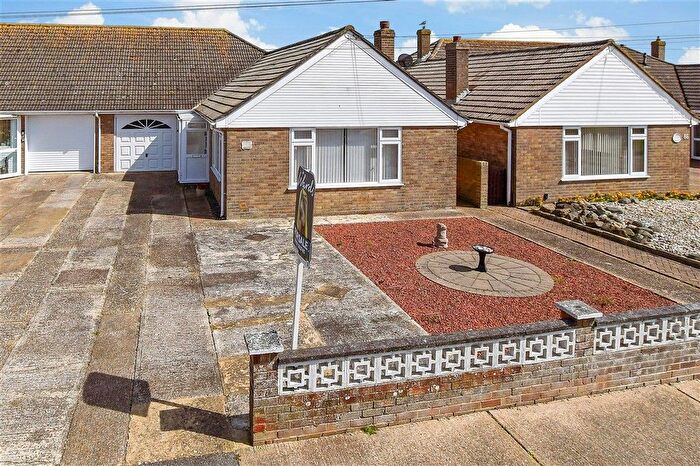
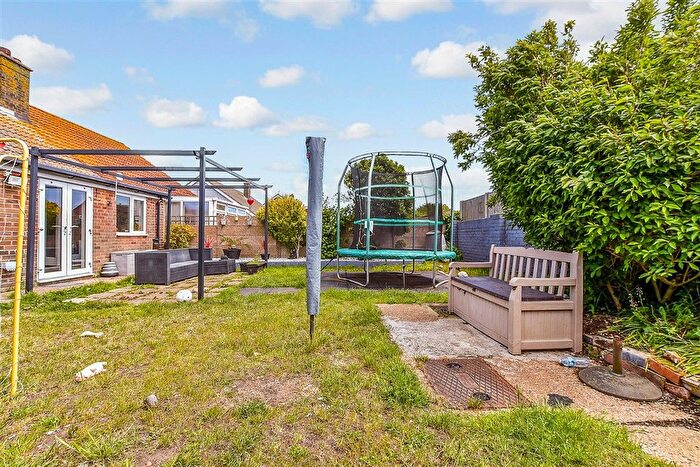
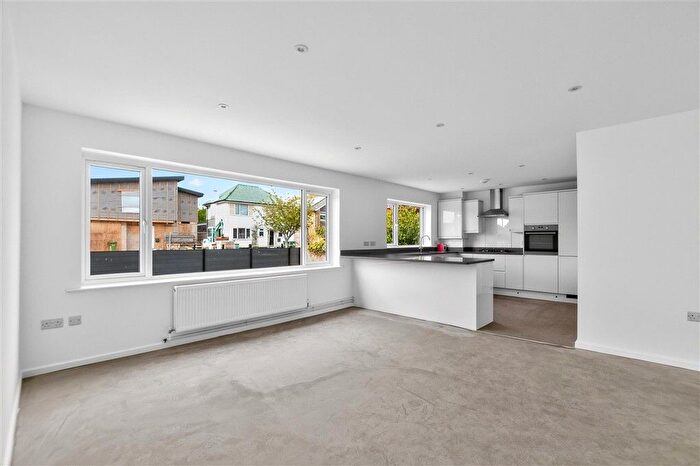
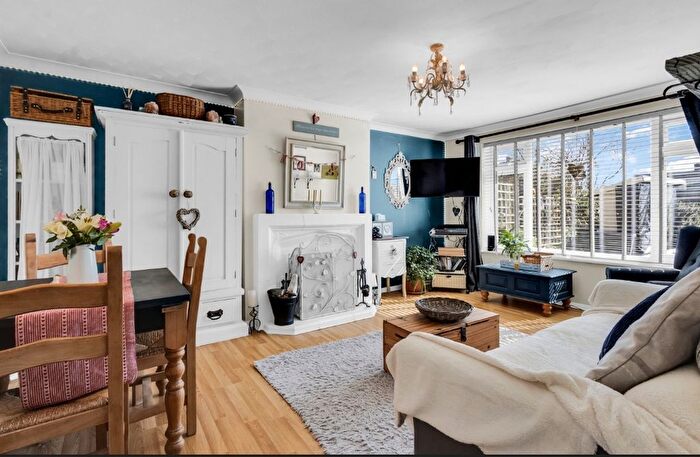
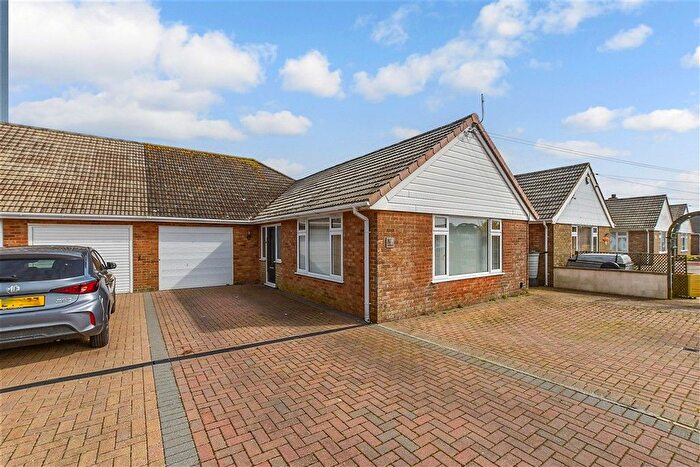
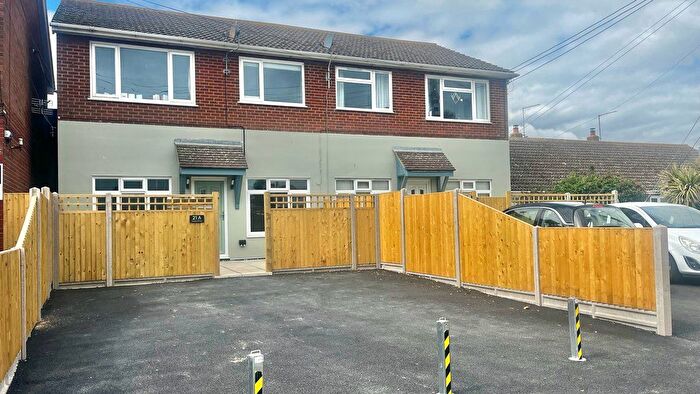
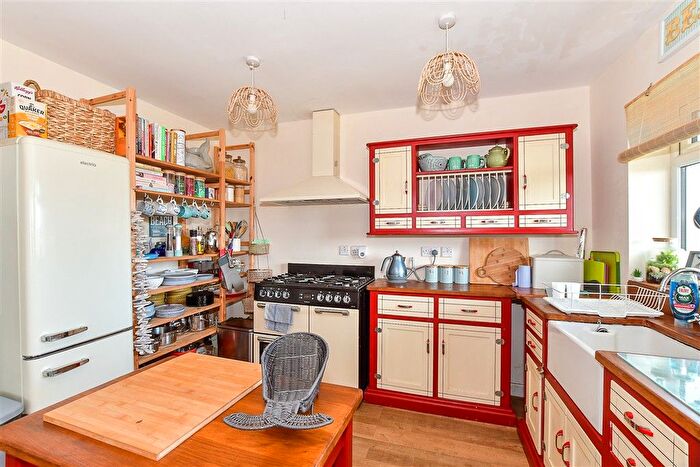
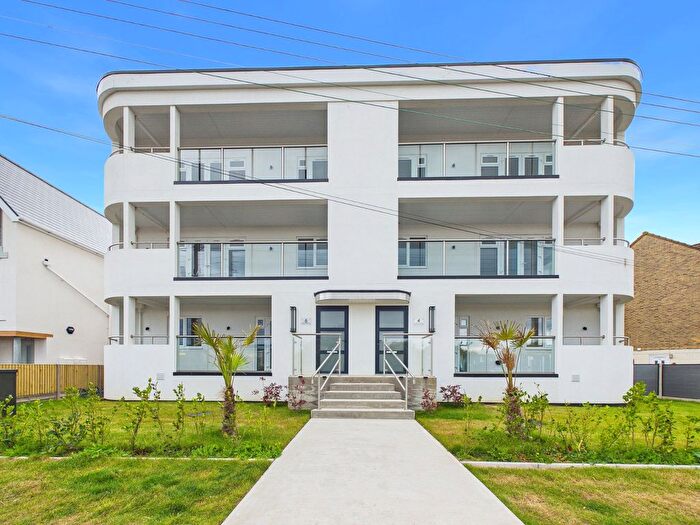
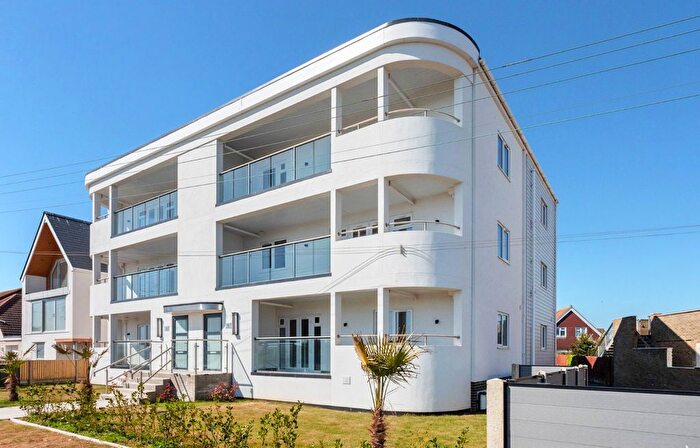
Previously listed properties in Lydd
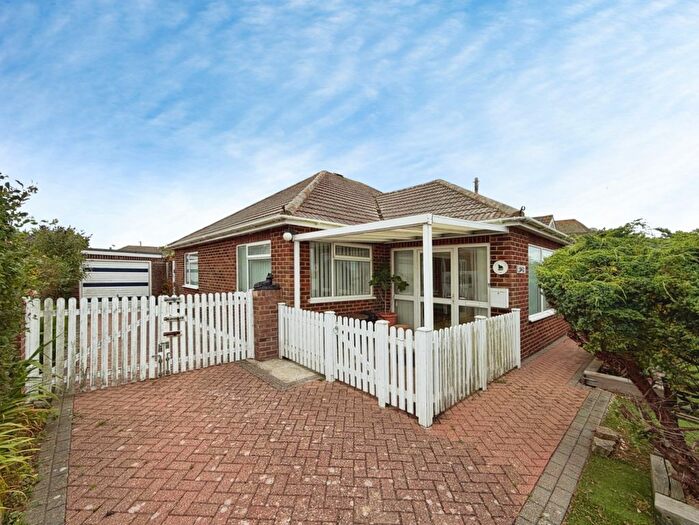
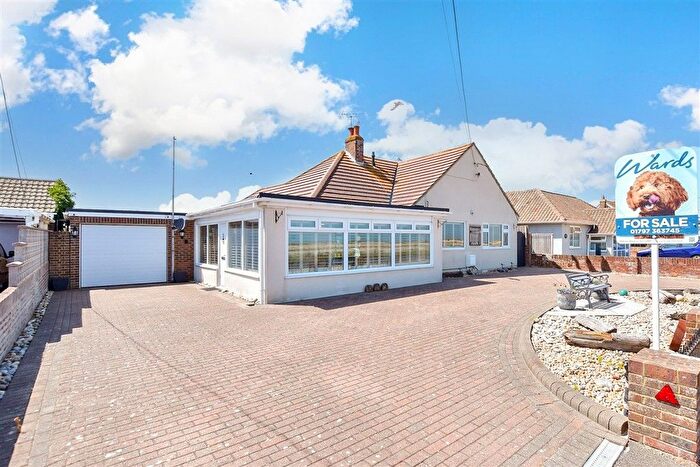
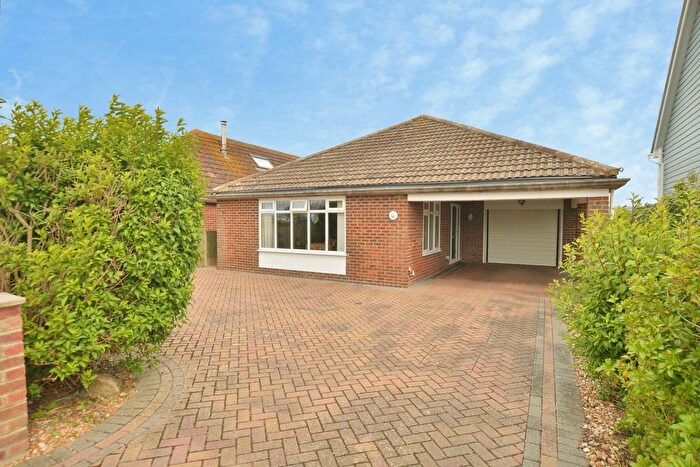
![]()
If you are looking to sell your house, let it out, or receive a property valuation, an expert can help you.
Click the button below to get started.
Roads and Postcodes in Lydd
Navigate through our locations to find the location of your next house in Lydd, New Romney for sale or to rent.
| Streets | Postcodes |
|---|---|
| Baldwin Road | TN28 8PA TN28 8SY |
| Beachmont Close | TN28 8UG |
| Beatrice Mews | TN28 8UQ |
| Channon Road | TN28 8SA |
| Derville Road | TN28 8SX |
| Leonard Road | TN28 8RU TN28 8RX TN28 8RY TN28 8RZ TN28 8UJ |
| Merritt Road | TN28 8SZ |
| Prior Road | TN28 8SB |
| Roberts Road | TN28 8RG TN28 8RL TN28 8RQ |
| Romney Sands Holiday Village | TN28 8RN |
| Seaview Road | TN28 8RH TN28 8RJ |
| The Parade | TN28 8NP TN28 8RE TN28 8RF TN28 8RP TN28 8RS TN28 8RT TN28 8SU TN28 8UL |
Property price trends in Lydd
According to the latest Land Registry data, the average home in Lydd sold for £360,000 in 2026. That figure comes from 935 sales logged over the past 31 years.
Prices have continued to climb over the last three years. Compared with 2023, when the typical sale came in around £333,818, that's a rise of roughly 7.8%.
Looking back five years, average prices are up about 4.1% since 2021, a gain of around £14,128 in cash terms.
Zoom out to the past decade for the fuller picture. Back in 2016, homes here averaged £260,468, so the typical sold price has climbed about 38.2% since then, roughly 3.3% a year. Stretch the view to fifteen years and that annual pace edges up closer to 4.3%.
Frequently asked questions about Lydd
What is the average price for a property for sale in Lydd?
The average price for a property for sale in Lydd is £334,565. This amount is 6% lower than the average price in New Romney. There are 319 property listings for sale in Lydd.
What streets have the most expensive properties for sale in Lydd?
The streets with the most expensive properties for sale in Lydd are The Parade at an average of £437,135, Baldwin Road at an average of £405,000 and Seaview Road at an average of £383,750.
What streets have the most affordable properties for sale in Lydd?
The streets with the most affordable properties for sale in Lydd are Beatrice Mews at an average of £240,000, Channon Road at an average of £251,000 and Merritt Road at an average of £257,500.
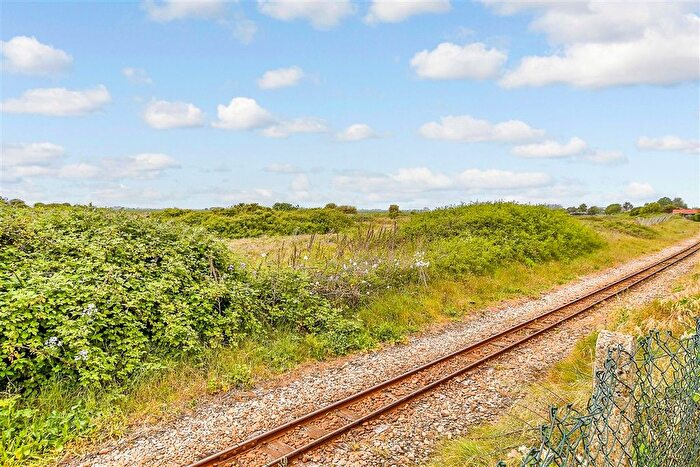
Which train stations are available in or near Lydd?
Some of the train stations available in or near Lydd are Appledore, Ham Street and Westenhanger.
Property Price Paid in Lydd by Year
The average sold property price by year was:
| Year | Average Sold Price | Price Change |
Sold Properties
|
|---|---|---|---|
| 2026 | £360,000 | 5% |
2 Properties |
| 2025 | £343,033 | 6% |
15 Properties |
| 2024 | £323,254 | -3% |
15 Properties |
| 2023 | £333,818 | -25% |
11 Properties |
| 2022 | £416,421 | 17% |
19 Properties |
| 2021 | £345,872 | -8% |
43 Properties |
| 2020 | £374,588 | 21% |
17 Properties |
| 2019 | £296,921 | -3% |
19 Properties |
| 2018 | £306,625 | 9% |
24 Properties |
| 2017 | £278,548 | 6% |
30 Properties |
Property Price per Property Type in Lydd
Here you can find historic sold price data in order to help with your property search.
The average Property Paid Price for specific property types in the last three years are:
| Property Type | Average Sold Price | Sold Properties |
|---|---|---|
| Semi Detached House | £301,333.00 | 18 Semi Detached Houses |
| Terraced House | £226,000.00 | 2 Terraced Houses |
| Detached House | £380,468.00 | 22 Detached Houses |
| Flat | £140,000.00 | 1 Flat |
