
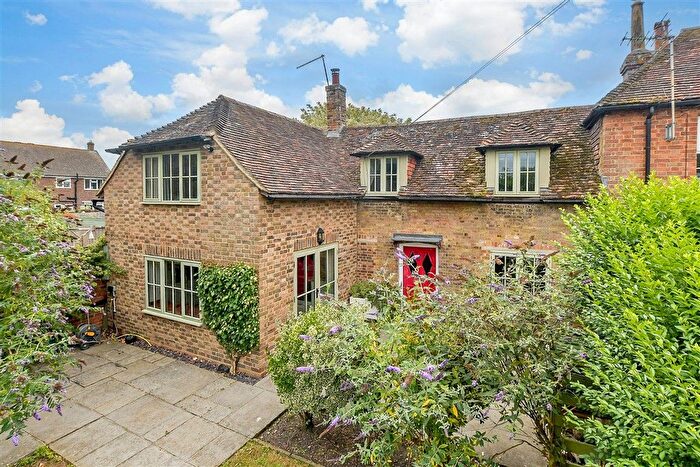
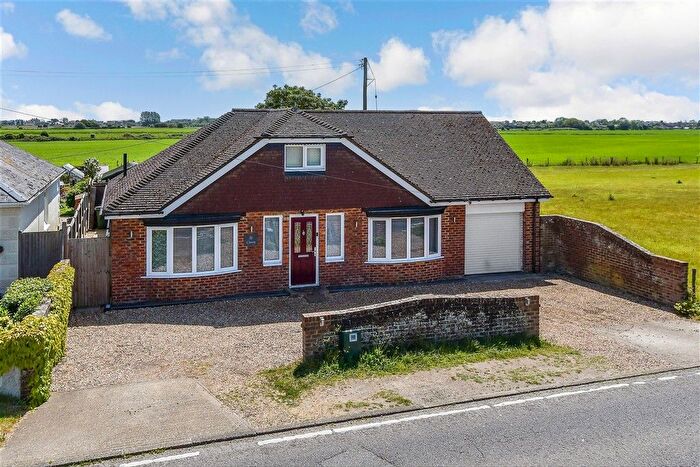
Houses for sale in Romney Marsh, New Romney
House Prices in Romney Marsh
Properties in Romney Marsh have an average house price of £589k and had 5 Property Transactions within the last 3 years¹.
Romney Marsh is an area in New Romney, Kent with 91 households², where the most expensive property was sold for £725k.
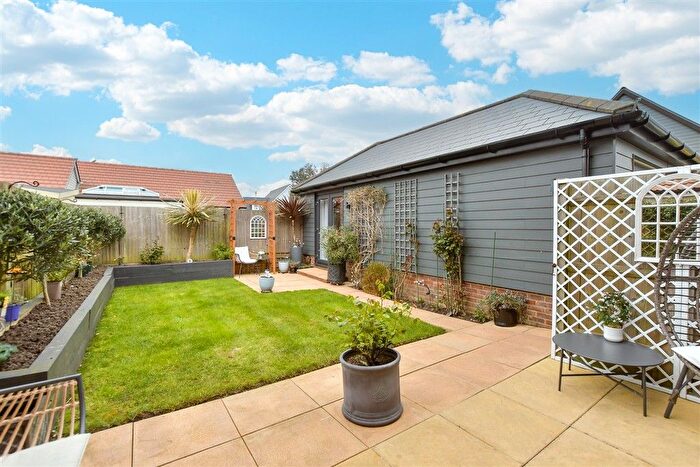
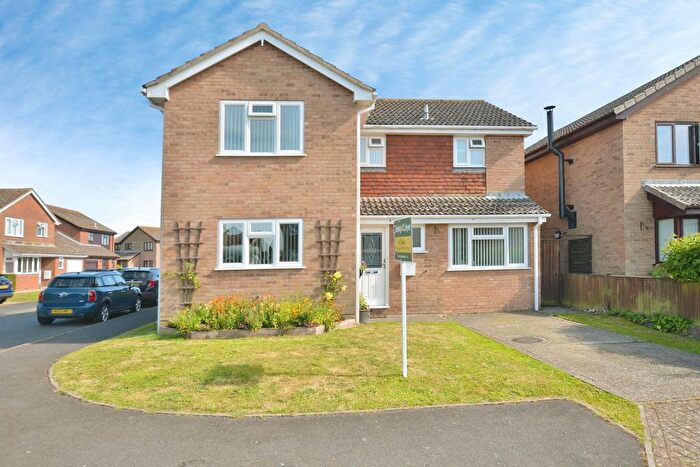
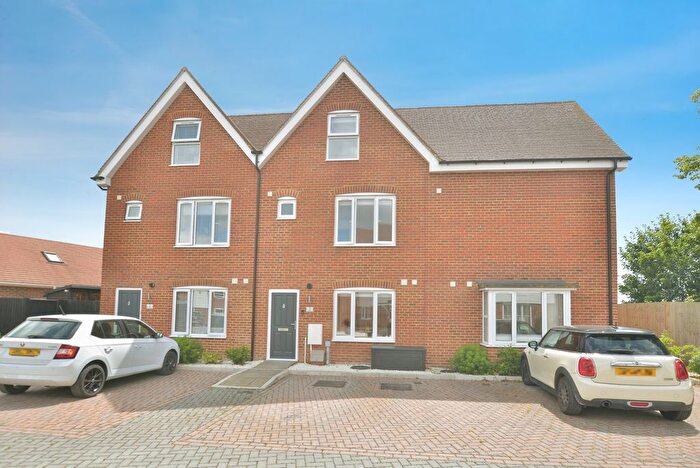
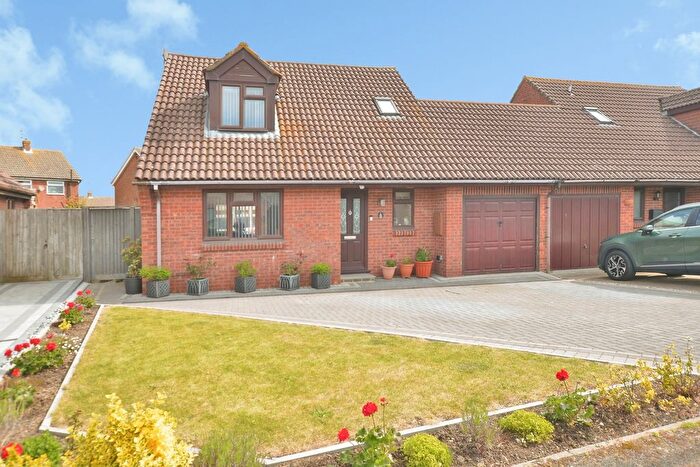
Properties for sale in Romney Marsh
Previously listed properties in Romney Marsh
![]()
If you are looking to sell your house, let it out, or receive a property valuation, an expert can help you.
Click the button below to get started.
Roads and Postcodes in Romney Marsh
Navigate through our locations to find the location of your next house in Romney Marsh, New Romney for sale or to rent.
| Streets | Postcodes |
|---|---|
| Ashford Road | TN28 8TH |
| Bramley Way | TN28 8FE |
| Cockreed Lane | TN28 8TW |
| Hope Lane | TN28 8TP |
| Pippin Close | TN28 8FH |
| Russett Way | TN28 8FJ |
| St Marys Road | TN28 8TR TN28 8TS TN28 8TT |
Property price trends in Romney Marsh
According to the latest Land Registry data, the average home in Romney Marsh sold for £623,500 in 2025. That figure comes from 79 sales logged over the past 29 years.
Prices have continued to climb over the last three years. Compared with 2022, when the typical sale came in around £508,333, that's a rise of roughly 22.7%.
Looking back five years, average prices are up about 28.6% since 2020, a gain of around £138,500 in cash terms.
Zoom out to the past decade for the fuller picture. Back in 2015, homes here averaged £489,500, so the typical sold price has climbed about 27.4% since then, roughly 2.4% a year. Stretch the view to fifteen years and that annual pace edges up closer to 2.7%.
Frequently asked questions about Romney Marsh
What is the average price for a property for sale in Romney Marsh?
The average price for a property for sale in Romney Marsh is £588,900. This amount is 66% higher than the average price in New Romney. There are 623 property listings for sale in Romney Marsh.
What streets have the most expensive properties for sale in Romney Marsh?
The streets with the most expensive properties for sale in Romney Marsh are St Marys Road at an average of £725,000 and Pippin Close at an average of £556,500.
What streets have the most affordable properties for sale in Romney Marsh?
The street with the most affordable properties for sale in Romney Marsh is Cockreed Lane at an average of £550,000.
Which train stations are available in or near Romney Marsh?
Some of the train stations available in or near Romney Marsh are Appledore, Ham Street and Westenhanger.
Property Price Paid in Romney Marsh by Year
The average sold property price by year was:
| Year | Average Sold Price | Price Change |
Sold Properties
|
|---|---|---|---|
| 2025 | £623,500 | 16% |
2 Properties |
| 2024 | £525,000 | -23% |
2 Properties |
| 2023 | £647,500 | 21% |
1 Property |
| 2022 | £508,333 | -14% |
3 Properties |
| 2021 | £577,333 | 16% |
3 Properties |
| 2020 | £485,000 | -1% |
4 Properties |
| 2019 | £489,855 | -4% |
7 Properties |
| 2018 | £509,662 | 13% |
15 Properties |
| 2017 | £441,953 | 21% |
24 Properties |
| 2016 | £350,000 | -40% |
1 Property |
Property Price per Property Type in Romney Marsh
Here you can find historic sold price data in order to help with your property search.
The average Property Paid Price for specific property types in the last three years are:
| Property Type | Average Sold Price | Sold Properties |
|---|---|---|
| Semi Detached House | £522,000.00 | 1 Semi Detached House |
| Detached House | £605,625.00 | 4 Detached Houses |
