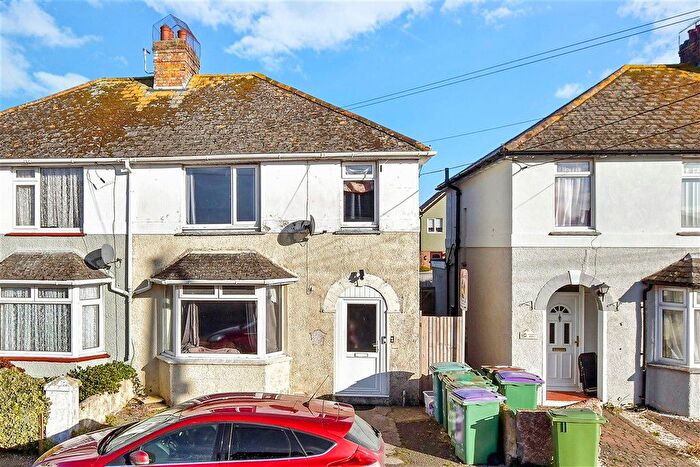
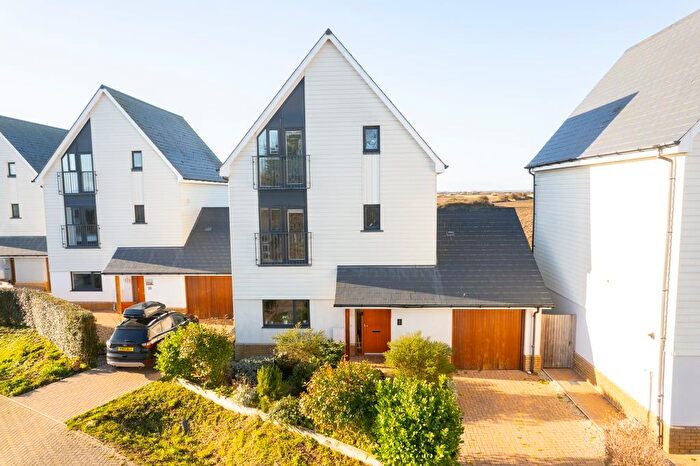
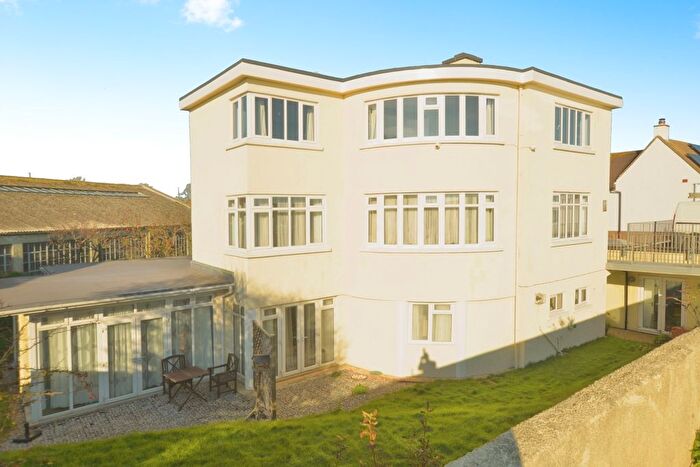
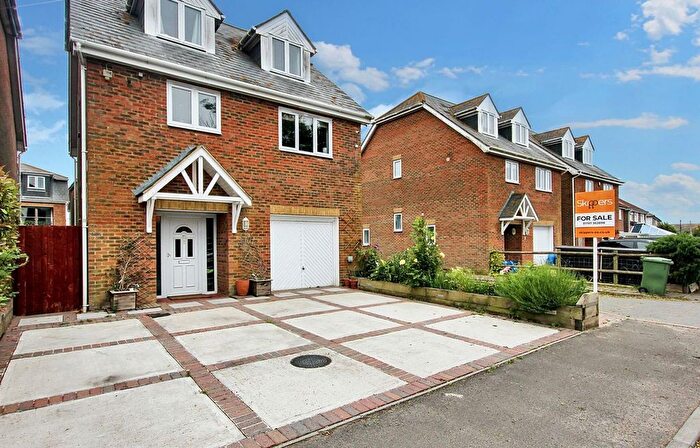
Houses for sale & to rent in Dymchurch And St Marys Bay, Romney Marsh
House Prices in Dymchurch And St Marys Bay
Properties in Dymchurch And St Marys Bay have an average house price of £328,377.00 and had 366 Property Transactions within the last 3 years¹.
Dymchurch And St Marys Bay is an area in Romney Marsh, Kent with 2,749 households², where the most expensive property was sold for £800,000.00.
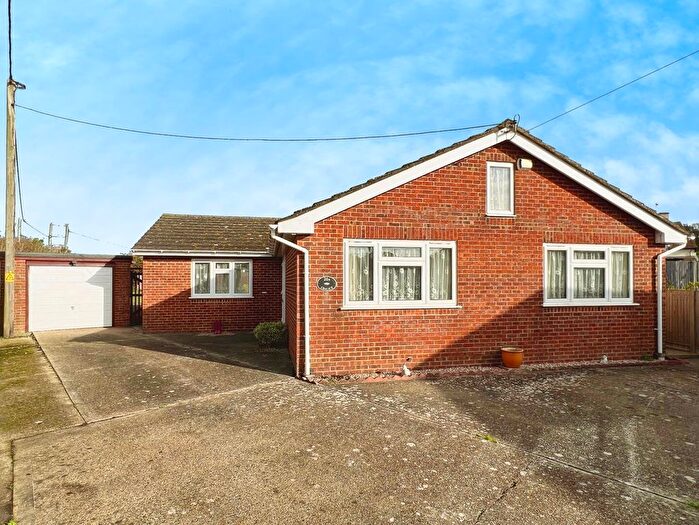
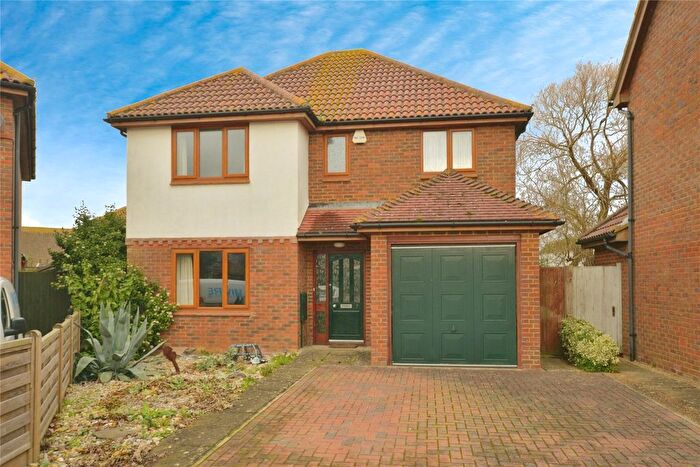
Properties for sale in Dymchurch And St Marys Bay
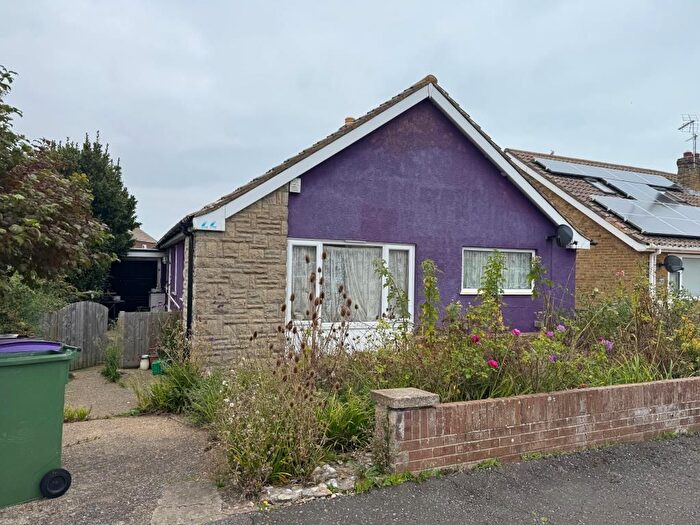
Previously listed properties in Dymchurch And St Marys Bay
Roads and Postcodes in Dymchurch And St Marys Bay
Navigate through our locations to find the location of your next house in Dymchurch And St Marys Bay, Romney Marsh for sale or to rent.
| Streets | Postcodes |
|---|---|
| Aspen Close | TN29 0XA |
| Beechwood Close | TN29 0XF |
| Beverley Gardens | TN29 0UJ |
| Briars Road | TN29 0HQ |
| Brockman Crescent | TN29 0TT TN29 0TZ TN29 0UA |
| Brookside | TN29 0QQ |
| Burmarsh Road | TN29 0JT TN29 0LX |
| Cedar Crescent | TN29 0XH TN29 0XJ TN29 0XL TN29 0XN TN29 0XP TN29 0XQ TN29 0XW |
| Chapel Road | TN29 0TD |
| Charles Cobb Close | TN29 0JQ |
| Coast Drive | TN29 0HN |
| Cobsden Close | TN29 0RQ |
| Cobsden Road | TN29 0RF TN29 0RG |
| Cornmill Mews | TN29 0PR |
| Crimond Avenue | TN29 0UL |
| Crossways Close | TN29 0ND |
| Denham Close | TN29 0TU |
| Dunkirk Close | TN29 0PT |
| Dunstall Close | TN29 0QX TN29 0QY |
| Dunstall Gardens | TN29 0QT |
| Dunstall Lane | TN29 0QN TN29 0QW |
| Dymchurch Road | TN29 0ET TN29 0HF TN29 0QR TN29 0RN TN29 0RT TN29 0RW |
| Eastbridge Road | TN29 0PD TN29 0PE TN29 0PF TN29 0PG |
| Elm Road | TN29 0SS TN29 0ST |
| Fairway Close | TN29 0HG |
| Gazedown | TN29 0ES |
| Grassmere | TN29 0HD |
| Green Meadows | TN29 0JS |
| Hawthorn Close | TN29 0SZ |
| High Knocke | TN29 0QD |
| High Street | TN29 0LD TN29 0NG TN29 0NH TN29 0NP TN29 0NW TN29 0TA |
| Highlands Crescent | TN29 0RP |
| Hind Close | TN29 0LG |
| Holly Road | TN29 0XB |
| Hythe Road | TN29 0LN TN29 0TJ TN29 0TL TN29 0TS TN29 0TW |
| Jefferstone Gardens | TN29 0SP |
| Jefferstone Lane | TN29 0SA TN29 0SG TN29 0SQ TN29 0SW |
| Jenners Way | TN29 0EZ |
| Jesson Close | TN29 0SH |
| Kingsland Hollow | TN29 0RE |
| Kingsway | TN29 0LY TN29 0LZ |
| Laurel Avenue | TN29 0SJ TN29 0SL TN29 0SN TN29 0SR |
| Link Way | TN29 0TQ |
| Links Crescent | TN29 0RS |
| Livingstone Close | TN29 0TX |
| Lower Sands | TN29 0NE TN29 0NF |
| Lyndhurst Road | TN29 0TE TN29 0TF |
| Maple Drive | TN29 0XD TN29 0XE |
| Marine Avenue | TN29 0TR |
| Marshlands | TN29 0PY TN29 0PZ |
| Meadsway | TN29 0HE |
| Mill Road | TN29 0NY TN29 0NZ |
| Mitcham Road | TN29 0TH |
| Mulberry Close | TN29 0UN |
| Nesbit Road | TN29 0SF |
| New Bridge Way | TN29 0HA |
| New Hall Close | TN29 0LE |
| Newlands | TN29 0EX TN29 0EY |
| Oak Drive | TN29 0XG |
| Old Bakery Close | TN29 0XS |
| Orchard Road | TN29 0RA TN29 0RB |
| Orgarswick Avenue | TN29 0NX TN29 0PA |
| Orgarswick Way | TN29 0PB |
| Pear Tree Lane | TN29 0LU |
| Queens Way | TN29 0NB |
| Raymoor Avenue | TN29 0RD |
| Redoubt Way | TN29 0UF TN29 0UG TN29 0UQ |
| Salbris Close | TN29 0HW |
| Sark Close | TN29 0LQ |
| Seabourne Way | TN29 0PX |
| Seaview Heights | TN29 0AD |
| Seawall | TN29 0LS TN29 0TG |
| Seaway Crescent | TN29 0RZ |
| Seaway Gardens | TN29 0RH TN29 0RY |
| Seaway Road | TN29 0RU TN29 0RX |
| Ship Close | TN29 0LH |
| Spring Hollow | TN29 0RL |
| St Anns Road | TN29 0PH |
| St Marys Gardens | TN29 0QL |
| St Marys Road | TN29 0PL TN29 0PN |
| Stanley Close | TN29 0TY |
| Station Road | TN29 0PJ |
| Sycamore Close | TN29 0LB |
| Sycamore Gardens | TN29 0LA |
| Tartane Lane | TN29 0LJ |
| Taylors Close | TN29 0HT |
| Taylors Lane | TN29 0EU TN29 0HB |
| Teelin Close | TN29 0SE |
| The Fairway | TN29 0QE TN29 0QF TN29 0QG TN29 0QJ TN29 0QP |
| The Oval | TN29 0LR |
| Tower Estate | TN29 0TN |
| Tritton Gardens | TN29 0NA |
| Tudor Avenue | TN29 0LT |
| Uden Road | TN29 0UH |
| Venture Close | TN29 0LP |
| Willop Way | TN29 0TP |
| Willow Drive | TN29 0SX TN29 0SY |
| Willowbank Close | TN29 0RR |
| Winton Way | TN29 0QH |
| Woodland Way | TN29 0UB TN29 0UD TN29 0UE |
| Wraightsfield Avenue | TN29 0JY TN29 0JZ |
| Yew Tree Road | TN29 0SU |
Transport near Dymchurch And St Marys Bay
-
Westenhanger Station
-
Sandling Station
-
Ham Street Station
-
Appledore Station
-
Folkestone West Station
-
Folkestone Central Station
-
Ashford International Station
- FAQ
- Price Paid By Year
- Property Type Price
Frequently asked questions about Dymchurch And St Marys Bay
What is the average price for a property for sale in Dymchurch And St Marys Bay?
The average price for a property for sale in Dymchurch And St Marys Bay is £328,377. This amount is 2% lower than the average price in Romney Marsh. There are 792 property listings for sale in Dymchurch And St Marys Bay.
What streets have the most expensive properties for sale in Dymchurch And St Marys Bay?
The streets with the most expensive properties for sale in Dymchurch And St Marys Bay are Seawall at an average of £485,000, The Oval at an average of £464,500 and Hythe Road at an average of £453,500.
What streets have the most affordable properties for sale in Dymchurch And St Marys Bay?
The streets with the most affordable properties for sale in Dymchurch And St Marys Bay are Mill Road at an average of £190,000, Links Crescent at an average of £210,361 and Briars Road at an average of £214,500.
Which train stations are available in or near Dymchurch And St Marys Bay?
Some of the train stations available in or near Dymchurch And St Marys Bay are Westenhanger, Sandling and Ham Street.
Property Price Paid in Dymchurch And St Marys Bay by Year
The average sold property price by year was:
| Year | Average Sold Price | Price Change |
Sold Properties
|
|---|---|---|---|
| 2025 | £320,736 | 3% |
74 Properties |
| 2024 | £311,860 | -5% |
104 Properties |
| 2023 | £327,891 | -7% |
82 Properties |
| 2022 | £350,291 | 8% |
106 Properties |
| 2021 | £322,226 | 3% |
139 Properties |
| 2020 | £311,862 | 15% |
89 Properties |
| 2019 | £264,626 | -11% |
89 Properties |
| 2018 | £294,132 | 10% |
98 Properties |
| 2017 | £264,860 | 4% |
135 Properties |
| 2016 | £255,142 | 9% |
106 Properties |
| 2015 | £233,357 | 16% |
138 Properties |
| 2014 | £195,071 | 4% |
133 Properties |
| 2013 | £186,737 | -1% |
124 Properties |
| 2012 | £188,504 | 1% |
96 Properties |
| 2011 | £187,342 | -0,1% |
87 Properties |
| 2010 | £187,489 | 4% |
93 Properties |
| 2009 | £179,861 | -6% |
117 Properties |
| 2008 | £189,821 | -5% |
92 Properties |
| 2007 | £199,659 | 10% |
154 Properties |
| 2006 | £179,952 | 2% |
152 Properties |
| 2005 | £176,742 | 3% |
127 Properties |
| 2004 | £172,298 | 10% |
155 Properties |
| 2003 | £155,356 | 15% |
131 Properties |
| 2002 | £132,375 | 21% |
156 Properties |
| 2001 | £105,121 | 10% |
150 Properties |
| 2000 | £94,976 | 14% |
161 Properties |
| 1999 | £81,414 | 14% |
136 Properties |
| 1998 | £70,129 | 9% |
139 Properties |
| 1997 | £63,724 | 7% |
151 Properties |
| 1996 | £59,537 | 2% |
130 Properties |
| 1995 | £58,451 | - |
124 Properties |
Property Price per Property Type in Dymchurch And St Marys Bay
Here you can find historic sold price data in order to help with your property search.
The average Property Paid Price for specific property types in the last three years are:
| Property Type | Average Sold Price | Sold Properties |
|---|---|---|
| Semi Detached House | £297,167.00 | 163 Semi Detached Houses |
| Detached House | £365,361.00 | 172 Detached Houses |
| Terraced House | £314,130.00 | 23 Terraced Houses |
| Flat | £210,062.00 | 8 Flats |

