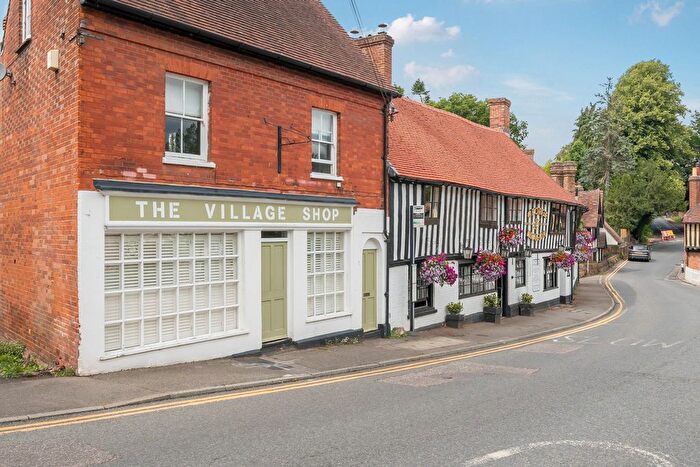
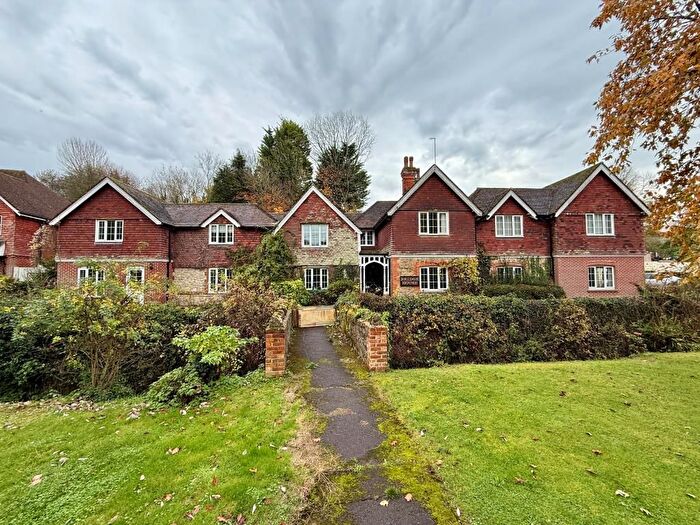
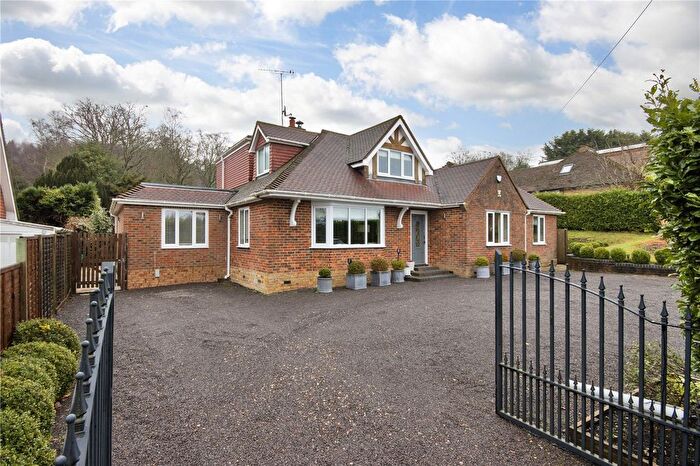
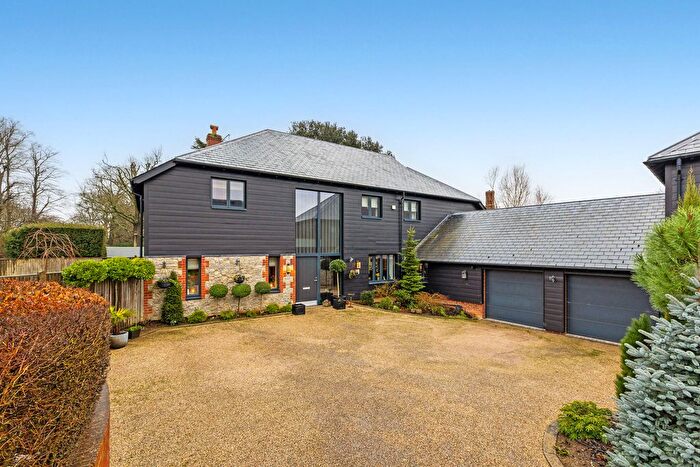
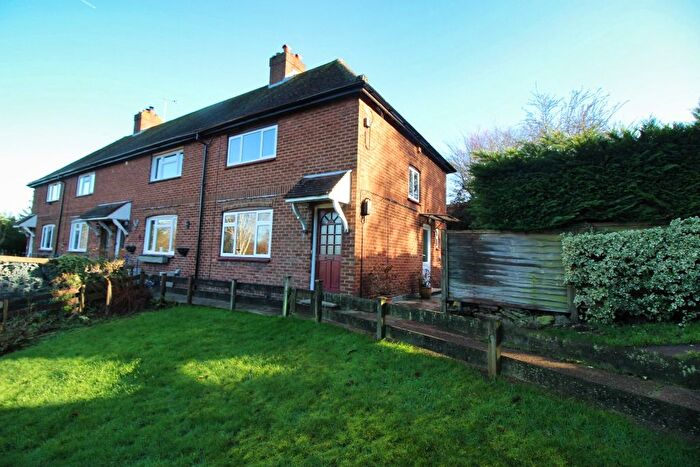
Houses for sale & to rent in Ightham, Sevenoaks
House Prices in Ightham
Properties in Ightham have an average house price of £963,268.00 and had 54 Property Transactions within the last 3 years¹.
Ightham is an area in Sevenoaks, Kent with 744 households², where the most expensive property was sold for £2,710,000.00.
Properties for sale in Ightham
Previously listed properties in Ightham
Roads and Postcodes in Ightham
Navigate through our locations to find the location of your next house in Ightham, Sevenoaks for sale or to rent.
| Streets | Postcodes |
|---|---|
| Back Lane | TN15 9AU |
| Bates Hill | TN15 9BG TN15 9HB |
| Borough Green Road | TN15 9HS TN15 9HU TN15 9JA |
| Brookside Cottages | TN15 0NY |
| Busty Lane | TN15 9HP |
| Butchers Green | TN15 9AG |
| Chapel View | TN15 9AQ |
| Coach Road | TN15 0PE TN15 0PF |
| Cobs Close | TN15 9DB |
| Common Road | TN15 9AX TN15 9AY TN15 9DX TN15 9DY TN15 9EB TN15 9ED |
| Copt Hall Road | TN15 9DT TN15 9DU |
| Crantock Cottages | TN15 9EH |
| Durlings Orchard | TN15 9HW |
| Fen Meadow | TN15 9HT |
| Fen Pond Road | TN15 9JD TN15 9JE TN15 9JF |
| High Cross Road | TN15 0NN TN15 0NR |
| Ismays Road | TN15 0NX TN15 0NZ TN15 9BB TN15 9BD TN15 9BE |
| Jubilee Crescent | TN15 9AE |
| Mill Lane | TN15 9BH |
| Mote Road | TN15 0PG |
| Nutfields | TN15 9EA |
| Old Cottages | TN15 9DL |
| Old Lane | TN15 9AH TN15 9DZ |
| Old School Cottages | TN15 9HX |
| Oldbury Close | TN15 9DJ |
| Oldbury Cottages | TN15 9DE |
| Oldbury Lane | TN15 9DA TN15 9DD TN15 9DF TN15 9DG |
| Oldbury Villas | TN15 9DH |
| Pine Tree Lane | TN15 0NJ |
| Rectory Lane | TN15 9AJ |
| Redwell | TN15 9EE |
| Rose Cottages | TN15 0PA |
| Sandy Lane | TN15 0PB TN15 0PD TN15 9BA |
| Sevenoaks Road | TN15 0HB TN15 9AA TN15 9AB TN15 9AD TN15 9DS TN15 9HA |
| Spring Lane | TN15 9DN TN15 9DR |
| Stone Street Road | TN15 0NH TN15 0PQ |
| Tebbs Way | TN15 9BJ |
| The Street | TN15 9HE TN15 9HG TN15 9HH TN15 9HJ |
| The Willows | TN15 9HY |
| Tonbridge Road | TN15 9AN TN15 9AP TN15 9AR |
| Trycewell Lane | TN15 9HL TN15 9HN |
| Upper Spring Lane | TN15 9DP |
| Walker Place | TN15 9AW |
| TN15 0ET |
Transport near Ightham
-
Borough Green and Wrotham Station
-
Kemsing Station
-
Bat and Ball Station
-
Otford Station
-
Sevenoaks Station
-
Dunton Green Station
- FAQ
- Price Paid By Year
- Property Type Price
Frequently asked questions about Ightham
What is the average price for a property for sale in Ightham?
The average price for a property for sale in Ightham is £963,268. This amount is 32% higher than the average price in Sevenoaks. There are 317 property listings for sale in Ightham.
What streets have the most expensive properties for sale in Ightham?
The streets with the most expensive properties for sale in Ightham are Pine Tree Lane at an average of £2,200,000, Bates Hill at an average of £1,585,000 and Mote Road at an average of £1,350,000.
What streets have the most affordable properties for sale in Ightham?
The streets with the most affordable properties for sale in Ightham are Oldbury Lane at an average of £275,000, Chapel View at an average of £375,000 and The Willows at an average of £415,000.
Which train stations are available in or near Ightham?
Some of the train stations available in or near Ightham are Borough Green and Wrotham, Kemsing and Bat and Ball.
Property Price Paid in Ightham by Year
The average sold property price by year was:
| Year | Average Sold Price | Price Change |
Sold Properties
|
|---|---|---|---|
| 2025 | £834,107 | -18% |
14 Properties |
| 2024 | £987,916 | -5% |
24 Properties |
| 2023 | £1,039,312 | 2% |
16 Properties |
| 2022 | £1,015,611 | -3% |
30 Properties |
| 2021 | £1,044,235 | 37% |
45 Properties |
| 2020 | £661,368 | -12% |
19 Properties |
| 2019 | £742,045 | -11% |
22 Properties |
| 2018 | £827,057 | 7% |
28 Properties |
| 2017 | £772,630 | 6% |
23 Properties |
| 2016 | £728,334 | 12% |
29 Properties |
| 2015 | £639,426 | -38% |
28 Properties |
| 2014 | £880,765 | 3% |
32 Properties |
| 2013 | £856,160 | 11% |
28 Properties |
| 2012 | £764,421 | 32% |
27 Properties |
| 2011 | £518,608 | -39% |
23 Properties |
| 2010 | £720,278 | -15% |
33 Properties |
| 2009 | £830,500 | 31% |
17 Properties |
| 2008 | £569,250 | -11% |
12 Properties |
| 2007 | £632,397 | -17% |
51 Properties |
| 2006 | £738,137 | 37% |
41 Properties |
| 2005 | £463,866 | -5% |
34 Properties |
| 2004 | £488,038 | 9% |
39 Properties |
| 2003 | £443,800 | 1% |
32 Properties |
| 2002 | £441,244 | 22% |
43 Properties |
| 2001 | £345,996 | -8% |
50 Properties |
| 2000 | £372,315 | 18% |
30 Properties |
| 1999 | £304,679 | 14% |
36 Properties |
| 1998 | £262,274 | 1% |
81 Properties |
| 1997 | £258,879 | 21% |
76 Properties |
| 1996 | £203,726 | 10% |
32 Properties |
| 1995 | £183,605 | - |
30 Properties |
Property Price per Property Type in Ightham
Here you can find historic sold price data in order to help with your property search.
The average Property Paid Price for specific property types in the last three years are:
| Property Type | Average Sold Price | Sold Properties |
|---|---|---|
| Semi Detached House | £608,250.00 | 10 Semi Detached Houses |
| Detached House | £1,212,985.00 | 34 Detached Houses |
| Terraced House | £469,250.00 | 10 Terraced Houses |

