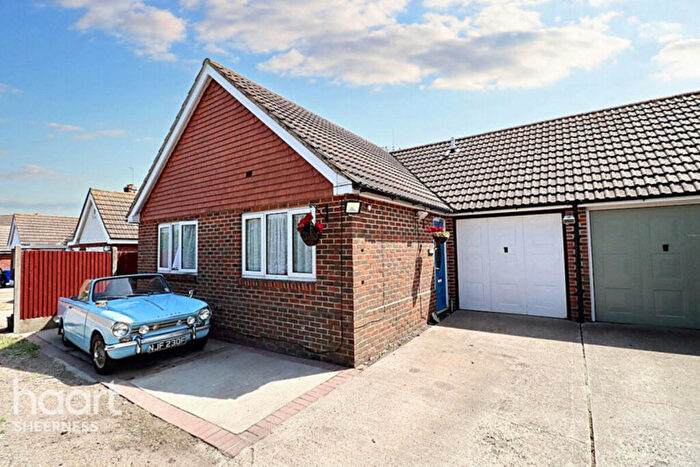
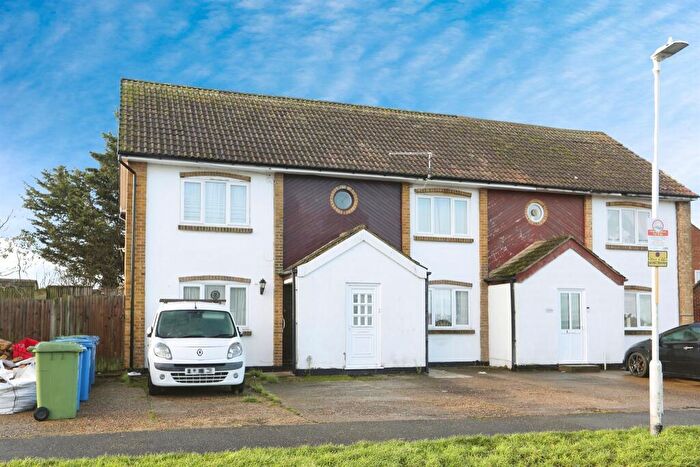
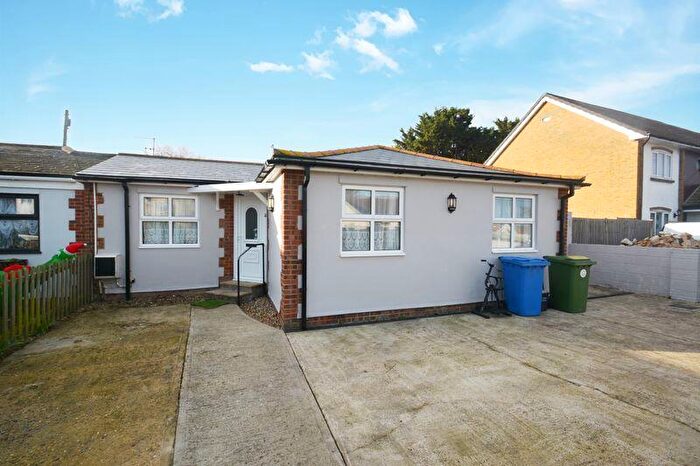
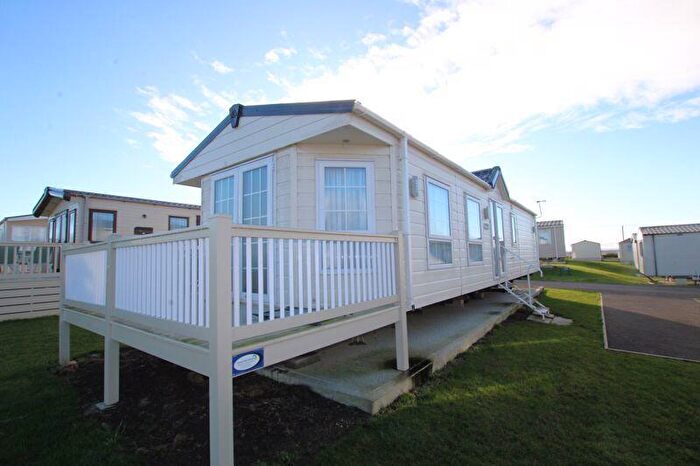
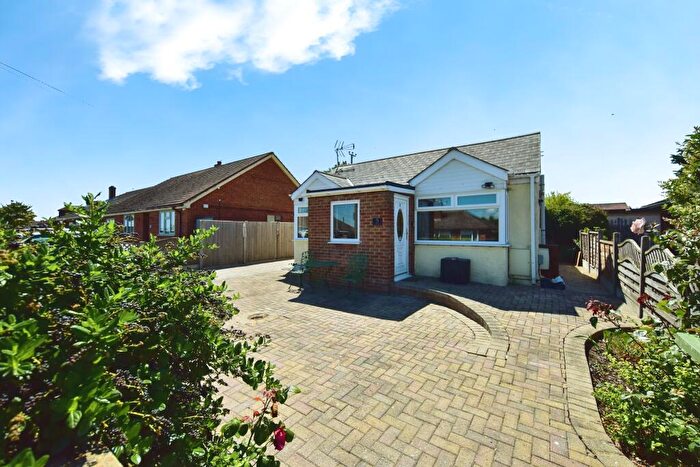
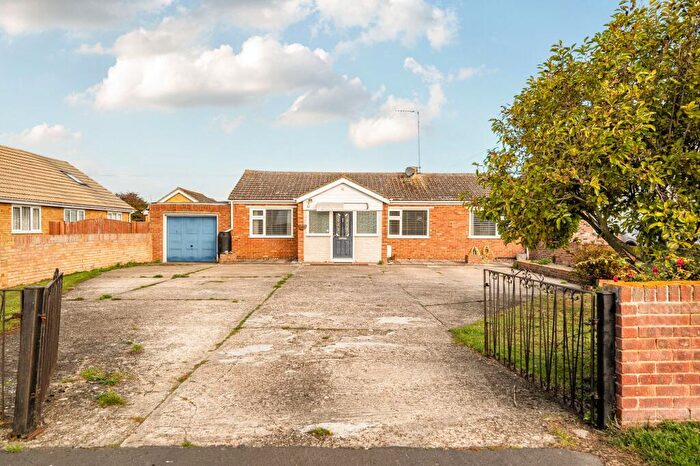
Houses for sale & to rent in Leysdown And Warden, Sheerness
House Prices in Leysdown And Warden
Properties in Leysdown And Warden have an average house price of £249,294.00 and had 129 Property Transactions within the last 3 years¹.
Leysdown And Warden is an area in Sheerness, Kent with 1,284 households², where the most expensive property was sold for £470,000.00.
Properties for sale in Leysdown And Warden
Roads and Postcodes in Leysdown And Warden
Navigate through our locations to find the location of your next house in Leysdown And Warden, Sheerness for sale or to rent.
| Streets | Postcodes |
|---|---|
| Bay View Gardens | ME12 4AE |
| Beach Approach | ME12 4NJ ME12 4NL |
| Bucklers Close | ME12 4PT |
| Clarence Gardens | ME12 4NR |
| Cliff Drive | ME12 4PJ ME12 4PP |
| Cliff View Gardens | ME12 4AF ME12 4NH ME12 4NQ |
| Condor Close | ME12 4LY |
| Coronation Drive | ME12 4AW |
| Danes Drive | ME12 4AJ |
| Eastern Road | ME12 4QA |
| Emerald View | ME12 4PG ME12 4PN ME12 4PQ |
| Empress Gardens | ME12 4NY |
| Grove Avenue | ME12 4QE |
| Groveway | ME12 4LR |
| Harty Ferry Road | ME12 4BG ME12 4BQ |
| Imperial Drive | ME12 4SA ME12 4SB ME12 4SD ME12 4SE |
| James Court | ME12 4RS |
| Jetty Road | ME12 4PR ME12 4PS |
| Kingsdale Court | ME12 4JZ |
| Knoll Way | ME12 4PA |
| Leicester Gardens | ME12 4NP |
| Leysdown Road | ME12 4AB ME12 4AD ME12 4AR ME12 4LH ME12 4RD ME12 4RE |
| Melody Close | ME12 4PU |
| Mustards Road | ME12 4AG ME12 4AN |
| Nutts Avenue | ME12 4QH |
| Park Avenue | ME12 4QJ ME12 4QN |
| Park Avenue Holiday Village | ME12 4QP |
| Preston Hall Gardens | ME12 4PL |
| Sand Court | ME12 4RF |
| Sea Approach | ME12 4PD |
| Sea View Gardens | ME12 4NG |
| Seasalter Close | ME12 4PE ME12 4PF |
| Seaview Avenue | ME12 4RA |
| Shellbeach | ME12 4BS ME12 4RL |
| Shellness Road | ME12 4RH |
| Sheppey Beach Villas | ME12 4QQ ME12 4QS ME12 4QY ME12 4QZ ME12 4RN |
| Shurland Avenue | ME12 4QU |
| South View Gardens | ME12 4LW |
| St Clements Close | ME12 4AL |
| St Clements Road | ME12 4NE |
| St James Close | ME12 4NW |
| Tamarisk | ME12 4RP |
| The Promenade | ME12 4QB |
| Thorn Hill Road | ME12 4HF ME12 4NT ME12 4NU ME12 4NX ME12 4NZ ME12 4PB ME12 4PH |
| Warden View Gardens | ME12 4AH |
| Waterside View | ME12 4PW |
| Windsor Gardens | ME12 4NS |
| Wing Road | ME12 4QR ME12 4QX ME12 4RR |
Transport near Leysdown And Warden
-
Whitstable Station
-
Faversham Station
-
Teynham Station
-
Queenborough Station
-
Swale Station
-
Sheerness-On-Sea Station
-
Chestfield and Swalecliffe Station
-
Kemsley Station
-
Selling Station
-
Sittingbourne Station
- FAQ
- Price Paid By Year
- Property Type Price
Frequently asked questions about Leysdown And Warden
What is the average price for a property for sale in Leysdown And Warden?
The average price for a property for sale in Leysdown And Warden is £249,294. This amount is 11% lower than the average price in Sheerness. There are 866 property listings for sale in Leysdown And Warden.
What streets have the most expensive properties for sale in Leysdown And Warden?
The streets with the most expensive properties for sale in Leysdown And Warden are Sea Approach at an average of £339,687, Beach Approach at an average of £324,000 and Jetty Road at an average of £314,625.
What streets have the most affordable properties for sale in Leysdown And Warden?
The streets with the most affordable properties for sale in Leysdown And Warden are Sheppey Beach Villas at an average of £78,166, Melody Close at an average of £198,166 and Waterside View at an average of £205,500.
Which train stations are available in or near Leysdown And Warden?
Some of the train stations available in or near Leysdown And Warden are Whitstable, Faversham and Teynham.
Property Price Paid in Leysdown And Warden by Year
The average sold property price by year was:
| Year | Average Sold Price | Price Change |
Sold Properties
|
|---|---|---|---|
| 2025 | £260,319 | 14% |
54 Properties |
| 2024 | £223,234 | -14% |
32 Properties |
| 2023 | £254,841 | -1% |
43 Properties |
| 2022 | £256,186 | 6% |
59 Properties |
| 2021 | £239,761 | 10% |
63 Properties |
| 2020 | £214,916 | 14% |
54 Properties |
| 2019 | £185,459 | -20% |
40 Properties |
| 2018 | £221,901 | 17% |
68 Properties |
| 2017 | £184,170 | 6% |
66 Properties |
| 2016 | £172,968 | -1% |
61 Properties |
| 2015 | £174,704 | 13% |
61 Properties |
| 2014 | £151,155 | 8% |
59 Properties |
| 2013 | £139,364 | 7% |
57 Properties |
| 2012 | £129,281 | -7% |
48 Properties |
| 2011 | £137,754 | 8% |
46 Properties |
| 2010 | £127,037 | 2% |
40 Properties |
| 2009 | £124,484 | -31% |
42 Properties |
| 2008 | £163,412 | 9% |
38 Properties |
| 2007 | £149,278 | -2% |
90 Properties |
| 2006 | £152,824 | 10% |
96 Properties |
| 2005 | £137,579 | 14% |
76 Properties |
| 2004 | £118,499 | 7% |
91 Properties |
| 2003 | £109,804 | 19% |
106 Properties |
| 2002 | £88,801 | 23% |
95 Properties |
| 2001 | £68,796 | 4% |
100 Properties |
| 2000 | £66,254 | 12% |
111 Properties |
| 1999 | £58,392 | 14% |
94 Properties |
| 1998 | £50,231 | 18% |
72 Properties |
| 1997 | £41,181 | 6% |
64 Properties |
| 1996 | £38,603 | -0,1% |
47 Properties |
| 1995 | £38,634 | - |
41 Properties |
Property Price per Property Type in Leysdown And Warden
Here you can find historic sold price data in order to help with your property search.
The average Property Paid Price for specific property types in the last three years are:
| Property Type | Average Sold Price | Sold Properties |
|---|---|---|
| Semi Detached House | £241,460.00 | 43 Semi Detached Houses |
| Detached House | £305,770.00 | 45 Detached Houses |
| Terraced House | £219,044.00 | 34 Terraced Houses |
| Flat | £81,285.00 | 7 Flats |

