Houses for sale & to rent in Harbour, Whitstable
House Prices in Harbour
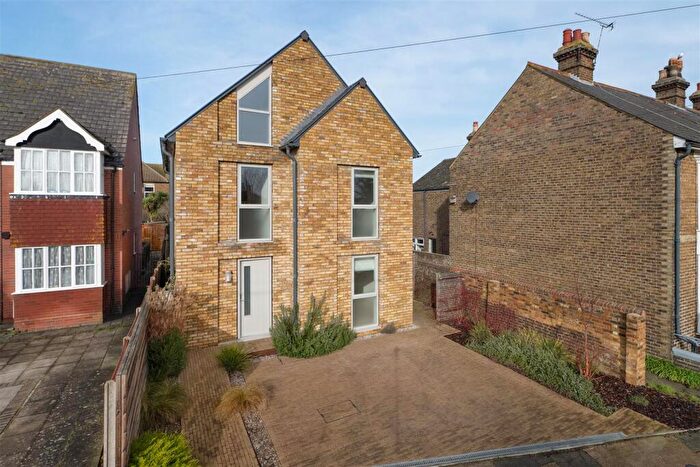
Properties in Harbour have an average house price of £426,709.00 and had 256 Property Transactions within the last 3 years¹.
Harbour is an area in Whitstable, Kent with 2,588 households², where the most expensive property was sold for £1,500,000.00.
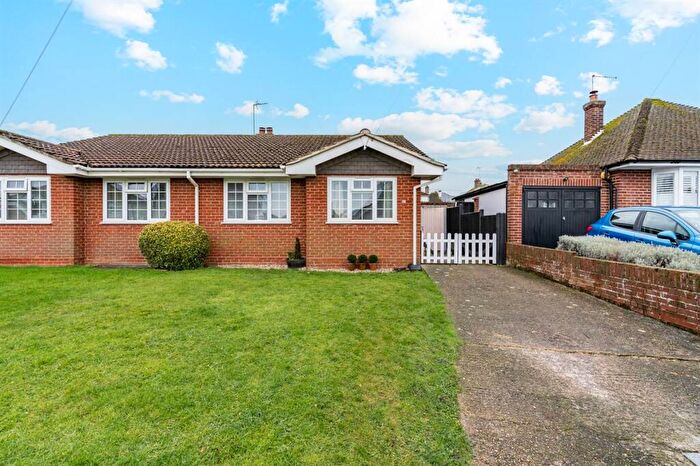
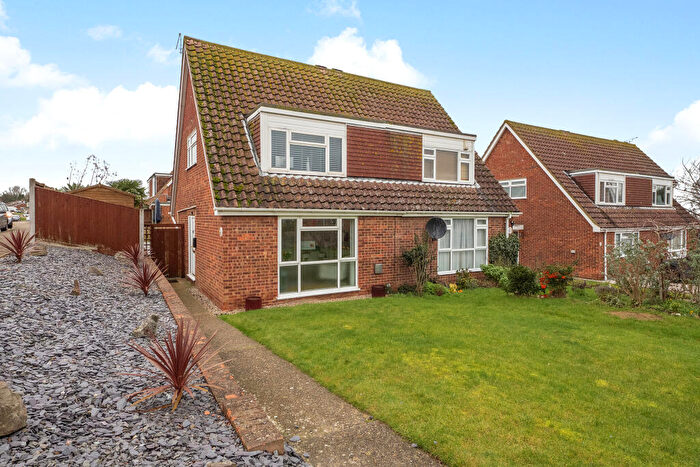
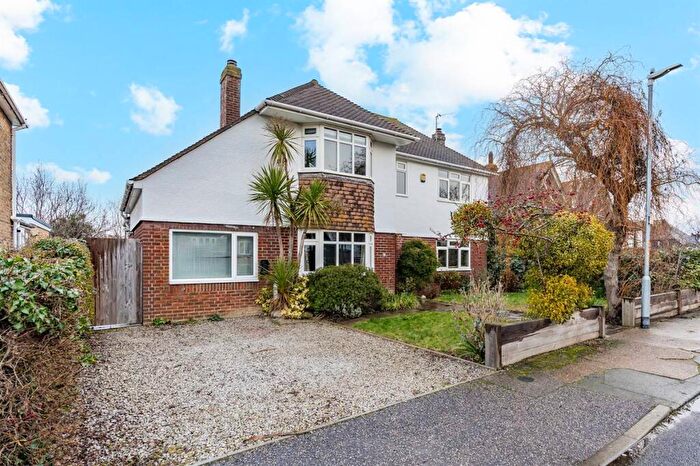
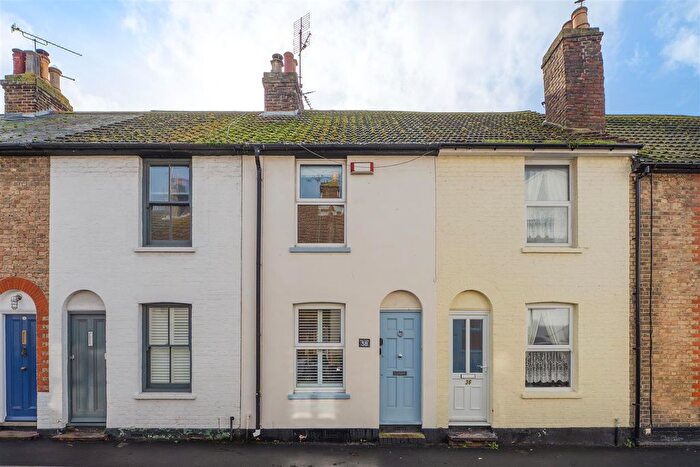
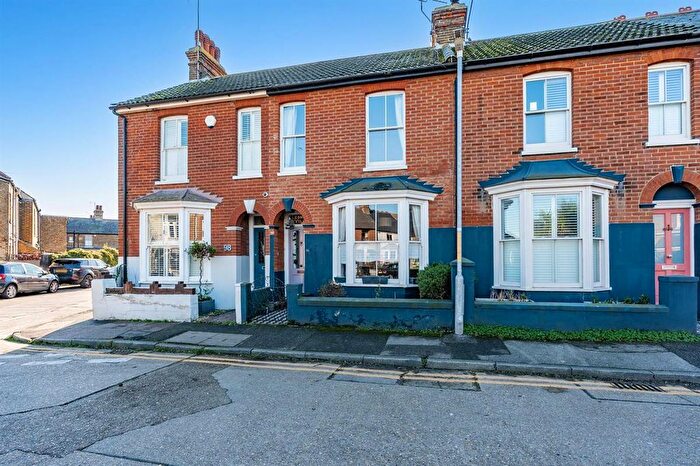
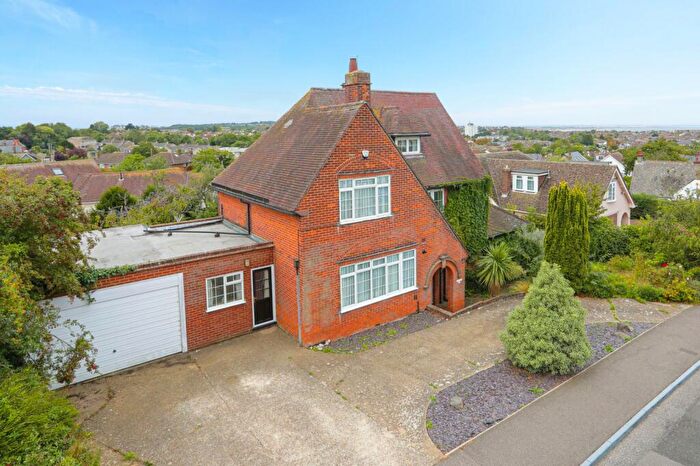
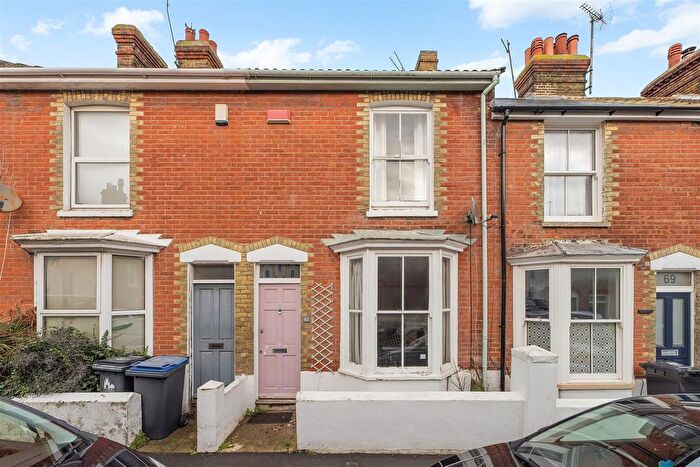
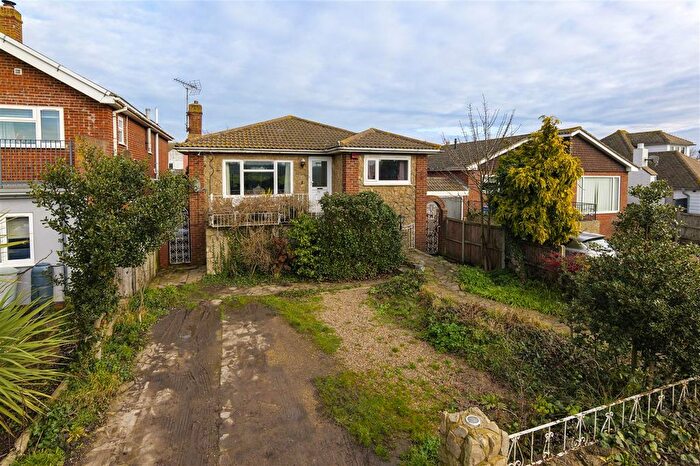
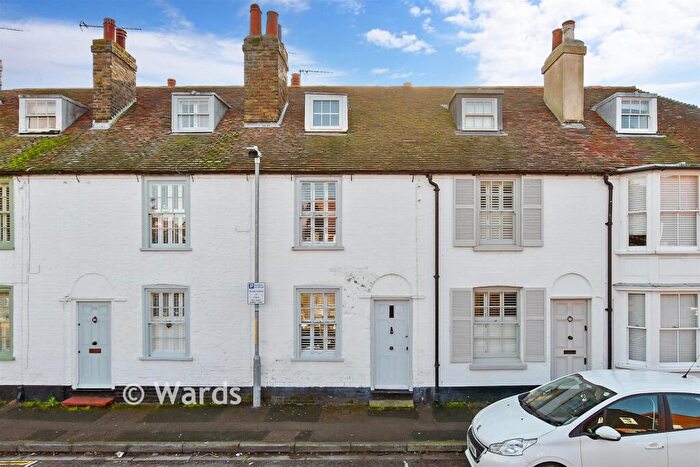
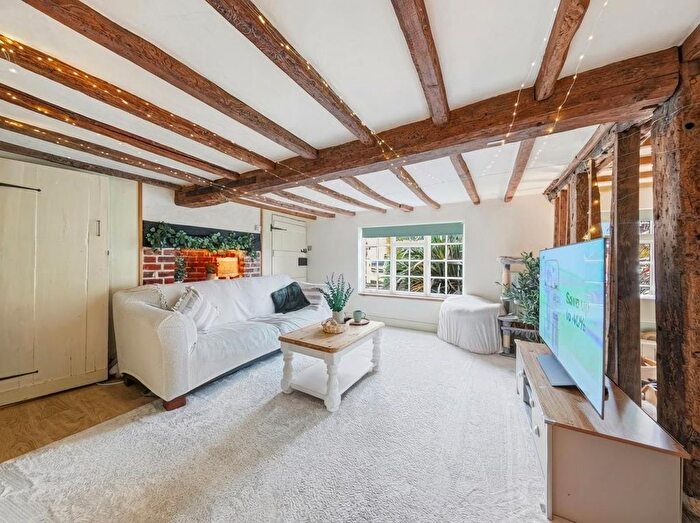
Properties for sale in Harbour
Roads and Postcodes in Harbour
Navigate through our locations to find the location of your next house in Harbour, Whitstable for sale or to rent.
| Streets | Postcodes |
|---|---|
| Acton Road | CT5 1JH CT5 1JJ |
| Albert Court | CT5 1SL |
| Albert Street | CT5 1HP CT5 1HS CT5 1HT CT5 1HU |
| Argyle Road | CT5 1JR CT5 1JS |
| Athol Road | CT5 2EW |
| Baliol Road | CT5 2EN |
| Beach Alley | CT5 1BS |
| Beresford Road | CT5 1JP |
| Bexley Street | CT5 1HD |
| Brownings Yard | CT5 1FE |
| Castle Road | CT5 2DX CT5 2DY CT5 2EA CT5 2EB |
| Clare Road | CT5 2EH CT5 2EJ CT5 2EL |
| Clifton Road | CT5 1DQ |
| Collingwood Road | CT5 1EB CT5 1ED |
| Cornwallis Circle | CT5 1DT CT5 1DU |
| Cromwell Road | CT5 1LA CT5 1NA CT5 1NE CT5 1NF CT5 1NH CT5 1NJ CT5 1NL CT5 1NN CT5 1NQ CT5 1NW |
| Cushings Walk | CT5 1EZ |
| Diamond Road | CT5 1FW CT5 1JE CT5 1LN CT5 1LT CT5 1LZ CT5 1SG |
| Fountain Street | CT5 1HA CT5 1HB |
| Gann Road | CT5 2EQ |
| Gladstone Road | CT5 1JG |
| Hamilton Road | CT5 1JX |
| Harbour Mews | CT5 1FZ |
| Harbour Street | CT5 1AD CT5 1AE CT5 1AG CT5 1AH CT5 1AQ |
| High Street | CT5 1AP CT5 1AY CT5 1AZ CT5 1BB CT5 1BD CT5 1BQ |
| Horsebridge Road | CT5 1AF |
| Island Wall | CT5 1DY CT5 1EE CT5 1EF CT5 1EL CT5 1EP CT5 1ET CT5 1EW |
| King Edward Street | CT5 1JU |
| Knots Yard | CT5 1AL |
| Leggetts Lane | CT5 1AW |
| Marine Gap | CT5 1EN |
| Marine Terrace | CT5 1EJ |
| Middle Wall | CT5 1BJ CT5 1BN CT5 1BW |
| Nelson Road | CT5 1DP CT5 1DR CT5 1DW CT5 1DX CT5 1DZ CT5 1EA |
| New Street | CT5 1HF |
| Northwood Road | CT5 2ES CT5 2ET CT5 2EU CT5 2EX CT5 2FB |
| Oxford Close | CT5 1JT |
| Oxford Street | CT5 1DA CT5 1DB CT5 1DD CT5 1DG |
| Oyster Mews | CT5 1QY |
| Pettman Mews | CT5 1EU |
| Portway | CT5 1DH |
| Railway Avenue | CT5 1LH CT5 1LJ CT5 1LL |
| Regent Street | CT5 1JD CT5 1JF CT5 1JL CT5 1JN CT5 1JQ CT5 1JW |
| Reservoir Road | CT5 1LX CT5 1LY |
| Salts Close | CT5 1EX |
| Saltway Court | CT5 1SZ |
| Saxon Shore | CT5 1FB |
| Sea Street | CT5 1AN CT5 1FF |
| Sea Wall | CT5 1BT CT5 1BX |
| Seaway Cottages | CT5 1EQ |
| Shaftesbury Road | CT5 1DS |
| St Alphege Court | CT5 1QX |
| St Peters Road | CT5 1HR CT5 1SU |
| Station Road | CT5 1LF CT5 1LG CT5 1LQ |
| Stream Walk | CT5 1HJ |
| Sydenham Street | CT5 1HL CT5 1HN CT5 1HW |
| Tankerton Road | CT5 2AB |
| Terrys Lane | CT5 1DF |
| Teynham Road | CT5 2EF |
| The Slipway | CT5 1BY |
| The Vines | CT5 1BA |
| Tower Parade | CT5 2BF CT5 2BJ |
| Tower Road | CT5 2ER |
| Victoria Mews | CT5 1FH |
| Victoria Street | CT5 1HZ CT5 1JA |
| Warwick Road | CT5 1HX CT5 1HY |
| Waterloo Road | CT5 1BP |
| Wave Crest | CT5 1EH |
| Waverley Mews | CT5 1FJ |
| West Beach | CT5 1EG |
| West Cliff | CT5 1DJ CT5 1DL CT5 1DN |
| Westgate Terrace | CT5 1LB CT5 1LD CT5 1LE |
| Westmeads Road | CT5 1LP CT5 1LR CT5 1LW CT5 1QZ |
| Wheatley Road | CT5 1FR CT5 1LS |
| White Marsh Court | CT5 1NP |
| Whitepost | CT5 1BE |
| Woodlawn Street | CT5 1HG CT5 1HH CT5 1HQ |
Transport near Harbour
- FAQ
- Price Paid By Year
- Property Type Price
Frequently asked questions about Harbour
What is the average price for a property for sale in Harbour?
The average price for a property for sale in Harbour is £426,709. This amount is 7% lower than the average price in Whitstable. There are 2,002 property listings for sale in Harbour.
What streets have the most expensive properties for sale in Harbour?
The streets with the most expensive properties for sale in Harbour are Wave Crest at an average of £1,150,000, Shaftesbury Road at an average of £770,000 and Castle Road at an average of £764,666.
What streets have the most affordable properties for sale in Harbour?
The streets with the most affordable properties for sale in Harbour are High Street at an average of £152,750, White Marsh Court at an average of £160,000 and Reservoir Road at an average of £188,000.
Which train stations are available in or near Harbour?
Some of the train stations available in or near Harbour are Whitstable, Chestfield and Swalecliffe and Herne Bay.
Property Price Paid in Harbour by Year
The average sold property price by year was:
| Year | Average Sold Price | Price Change |
Sold Properties
|
|---|---|---|---|
| 2025 | £430,568 | 5% |
85 Properties |
| 2024 | £410,857 | -7% |
87 Properties |
| 2023 | £439,223 | -2% |
84 Properties |
| 2022 | £447,481 | 2% |
113 Properties |
| 2021 | £440,446 | 13% |
196 Properties |
| 2020 | £384,605 | -1% |
125 Properties |
| 2019 | £386,541 | -1% |
100 Properties |
| 2018 | £391,592 | 4% |
91 Properties |
| 2017 | £374,609 | 11% |
113 Properties |
| 2016 | £332,268 | 9% |
147 Properties |
| 2015 | £303,247 | 6% |
174 Properties |
| 2014 | £284,117 | 12% |
201 Properties |
| 2013 | £249,646 | -1% |
162 Properties |
| 2012 | £253,033 | 5% |
146 Properties |
| 2011 | £240,661 | -6% |
151 Properties |
| 2010 | £255,228 | 21% |
156 Properties |
| 2009 | £200,482 | -7% |
158 Properties |
| 2008 | £214,243 | -0,4% |
104 Properties |
| 2007 | £215,091 | 9% |
243 Properties |
| 2006 | £196,396 | 9% |
221 Properties |
| 2005 | £179,131 | -1% |
173 Properties |
| 2004 | £181,000 | 15% |
220 Properties |
| 2003 | £154,498 | 20% |
206 Properties |
| 2002 | £122,912 | 21% |
235 Properties |
| 2001 | £97,431 | 9% |
175 Properties |
| 2000 | £88,528 | 16% |
164 Properties |
| 1999 | £74,483 | 20% |
159 Properties |
| 1998 | £59,911 | 11% |
145 Properties |
| 1997 | £53,428 | 6% |
182 Properties |
| 1996 | £50,426 | 3% |
181 Properties |
| 1995 | £48,910 | - |
128 Properties |
Property Price per Property Type in Harbour
Here you can find historic sold price data in order to help with your property search.
The average Property Paid Price for specific property types in the last three years are:
| Property Type | Average Sold Price | Sold Properties |
|---|---|---|
| Flat | £253,175.00 | 54 Flats |
| Semi Detached House | £482,363.00 | 42 Semi Detached Houses |
| Detached House | £657,529.00 | 17 Detached Houses |
| Terraced House | £448,454.00 | 143 Terraced Houses |

