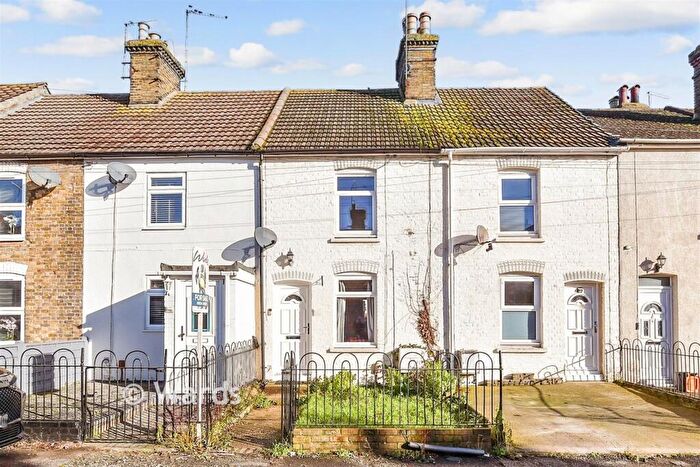
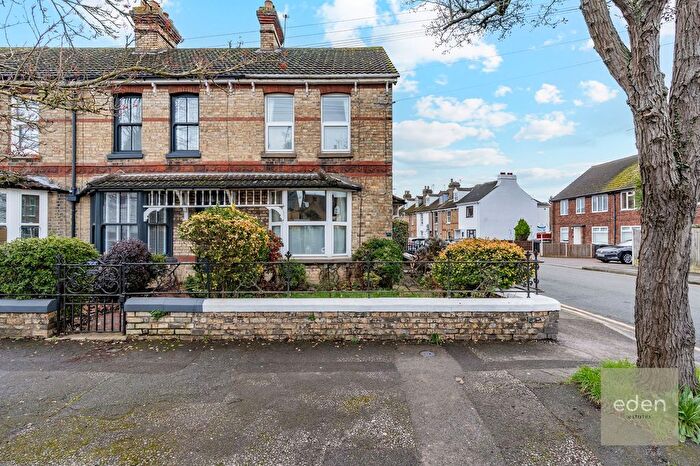
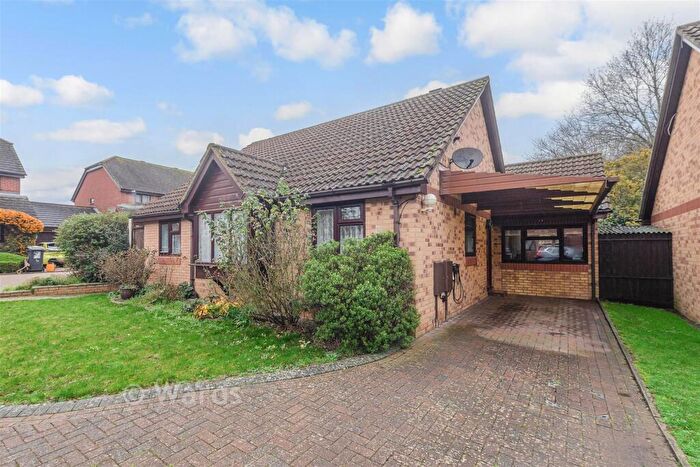
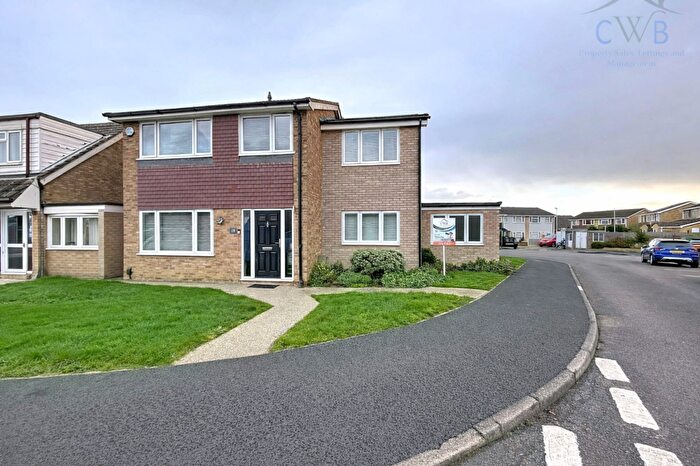
Houses for sale & to rent in Snodland East, Snodland
House Prices in Snodland East
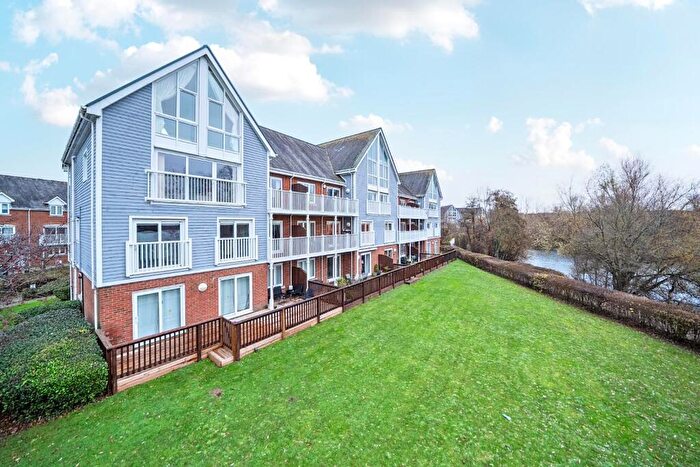
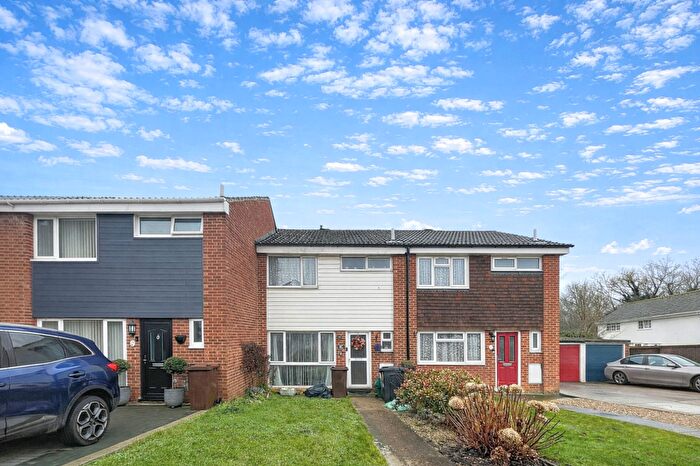
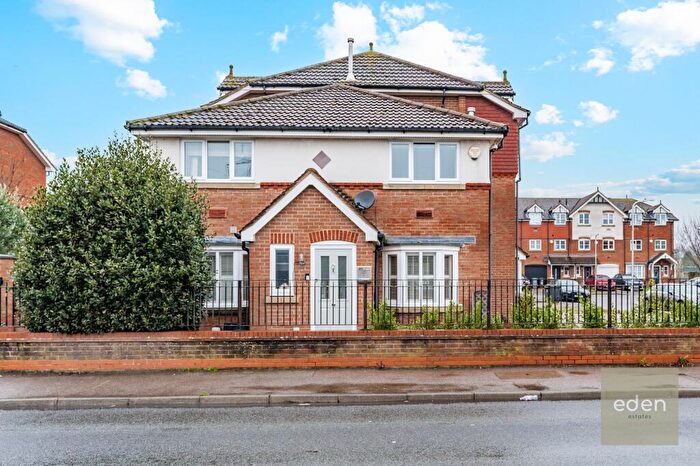
Properties in Snodland East have an average house price of £274,316.00 and had 155 Property Transactions within the last 3 years¹.
Snodland East is an area in Snodland, Kent with 1,511 households², where the most expensive property was sold for £555,000.00.
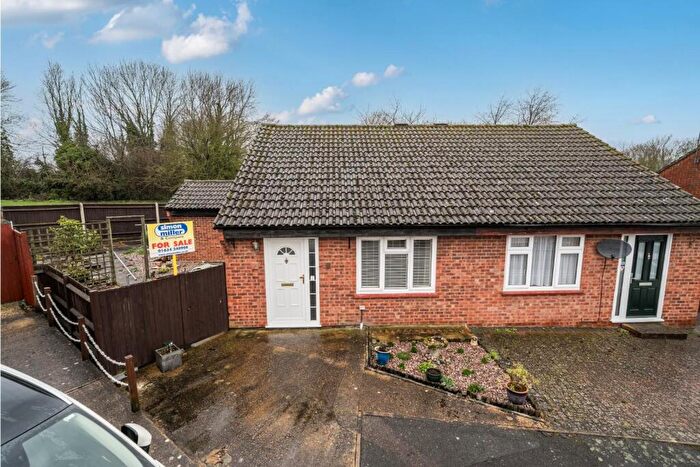
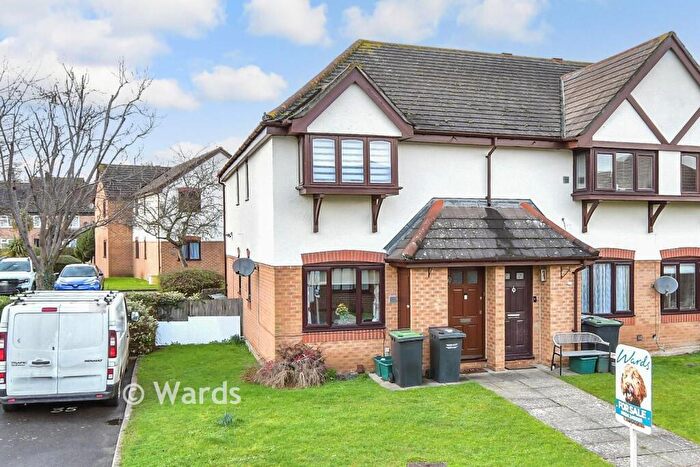
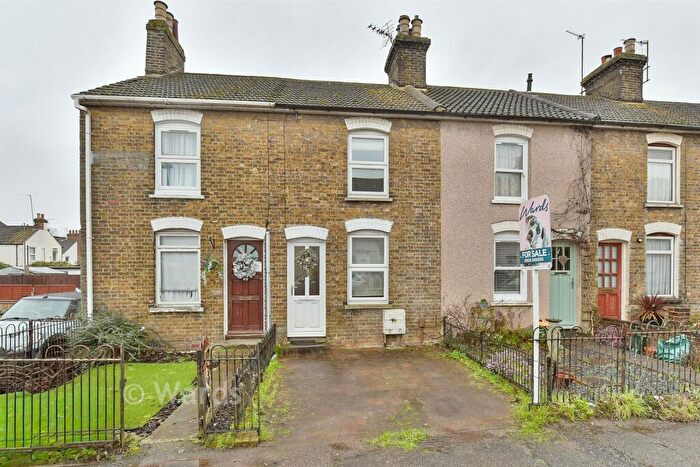
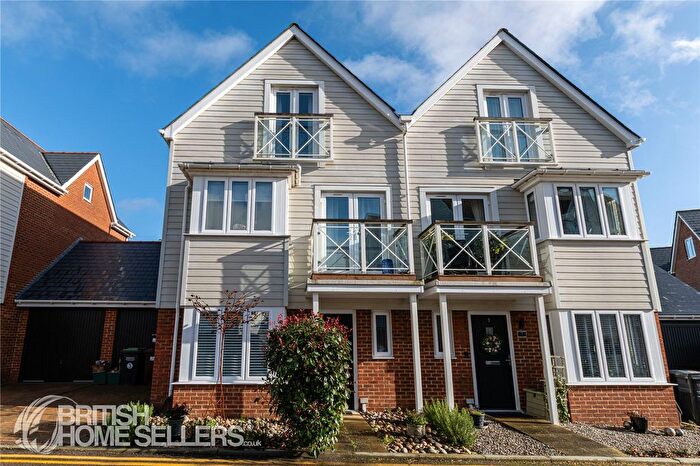
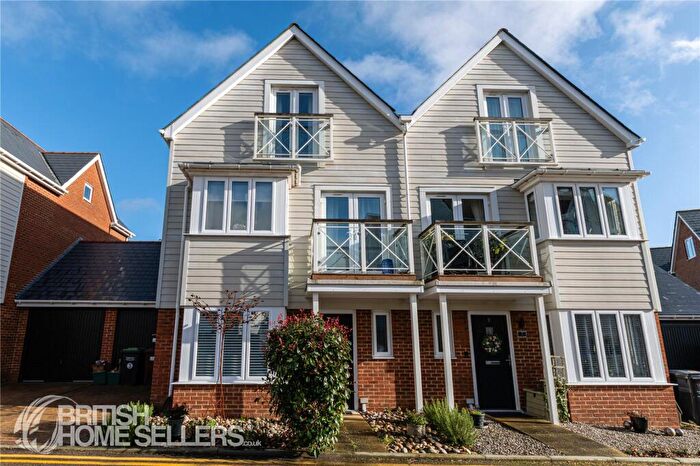
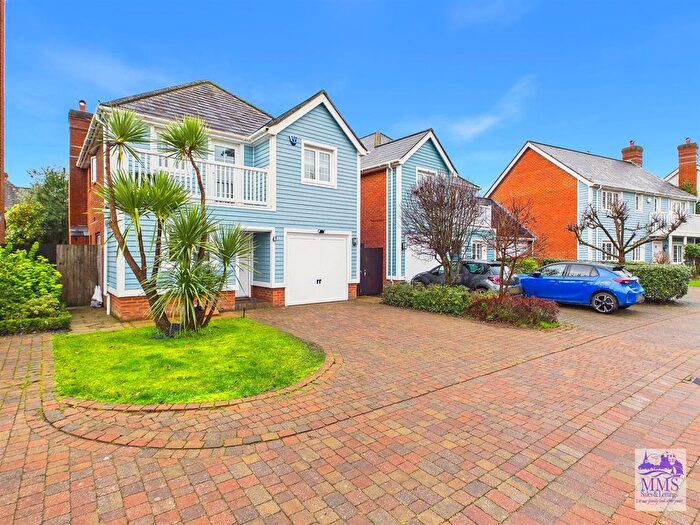
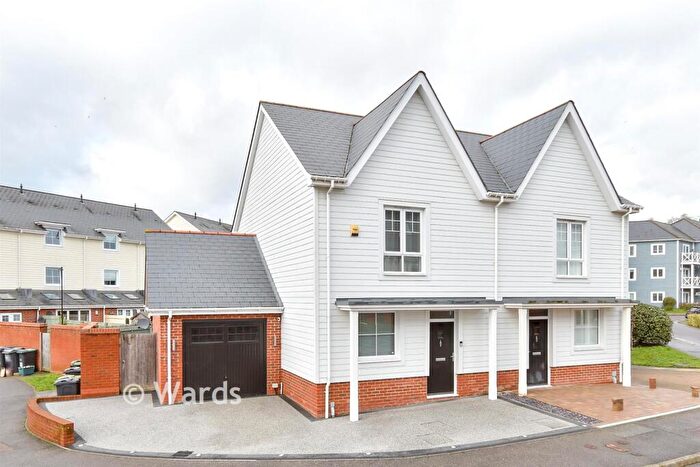
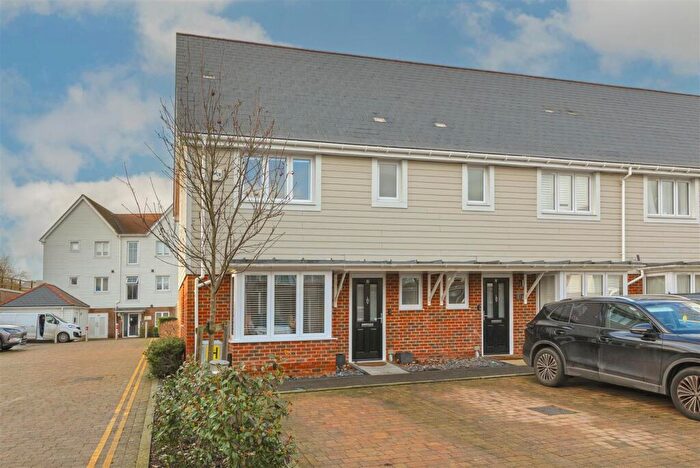
Properties for sale in Snodland East
Roads and Postcodes in Snodland East
Navigate through our locations to find the location of your next house in Snodland East, Snodland for sale or to rent.
| Streets | Postcodes |
|---|---|
| Apple Close | ME6 5JP |
| Ashbee Close | ME6 5HQ |
| Brook Lane | ME6 5JS ME6 5JY ME6 5LF |
| Brook Street | ME6 5BB |
| Cantium Place | ME6 5FD |
| Church Field | ME6 5AR |
| Church Row | ME6 5QR |
| Clock Tower Mews | ME6 5SA |
| Coombe Close | ME6 5EF ME6 5HZ |
| Crowton Court | ME6 5AY |
| Elder Wood Close | ME6 5FH |
| High Street | ME6 5AF ME6 5AG ME6 5AL ME6 5AN ME6 5DA |
| Holborough Road | ME6 5NF ME6 5NJ ME6 5PA ME6 5PB ME6 5PD |
| Kent Road | ME6 5JE |
| Lakeside | ME6 5LD |
| Lakeview Close | ME6 5LX |
| Malling Road | ME6 5AA ME6 5AB ME6 5EE ME6 5HT ME6 5JF |
| May Street | ME6 5AZ |
| Mill Lane | ME6 5AP |
| Nevill Road | ME6 5HU ME6 5HX |
| Norman Road | ME6 5JD |
| Oxford Street | ME6 5AD |
| Queens Avenue | ME6 5BJ ME6 5BL |
| Queens Road | ME6 5BH |
| Rocfort Road | ME6 5NQ |
| Saltings Road | ME6 5HA ME6 5HP ME6 5HR ME6 5HW ME6 5JA |
| Simpson Road | ME6 5QE ME6 5QF ME6 5QH ME6 5QJ |
| Vauxhall Crescent | ME6 5JT |
| Waghorn Road | ME6 5BQ |
| Warnett Court | ME6 5QS |
| Watts Close | ME6 5TA |
| Willowside | ME6 5QN ME6 5QW |
Transport near Snodland East
-
Snodland Station
-
New Hythe Station
-
Halling Station
-
Aylesford Station
-
West Malling Station
-
East Malling Station
- FAQ
- Price Paid By Year
- Property Type Price
Frequently asked questions about Snodland East
What is the average price for a property for sale in Snodland East?
The average price for a property for sale in Snodland East is £274,316. This amount is 11% lower than the average price in Snodland. There are 748 property listings for sale in Snodland East.
What streets have the most expensive properties for sale in Snodland East?
The streets with the most expensive properties for sale in Snodland East are Elder Wood Close at an average of £547,500, Simpson Road at an average of £361,000 and Nevill Road at an average of £358,333.
What streets have the most affordable properties for sale in Snodland East?
The streets with the most affordable properties for sale in Snodland East are Clock Tower Mews at an average of £147,750, Warnett Court at an average of £171,875 and Watts Close at an average of £201,875.
Which train stations are available in or near Snodland East?
Some of the train stations available in or near Snodland East are Snodland, New Hythe and Halling.
Property Price Paid in Snodland East by Year
The average sold property price by year was:
| Year | Average Sold Price | Price Change |
Sold Properties
|
|---|---|---|---|
| 2025 | £282,065 | 7% |
46 Properties |
| 2024 | £263,448 | -5% |
49 Properties |
| 2023 | £277,250 | -1% |
60 Properties |
| 2022 | £280,323 | 2% |
62 Properties |
| 2021 | £273,339 | 3% |
97 Properties |
| 2020 | £266,173 | 5% |
46 Properties |
| 2019 | £253,754 | 4% |
53 Properties |
| 2018 | £242,519 | 8% |
67 Properties |
| 2017 | £223,756 | 5% |
76 Properties |
| 2016 | £211,674 | 9% |
75 Properties |
| 2015 | £192,306 | -1% |
67 Properties |
| 2014 | £193,482 | 21% |
71 Properties |
| 2013 | £152,520 | 6% |
54 Properties |
| 2012 | £144,067 | -13% |
37 Properties |
| 2011 | £162,809 | -7% |
63 Properties |
| 2010 | £174,170 | 11% |
66 Properties |
| 2009 | £155,356 | 1% |
49 Properties |
| 2008 | £154,047 | -2% |
35 Properties |
| 2007 | £157,706 | 5% |
94 Properties |
| 2006 | £149,428 | 12% |
113 Properties |
| 2005 | £131,958 | -1% |
81 Properties |
| 2004 | £133,470 | 16% |
88 Properties |
| 2003 | £112,638 | 14% |
80 Properties |
| 2002 | £97,171 | 17% |
115 Properties |
| 2001 | £80,169 | 14% |
102 Properties |
| 2000 | £69,278 | 2% |
75 Properties |
| 1999 | £67,865 | 20% |
77 Properties |
| 1998 | £54,405 | 3% |
64 Properties |
| 1997 | £52,531 | 13% |
76 Properties |
| 1996 | £45,451 | -1% |
50 Properties |
| 1995 | £45,827 | - |
55 Properties |
Property Price per Property Type in Snodland East
Here you can find historic sold price data in order to help with your property search.
The average Property Paid Price for specific property types in the last three years are:
| Property Type | Average Sold Price | Sold Properties |
|---|---|---|
| Semi Detached House | £312,055.00 | 36 Semi Detached Houses |
| Detached House | £332,833.00 | 9 Detached Houses |
| Terraced House | £272,742.00 | 95 Terraced Houses |
| Flat | £158,600.00 | 15 Flats |

