Houses for sale & to rent in Snodland West, Snodland
House Prices in Snodland West
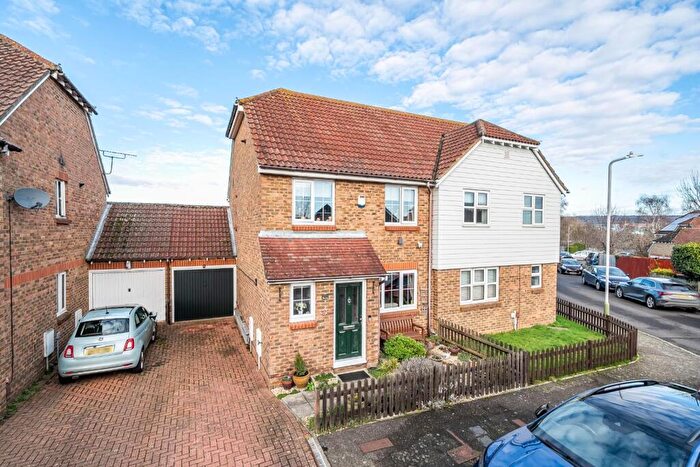
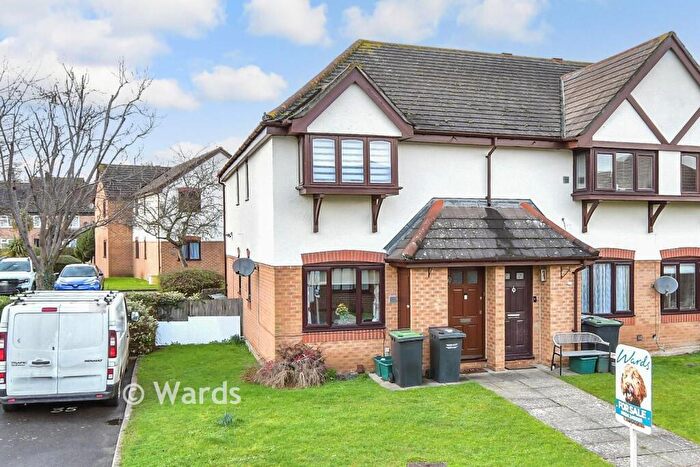
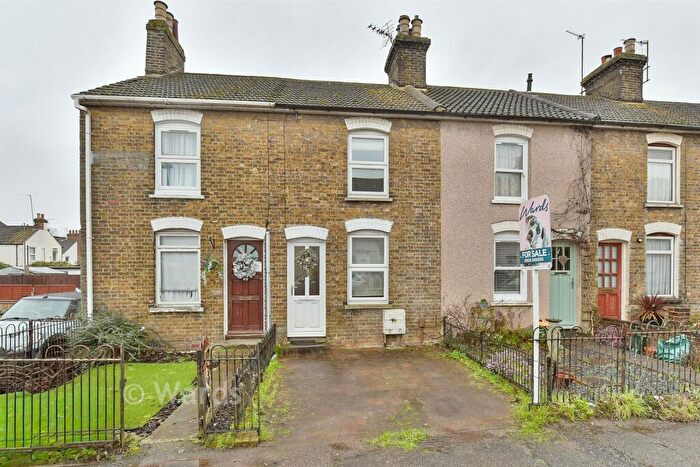
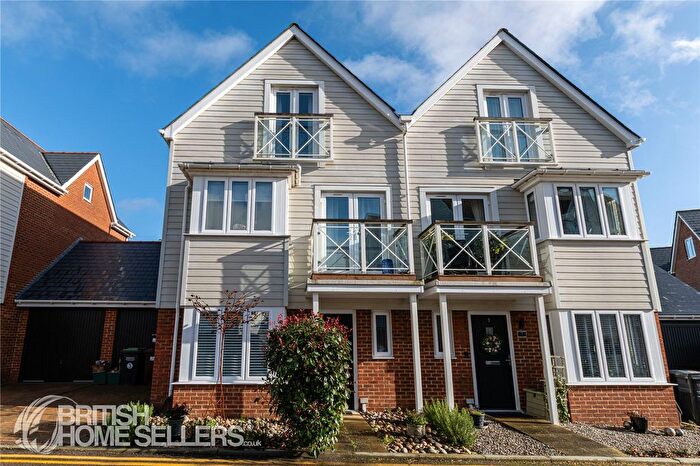
Properties in Snodland West have an average house price of £312,765.00 and had 289 Property Transactions within the last 3 years¹.
Snodland West is an area in Snodland, Kent with 2,401 households², where the most expensive property was sold for £725,000.00.
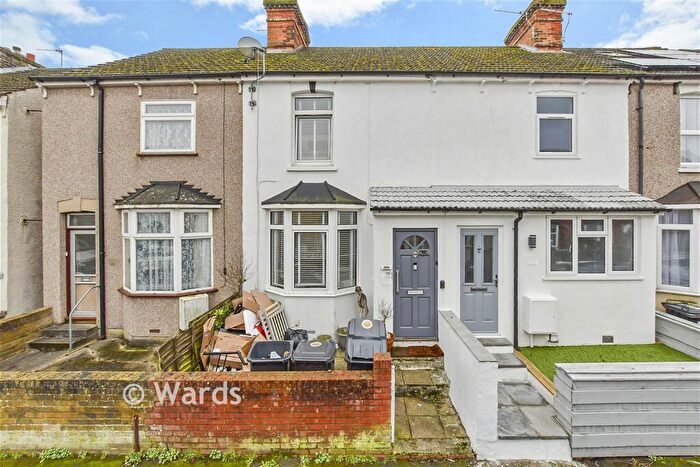
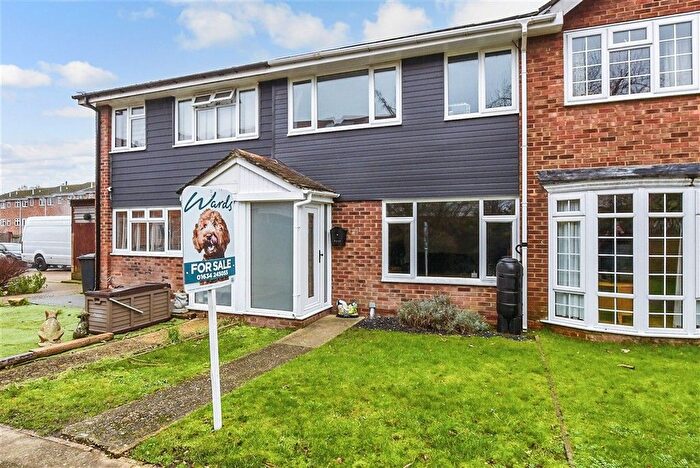
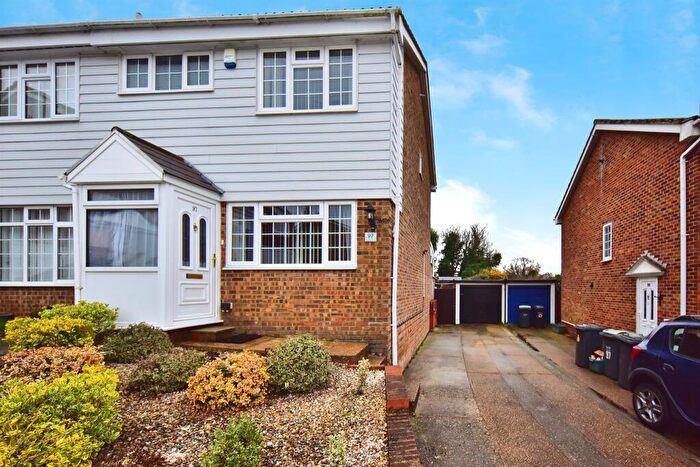
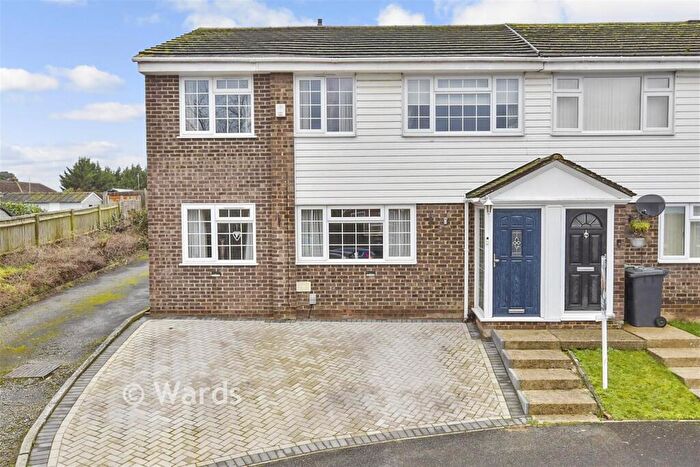
Properties for sale in Snodland West
Roads and Postcodes in Snodland West
Navigate through our locations to find the location of your next house in Snodland West, Snodland for sale or to rent.
| Streets | Postcodes |
|---|---|
| Alex Hughes Close | ME6 5ST |
| Alisander Close | ME6 5SH |
| Annie Road | ME6 5JQ |
| Bingley Close | ME6 5PS |
| Birling Road | ME6 5DT ME6 5DZ ME6 5EA ME6 5ES ME6 5ET |
| Booth Close | ME6 5SG |
| Bramley Road | ME6 5DY |
| Bullfields | ME6 5AW |
| Busbridge Road | ME6 5NS |
| Cemetery Road | ME6 5BF |
| Chapel Road | ME6 5NE |
| Charles Close | ME6 5EB |
| Constitution Hill | ME6 5BY ME6 5DH ME6 5DJ ME6 5ED |
| Cooper Road | ME6 5JH |
| Covey Hall Road | ME6 5NX ME6 5NY |
| Coxs Close | ME6 5RA |
| Crossfield Walk | ME6 5SE |
| Dawn Terrace | ME6 5GX |
| Dowling Close | ME6 5PF |
| Dryland Road | ME6 5EU ME6 5HD ME6 5HE |
| Edgeler Court | ME6 5QL |
| Fletcher Gardens | ME6 5BZ |
| Freelands Road | ME6 5RD ME6 5RE ME6 5RF ME6 5RG |
| Gassons Road | ME6 5RS ME6 5RW |
| Godden Road | ME6 5HF ME6 5HG |
| Gorham Close | ME6 5EZ |
| Hambrook Road | ME6 5SQ |
| Hamilton Close | ME6 5GA |
| Hegarty Court | ME6 5BW |
| High Street | ME6 5DB ME6 5DF ME6 5DG |
| Higham Avenue | ME6 5GE |
| Hodgson Crescent | ME6 5NR |
| Holborough Road | ME6 5NL |
| Hollow Lane | ME6 5GJ ME6 5LP ME6 5LR ME6 5LS ME6 5LT |
| Hook Road | ME6 5RQ |
| Lambe Close | ME6 5PE |
| Lee Road | ME6 5NN ME6 5NW |
| Lewis Mews | ME6 5LN |
| Linnitt Road | ME6 5FE |
| Lucas Road | ME6 5PY ME6 5PZ |
| Malling Road | ME6 5DD ME6 5EG ME6 5EQ ME6 5JG ME6 5JJ ME6 5JL ME6 5JN ME6 5JW ME6 5NA ME6 5NB ME6 5ND |
| Manley Boulevard | ME6 5GB ME6 5SD |
| Meadow Walk | ME6 5EP |
| Midsummer Road | ME6 5RP ME6 5RR |
| Morhen Close | ME6 5LZ |
| Orchard Way | ME6 5EW |
| Paddlesworth Road | ME6 5DP |
| Portland Place | ME6 5NH |
| Pout Road | ME6 5EX ME6 5EY |
| Poynder Drive | ME6 5SF ME6 5SP |
| Pridmore Road | ME6 5PR |
| Recreation Avenue | ME6 5DX |
| Ritch Road | ME6 5PU |
| Roberts Road | ME6 5HL ME6 5HN |
| Roman Road | ME6 5PP |
| St Benedict Road | ME6 5LU ME6 5LY |
| St Katherines Lane | ME6 5EH ME6 5EN ME6 5ER |
| Stevens Close | ME6 5DU |
| Taylor Road | ME6 5HH ME6 5HJ |
| Tom Joyce Close | ME6 5BT ME6 5BU |
| Townsend Road | ME6 5RH ME6 5RJ ME6 5RL ME6 5RN |
| Veles Road | ME6 5RB |
| Whitby Close | ME6 5FJ |
| Wickham Road | ME6 5SR |
| Woodlands Avenue | ME6 5NP |
| Wyvern Close | ME6 5EL |
Transport near Snodland West
-
Snodland Station
-
New Hythe Station
-
Halling Station
-
Aylesford Station
-
West Malling Station
-
East Malling Station
- FAQ
- Price Paid By Year
- Property Type Price
Frequently asked questions about Snodland West
What is the average price for a property for sale in Snodland West?
The average price for a property for sale in Snodland West is £312,765. This amount is 2% higher than the average price in Snodland. There are 707 property listings for sale in Snodland West.
What streets have the most expensive properties for sale in Snodland West?
The streets with the most expensive properties for sale in Snodland West are Whitby Close at an average of £645,833, Gorham Close at an average of £427,500 and Hambrook Road at an average of £423,333.
What streets have the most affordable properties for sale in Snodland West?
The streets with the most affordable properties for sale in Snodland West are Bingley Close at an average of £202,090, Alisander Close at an average of £229,333 and Townsend Road at an average of £233,374.
Which train stations are available in or near Snodland West?
Some of the train stations available in or near Snodland West are Snodland, New Hythe and Halling.
Property Price Paid in Snodland West by Year
The average sold property price by year was:
| Year | Average Sold Price | Price Change |
Sold Properties
|
|---|---|---|---|
| 2025 | £333,264 | 11% |
96 Properties |
| 2024 | £296,094 | -4% |
99 Properties |
| 2023 | £309,388 | -1% |
94 Properties |
| 2022 | £311,893 | 5% |
131 Properties |
| 2021 | £297,243 | 3% |
173 Properties |
| 2020 | £289,603 | 9% |
96 Properties |
| 2019 | £264,799 | -3% |
86 Properties |
| 2018 | £273,871 | 1% |
106 Properties |
| 2017 | £271,246 | 8% |
147 Properties |
| 2016 | £250,319 | 9% |
111 Properties |
| 2015 | £227,336 | 9% |
137 Properties |
| 2014 | £207,585 | -5% |
169 Properties |
| 2013 | £217,772 | 14% |
121 Properties |
| 2012 | £186,500 | 0,3% |
109 Properties |
| 2011 | £185,880 | 5% |
113 Properties |
| 2010 | £175,703 | 0,5% |
81 Properties |
| 2009 | £174,862 | -13% |
96 Properties |
| 2008 | £196,936 | 5% |
87 Properties |
| 2007 | £186,353 | 8% |
199 Properties |
| 2006 | £170,740 | 9% |
197 Properties |
| 2005 | £154,568 | 1% |
123 Properties |
| 2004 | £152,304 | 8% |
132 Properties |
| 2003 | £140,205 | 22% |
121 Properties |
| 2002 | £109,533 | 15% |
150 Properties |
| 2001 | £93,195 | 17% |
136 Properties |
| 2000 | £77,493 | 12% |
104 Properties |
| 1999 | £68,258 | 5% |
93 Properties |
| 1998 | £64,952 | 10% |
92 Properties |
| 1997 | £58,248 | 8% |
133 Properties |
| 1996 | £53,734 | -7% |
91 Properties |
| 1995 | £57,235 | - |
100 Properties |
Property Price per Property Type in Snodland West
Here you can find historic sold price data in order to help with your property search.
The average Property Paid Price for specific property types in the last three years are:
| Property Type | Average Sold Price | Sold Properties |
|---|---|---|
| Semi Detached House | £348,450.00 | 108 Semi Detached Houses |
| Detached House | £495,636.00 | 22 Detached Houses |
| Terraced House | £294,743.00 | 111 Terraced Houses |
| Flat | £190,332.00 | 48 Flats |

