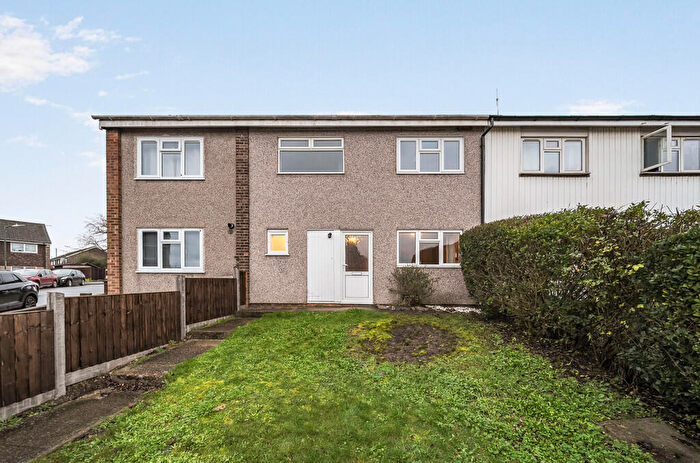
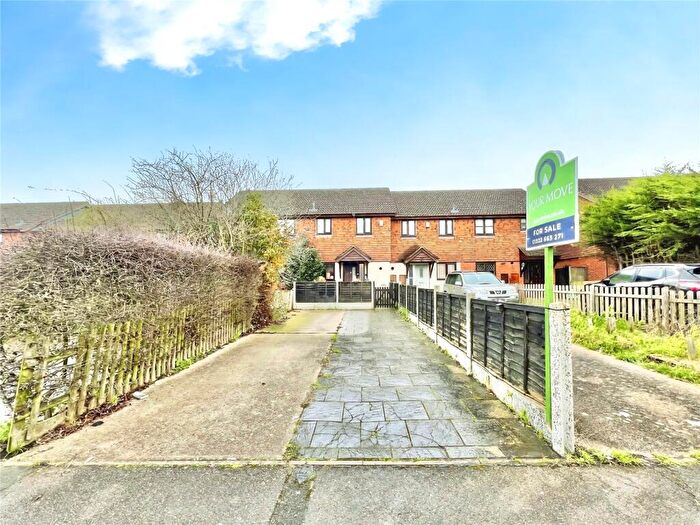
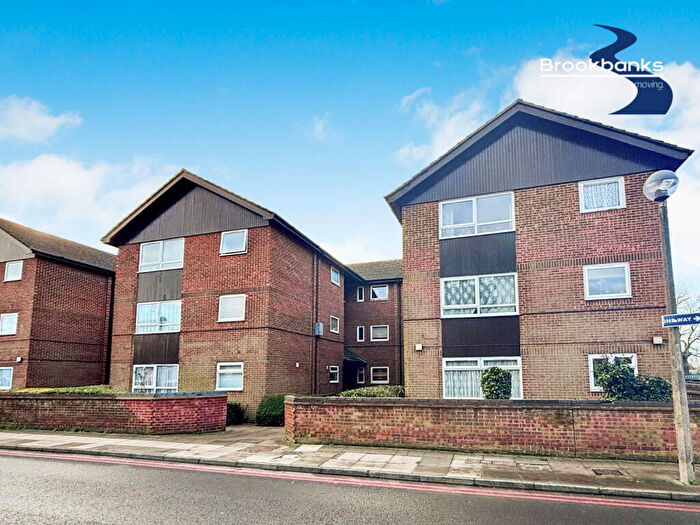
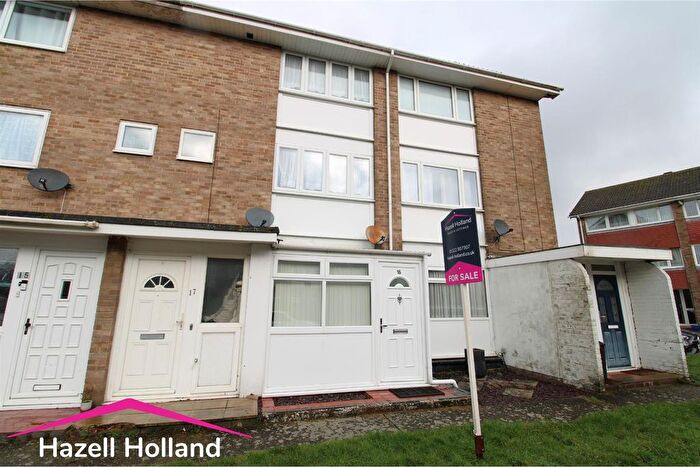
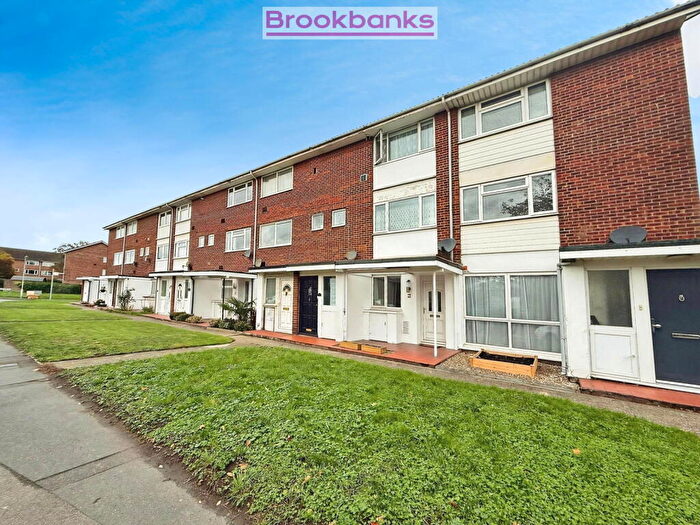
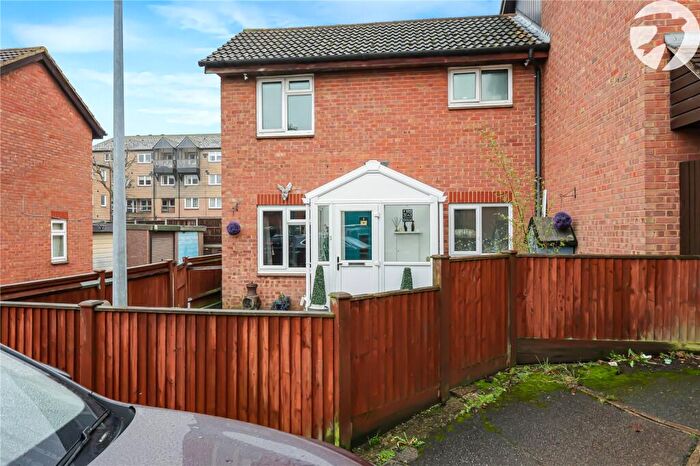
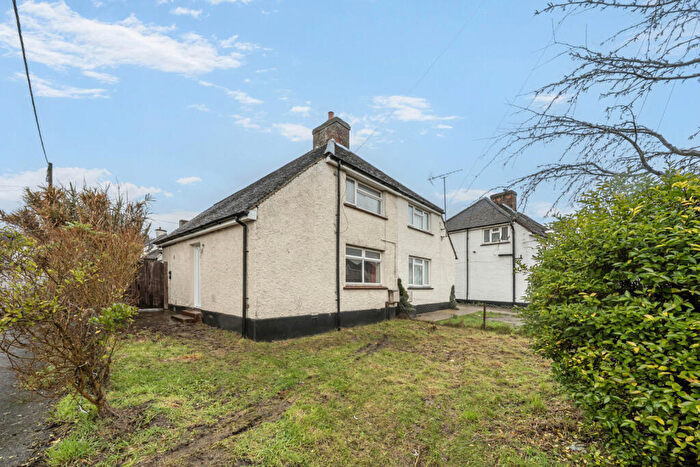
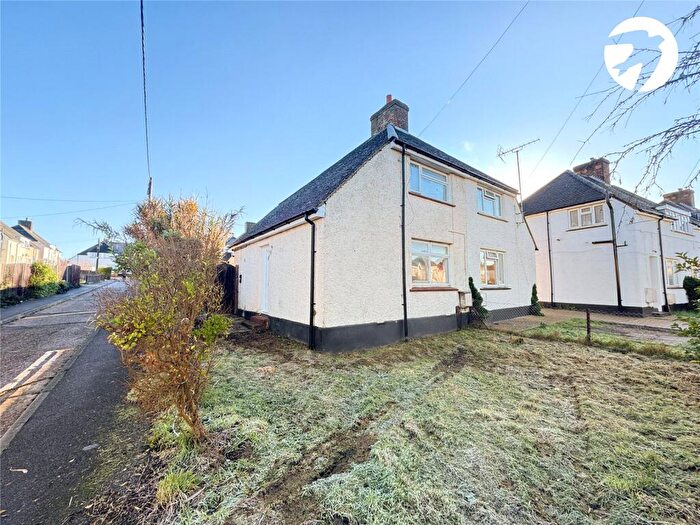
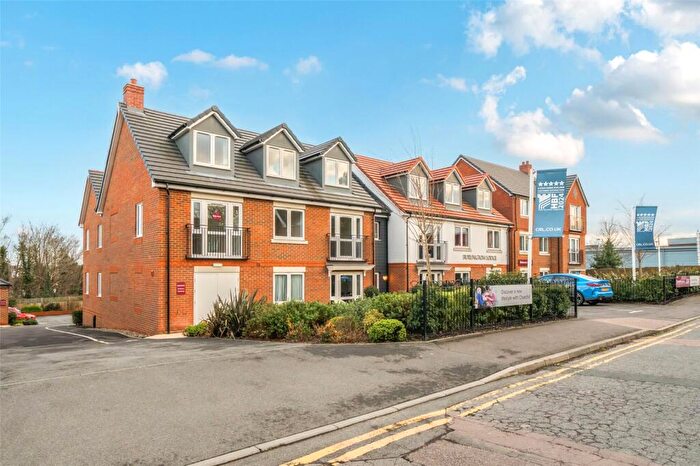
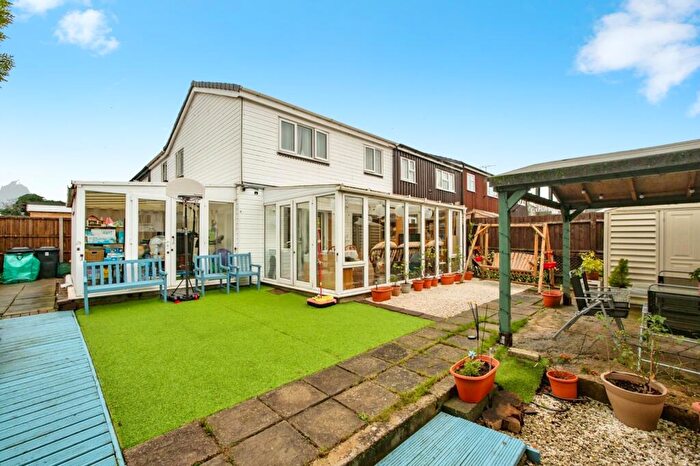
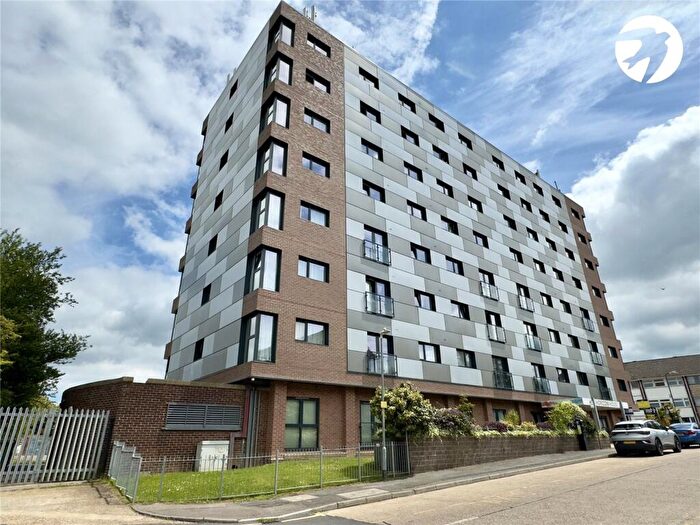
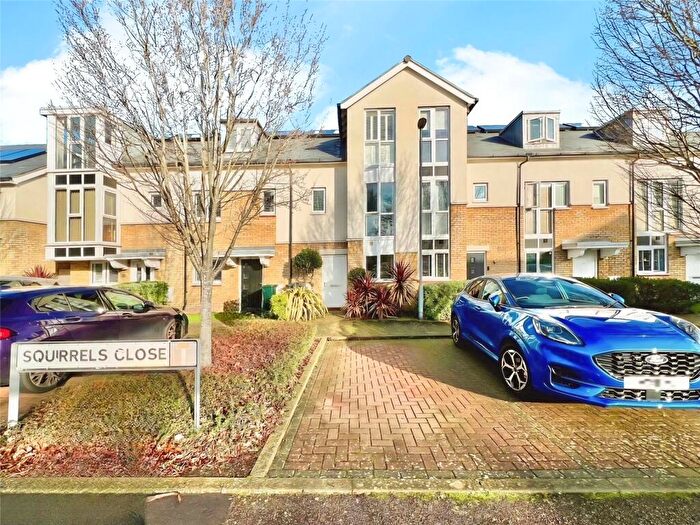
Houses for sale & to rent in Swanley St Marys, Swanley
House Prices in Swanley St Marys
Properties in Swanley St Marys have an average house price of £367,778.97 and had 126 Property Transactions within the last 3 years¹.
Swanley St Marys is an area in Swanley, Kent with 1,783 households², where the most expensive property was sold for £950,000.00.
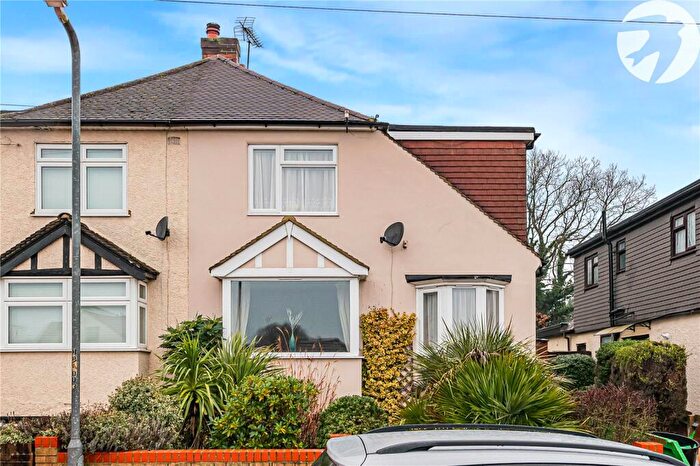
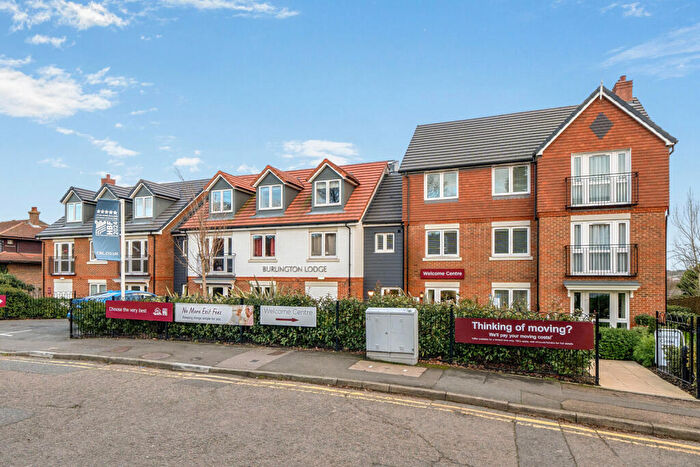
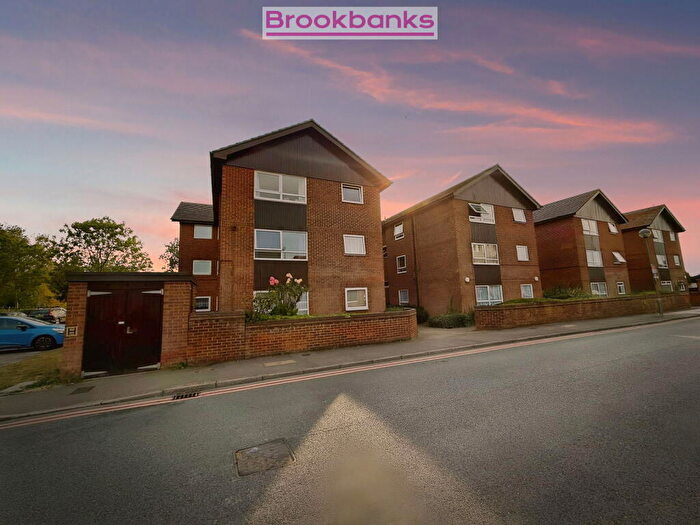
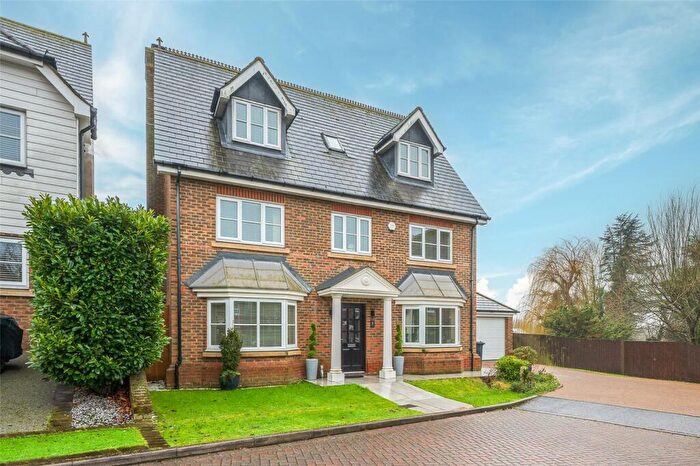
Properties for sale in Swanley St Marys
Roads and Postcodes in Swanley St Marys
Navigate through our locations to find the location of your next house in Swanley St Marys, Swanley for sale or to rent.
| Streets | Postcodes |
|---|---|
| Almond Drive | BR8 7EQ |
| Apple Orchard | BR8 7EL |
| Ash Close | BR8 7ES |
| Bourne Way | BR8 7HX |
| Brook Road | BR8 7EX BR8 7EY BR8 7EZ |
| Cedar Close | BR8 7HG BR8 7HQ |
| Cherry Avenue | BR8 7DU BR8 7DX |
| Crescent Gardens | BR8 7HE BR8 7HF |
| Dale Road | BR8 7HP BR8 7HR |
| Ellis Close | BR8 7EN |
| Everest Place | BR8 7BX |
| Farm Avenue | BR8 7HY BR8 7HZ BR8 7JA |
| Greenside | BR8 7ER |
| Hart Dyke Crescent | BR8 7EG |
| Hart Dyke Road | BR8 7DB BR8 7DD BR8 7DE BR8 7DF BR8 7EE BR8 7EF |
| Heathwood Gardens | BR8 7HL BR8 7HN |
| Heathwood Parade | BR8 7HB |
| Hewett Place | BR8 7DG |
| Hibbs Close | BR8 7FA |
| Hockenden Lane | BR8 7QE |
| Irving Way | BR8 7EP |
| Laburnum Avenue | BR8 7DJ BR8 7DL BR8 7DP |
| Lavender Hill | BR8 7DH |
| Lawn Close | BR8 7HJ BR8 7JX |
| Leewood Place | BR8 7BZ |
| Lesley Close | BR8 7AX |
| Lilac Gardens | BR8 7DQ |
| Lime Road | BR8 7ED BR8 7WB |
| London Road | BR8 7AB BR8 7AQ BR8 7AW BR8 7HA BR8 7AA BR8 7AE BR8 7AJ |
| Lynden Way | BR8 7DN BR8 7DW |
| Morello Close | BR8 7WH |
| Nightingale Way | BR8 7UD BR8 7UP |
| Nursery Close | BR8 7HH |
| Oliver Road | BR8 7DY BR8 7DZ BR8 7EA BR8 7EB |
| Reeves Crescent | BR8 7EH |
| Rowan Road | BR8 7DR BR8 7DS |
| Ruxton Close | BR8 7DA BR8 7AD |
| Sermon Drive | BR8 7HS BR8 7HT |
| Southern Place | BR8 7BY |
| St Marys Road | BR8 7BA BR8 7BU BR8 7FN BR8 7FQ BR8 7TE |
| Swanley Centre | BR8 7AH BR8 7TG BR8 7TJ BR8 7TL BR8 7TQ |
| The Croft | BR8 7HU |
| The Square | BR8 7XY |
| West Harold | BR8 7EJ |
| White Oak Bungalows | BR8 7HW |
| Wood End | BR8 7EW |
| Woodview Road | BR8 7ET |
| BR8 7EU BR8 7UQ BR8 9AD BR8 9BA BR8 9BH BR8 9BJ BR8 9BN BR8 9BP BR8 9BT BR8 9BX BR8 9DR BR8 9DS BR8 9DT BR8 9DU BR8 9XA BR8 9EJ |
Transport near Swanley St Marys
- FAQ
- Price Paid By Year
- Property Type Price
Frequently asked questions about Swanley St Marys
What is the average price for a property for sale in Swanley St Marys?
The average price for a property for sale in Swanley St Marys is £367,779. This amount is 7% lower than the average price in Swanley. There are 1,030 property listings for sale in Swanley St Marys.
What streets have the most expensive properties for sale in Swanley St Marys?
The streets with the most expensive properties for sale in Swanley St Marys are Ruxton Close at an average of £530,000, Heathwood Gardens at an average of £521,428 and Woodview Road at an average of £505,000.
What streets have the most affordable properties for sale in Swanley St Marys?
The streets with the most affordable properties for sale in Swanley St Marys are Lawn Close at an average of £162,500, Nightingale Way at an average of £190,100 and ST MARYS ROAD at an average of £200,000.
Which train stations are available in or near Swanley St Marys?
Some of the train stations available in or near Swanley St Marys are Swanley, St Mary Cray and St.Mary Cray.
Property Price Paid in Swanley St Marys by Year
The average sold property price by year was:
| Year | Average Sold Price | Price Change |
Sold Properties
|
|---|---|---|---|
| 2025 | £362,453.49 | -8% |
43 Properties |
| 2024 | £389,910.47 | 10% |
43 Properties |
| 2023 | £349,712.5 | -7% |
40 Properties |
| 2022 | £373,024.32 | 6% |
37 Properties |
| 2021 | £349,012.02 | -4% |
62 Properties |
| 2020 | £363,551 | 8% |
66 Properties |
| 2019 | £333,719.39 | 6% |
49 Properties |
| 2018 | £312,619 | -4% |
44 Properties |
| 2017 | £323,886 | 16% |
42 Properties |
| 2016 | £272,025 | 14% |
41 Properties |
| 2015 | £233,693 | 3% |
44 Properties |
| 2014 | £226,326 | 21% |
55 Properties |
| 2013 | £179,879 | -2% |
30 Properties |
| 2012 | £182,961 | 8% |
38 Properties |
| 2011 | £168,802 | -8% |
41 Properties |
| 2010 | £182,616 | 12% |
38 Properties |
| 2009 | £161,144 | -24% |
27 Properties |
| 2008 | £199,141 | 4% |
35 Properties |
| 2007 | £191,504 | 9% |
73 Properties |
| 2006 | £173,953 | 5% |
64 Properties |
| 2005 | £164,581 | 4% |
51 Properties |
| 2004 | £158,659 | -2% |
64 Properties |
| 2003 | £162,215 | 22% |
74 Properties |
| 2002 | £126,769 | 14% |
71 Properties |
| 2001 | £108,965 | 2% |
62 Properties |
| 2000 | £106,968 | 22% |
53 Properties |
| 1999 | £83,453 | 6% |
58 Properties |
| 1998 | £78,605 | 8% |
45 Properties |
| 1997 | £72,108 | 6% |
78 Properties |
| 1996 | £68,094 | 17% |
39 Properties |
| 1995 | £56,730 | - |
29 Properties |
Property Price per Property Type in Swanley St Marys
Here you can find historic sold price data in order to help with your property search.
The average Property Paid Price for specific property types in the last three years are:
| Property Type | Average Sold Price | Sold Properties |
|---|---|---|
| Semi Detached House | £408,752.00 | 72 Semi Detached Houses |
| Detached House | £549,500.00 | 8 Detached Houses |
| Terraced House | £339,347.00 | 23 Terraced Houses |
| Flat | £204,739.13 | 23 Flats |

