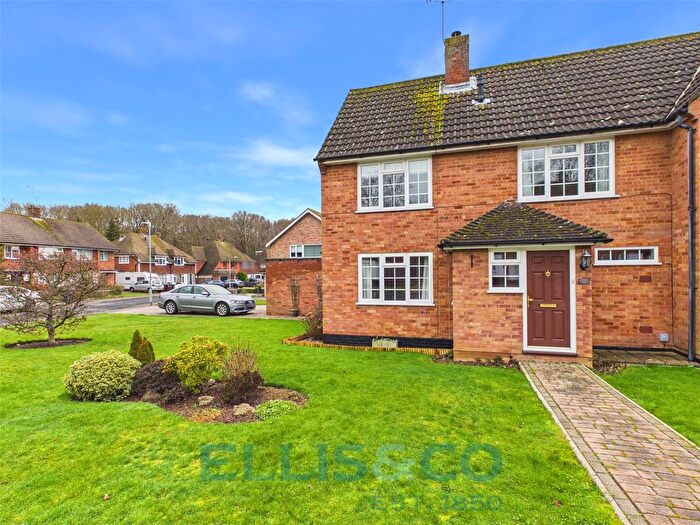
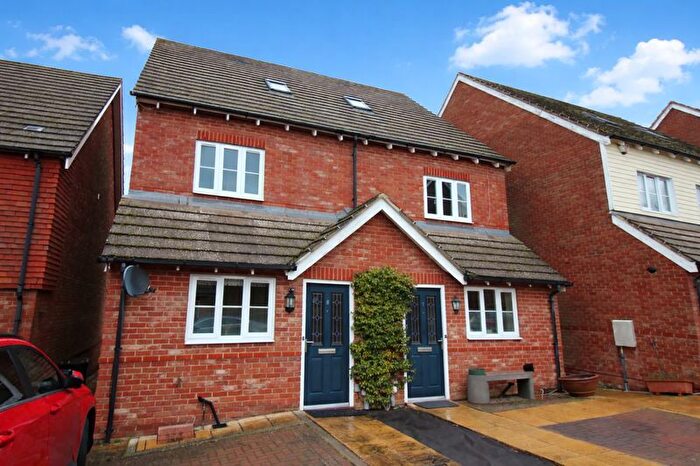
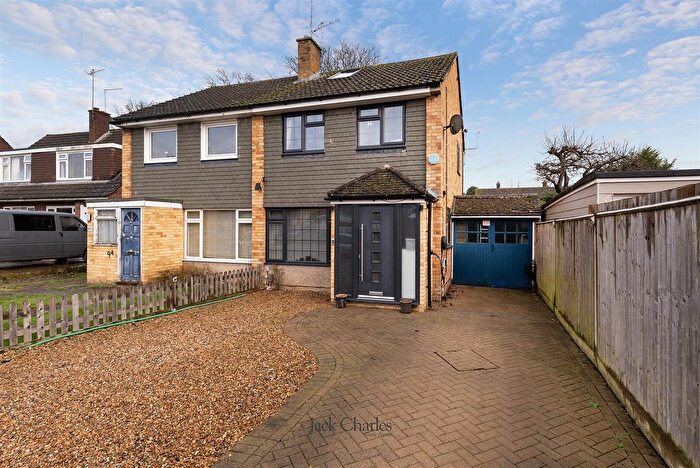
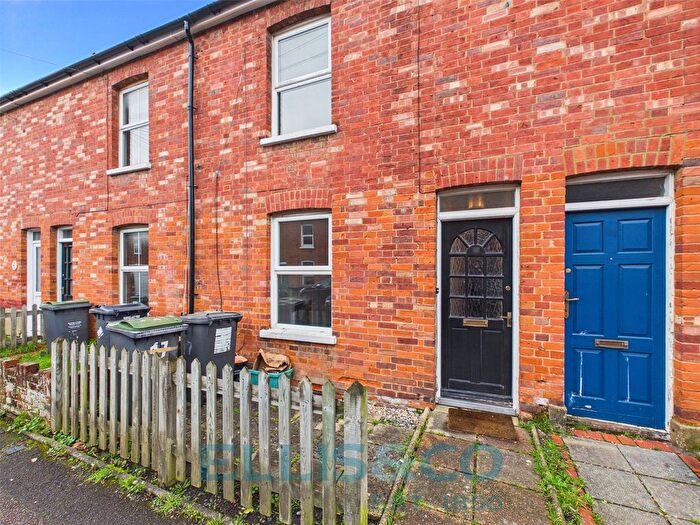
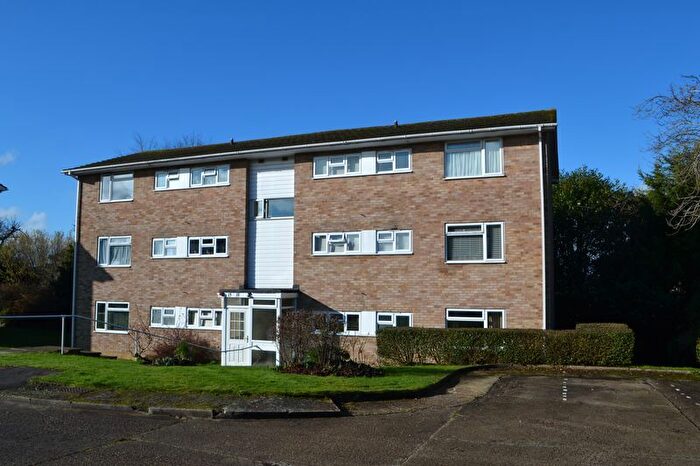
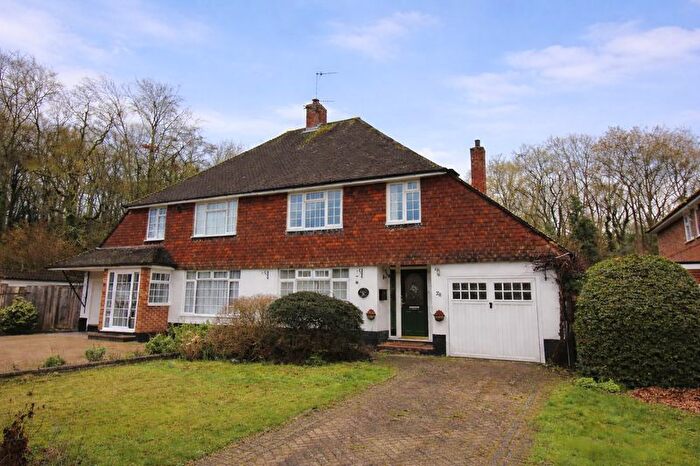
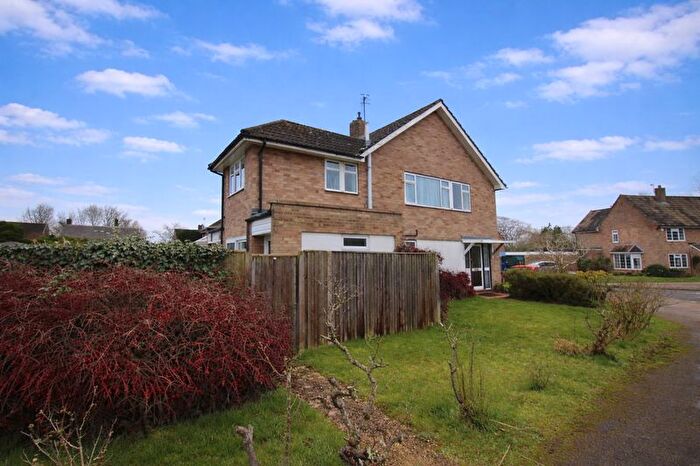
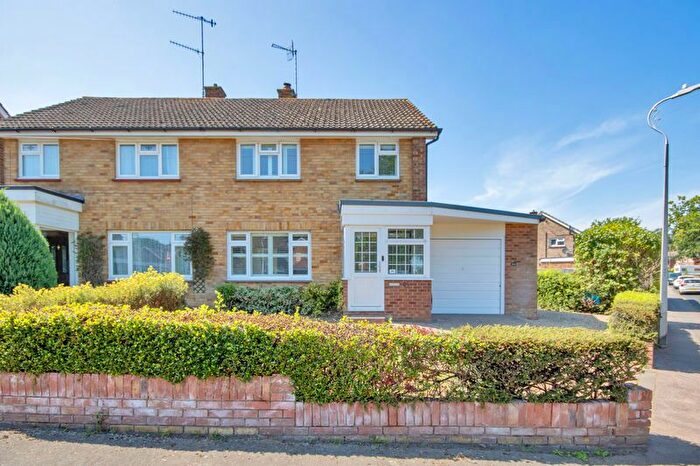
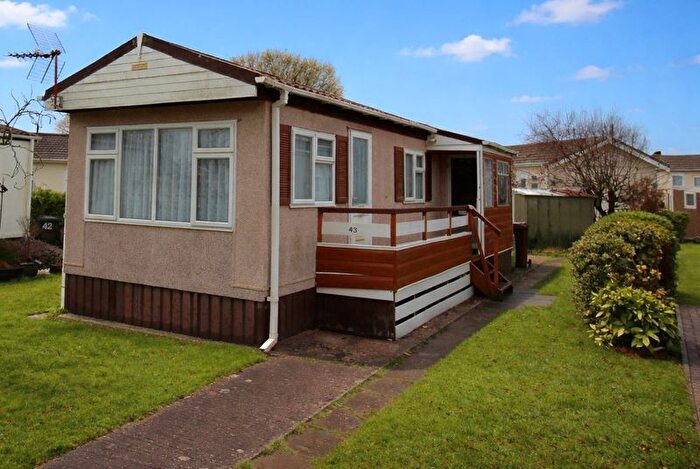
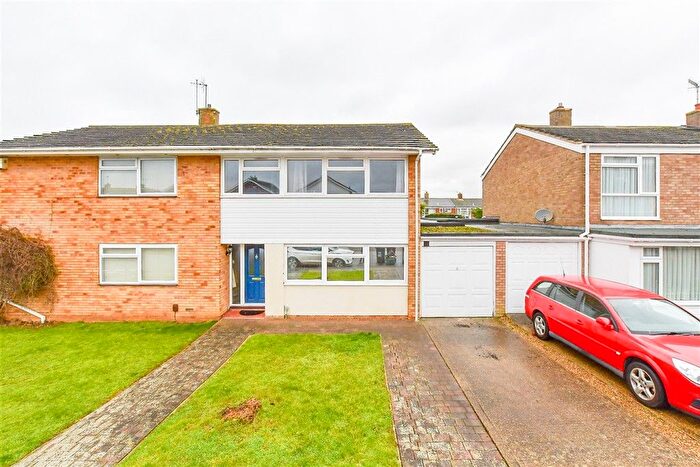
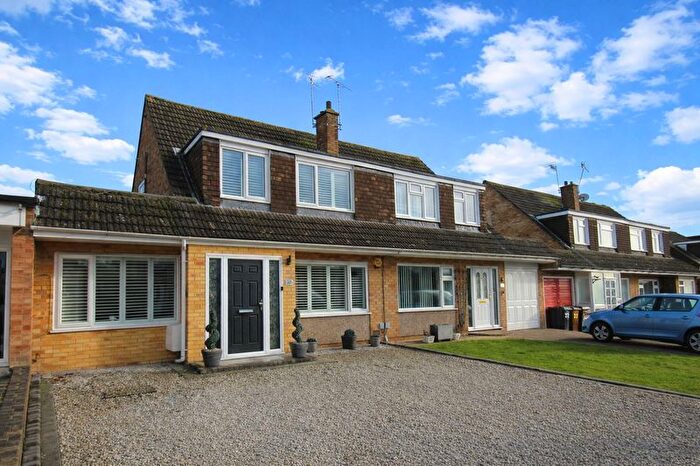
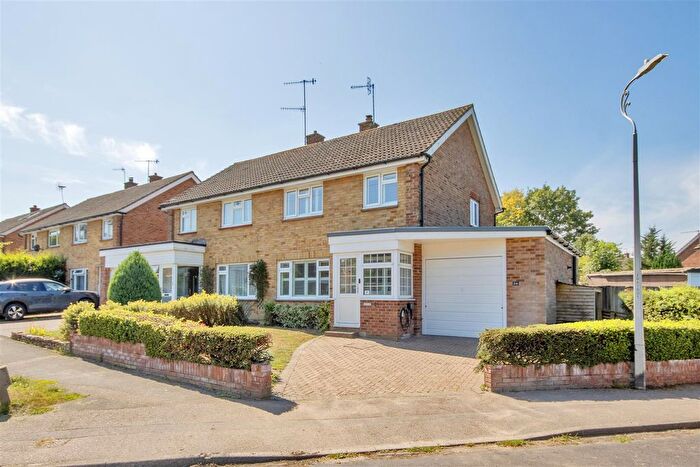
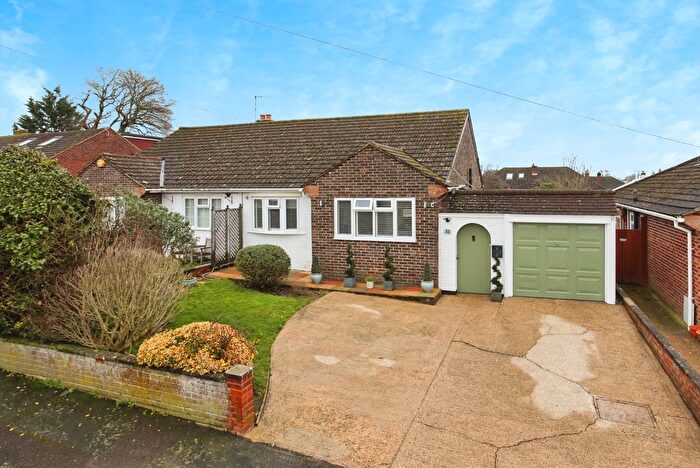
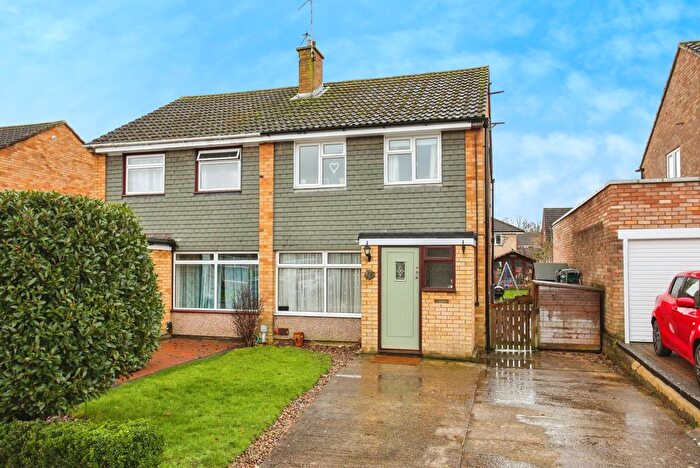
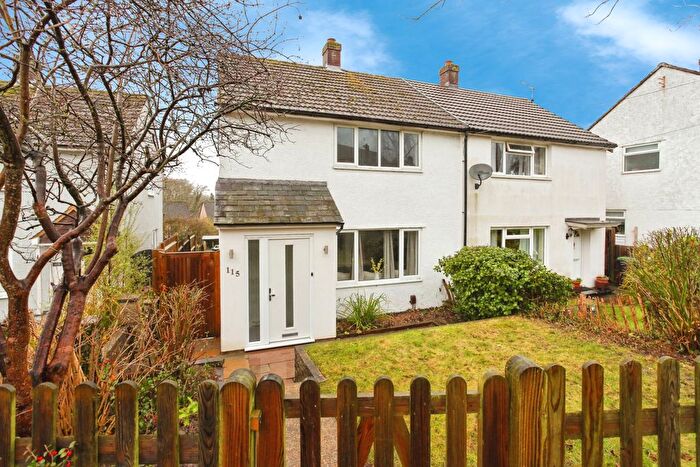
Houses for sale & to rent in Cage Green, Tonbridge
House Prices in Cage Green
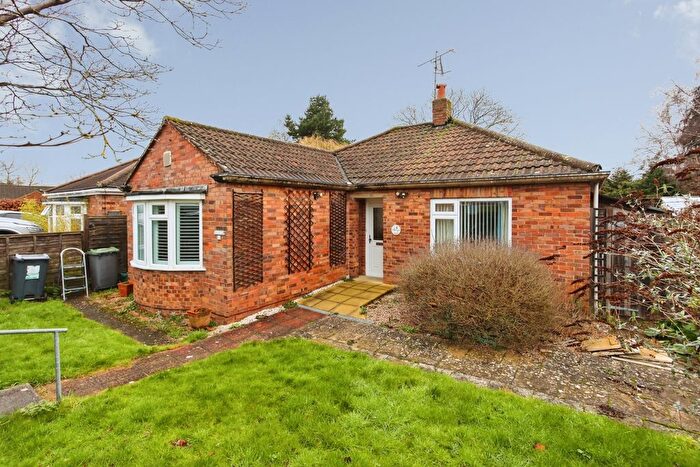
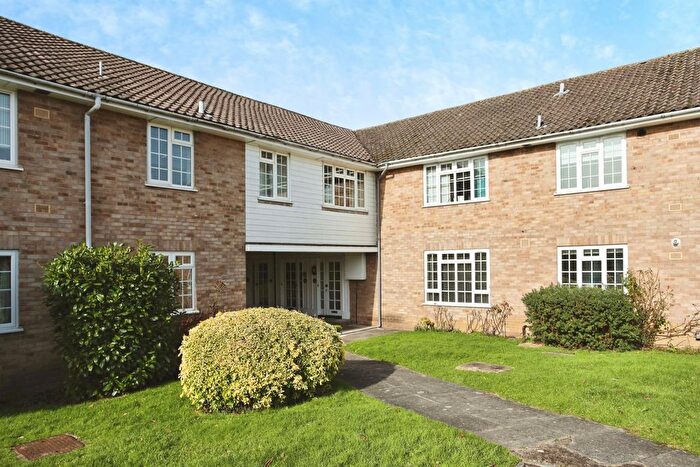
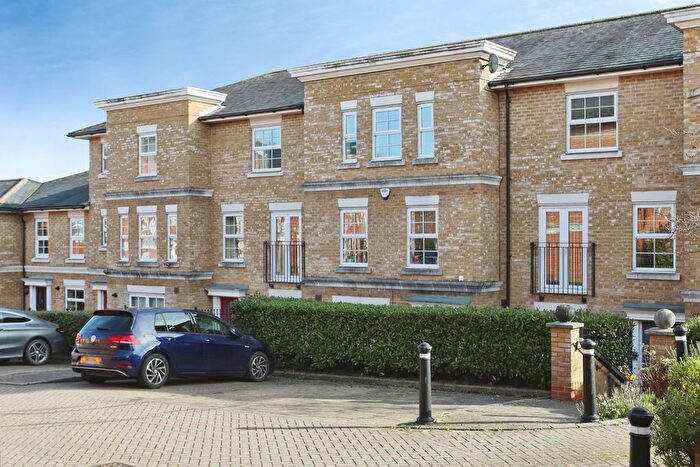
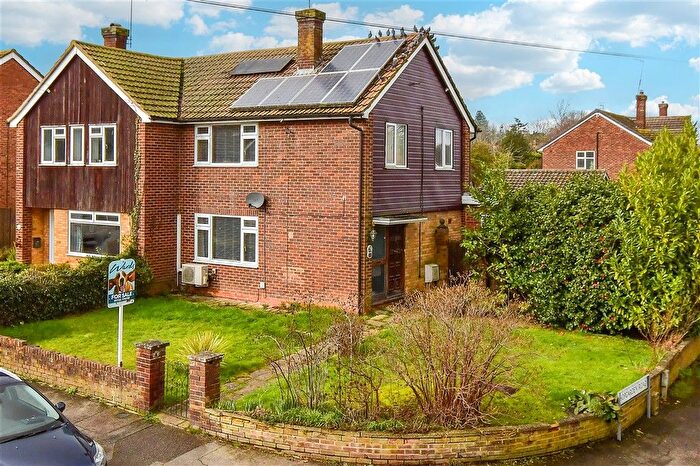
Properties in Cage Green have an average house price of £554,026.00 and had 114 Property Transactions within the last 3 years¹.
Cage Green is an area in Tonbridge, Kent with 1,739 households², where the most expensive property was sold for £1,420,000.00.
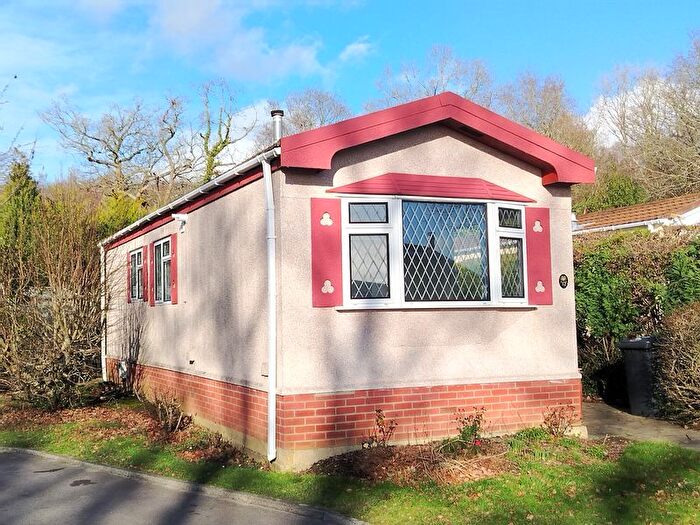
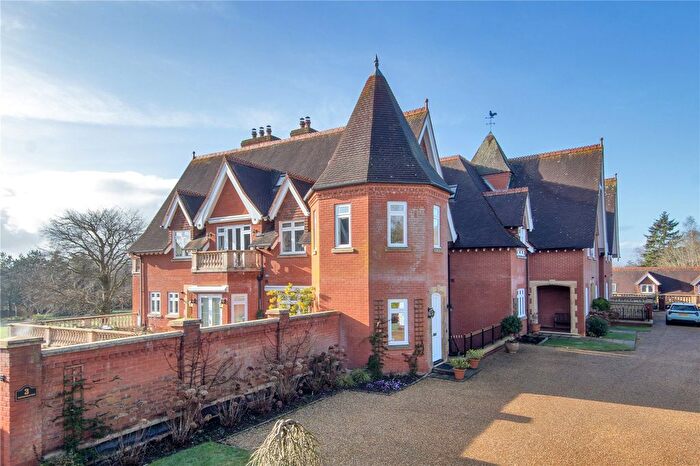
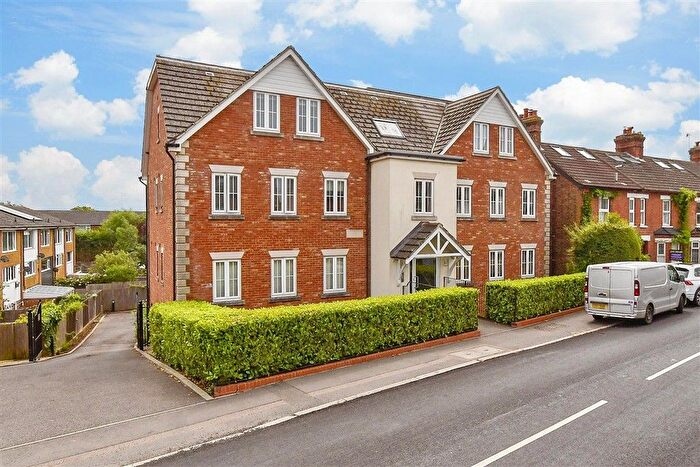
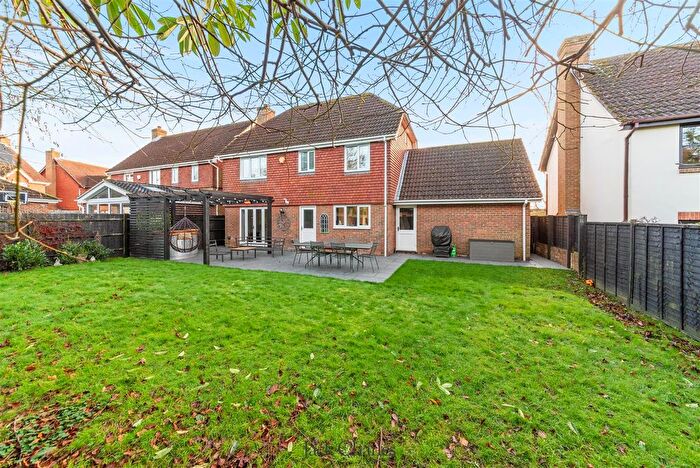
Properties for sale in Cage Green
Previously listed properties in Cage Green
Roads and Postcodes in Cage Green
Navigate through our locations to find the location of your next house in Cage Green, Tonbridge for sale or to rent.
| Streets | Postcodes |
|---|---|
| Ashden Walk | TN10 3RJ TN10 3RL |
| Cage Green Road | TN10 4PS TN10 4PT |
| Canterbury Crescent | TN10 4QP |
| Cavendish Close | TN10 4RJ |
| Chestnuts Close | TN11 9NF |
| Cornfield Way | TN10 3PT |
| Coventry Road | TN10 4QA TN10 4QB TN10 4QD TN10 4QE TN10 4QF |
| Darwin Drive | TN10 4SA TN10 4SB TN10 4SD |
| Delarue Close | TN11 9NN |
| Denbeigh Drive | TN10 3PN TN10 3PP TN10 3PR TN10 3PS TN10 3PW |
| Elmshurst Gardens | TN10 3QT TN10 3QU TN10 3QX TN10 3QY TN10 3QZ TN10 3RA |
| Ely Gardens | TN10 4NZ |
| Exeter Close | TN10 4NS TN10 4NT |
| Faraday Ride | TN10 4RL |
| Fernholt | TN10 3RH |
| Fleming Way | TN10 4RU TN10 4RX |
| Gilbert Close | TN10 4BF |
| Harvest Road | TN10 3PH |
| Helen Keller Close | TN10 4NY |
| Higham Lane | TN11 9QX |
| Horns Lodge | TN11 9NH |
| Howard Drive | TN10 4AQ TN10 4AY |
| Kelvin Close | TN10 4RN |
| Newton Avenue | TN10 4RP TN10 4RR |
| Norwich Avenue | TN10 4QJ TN10 4QN |
| Pippins Close | TN10 4PF |
| Priestley Drive | TN10 4RS TN10 4RT |
| Ridgeway Crescent | TN10 4NP TN10 4NR |
| Rochester Road | TN10 4NU |
| Rowan Shaw | TN10 3QA TN10 3QB |
| Royal West Kent Avenue | TN10 4NX |
| Rutherford Way | TN10 4RH |
| Salisbury Road | TN10 4PA TN10 4PE |
| Shandon Close | TN11 9AY |
| Shipbourne Road | TN10 3ER TN10 3EU TN10 3EY TN10 3RP TN10 3RR TN11 9NL |
| Springwood Park | TN11 9LZ |
| St Pauls Close | TN10 4QG |
| Streamside | TN10 3PU |
| The Ridgeway | TN10 4NH TN10 4NJ TN10 4NL TN10 4NQ TN10 4NN |
| Thorpe Avenue | TN10 4PP TN10 4PR TN10 4PW |
| Town Acres | TN10 4NG |
| Towngate Wood Park | TN10 3RS TN10 3RT |
| Truro Walk | TN10 4QH |
| Wells Close | TN10 4NW |
| Wheatsheaf Way | TN10 3PJ TN10 3PL |
| Whistler Road | TN10 4RD TN10 4RE TN10 4RF TN10 4RG TN10 4RQ |
| White Cottage Road | TN10 4PU TN10 4PX |
| Willow Lea | TN10 3RD TN10 3RE TN10 3RF TN10 3RG TN10 3RQ |
| Winchester Road | TN10 4PH |
| York Road | TN10 4QR |
Transport near Cage Green
- FAQ
- Price Paid By Year
- Property Type Price
Frequently asked questions about Cage Green
What is the average price for a property for sale in Cage Green?
The average price for a property for sale in Cage Green is £554,026. This amount is 15% higher than the average price in Tonbridge. There are 620 property listings for sale in Cage Green.
What streets have the most expensive properties for sale in Cage Green?
The streets with the most expensive properties for sale in Cage Green are Delarue Close at an average of £1,420,000, Rochester Road at an average of £1,150,000 and Ely Gardens at an average of £990,250.
What streets have the most affordable properties for sale in Cage Green?
The streets with the most affordable properties for sale in Cage Green are Howard Drive at an average of £98,125, Coventry Road at an average of £368,142 and Faraday Ride at an average of £390,000.
Which train stations are available in or near Cage Green?
Some of the train stations available in or near Cage Green are Tonbridge, Hildenborough and Leigh (Kent).
Property Price Paid in Cage Green by Year
The average sold property price by year was:
| Year | Average Sold Price | Price Change |
Sold Properties
|
|---|---|---|---|
| 2025 | £616,304 | 20% |
41 Properties |
| 2024 | £492,795 | -13% |
44 Properties |
| 2023 | £558,879 | -32% |
29 Properties |
| 2022 | £736,786 | 25% |
55 Properties |
| 2021 | £553,638 | -3% |
63 Properties |
| 2020 | £571,404 | 21% |
47 Properties |
| 2019 | £449,298 | -12% |
36 Properties |
| 2018 | £503,071 | -23% |
42 Properties |
| 2017 | £621,274 | 29% |
43 Properties |
| 2016 | £442,868 | 10% |
40 Properties |
| 2015 | £398,544 | 10% |
51 Properties |
| 2014 | £359,308 | -7% |
53 Properties |
| 2013 | £383,169 | 5% |
48 Properties |
| 2012 | £363,630 | 1% |
46 Properties |
| 2011 | £361,126 | -7% |
43 Properties |
| 2010 | £386,123 | 24% |
37 Properties |
| 2009 | £295,031 | -23% |
32 Properties |
| 2008 | £361,722 | 8% |
27 Properties |
| 2007 | £331,041 | 0,2% |
63 Properties |
| 2006 | £330,463 | 12% |
98 Properties |
| 2005 | £290,450 | -9% |
51 Properties |
| 2004 | £317,264 | 19% |
52 Properties |
| 2003 | £256,932 | 12% |
46 Properties |
| 2002 | £225,813 | 7% |
67 Properties |
| 2001 | £209,513 | 2% |
63 Properties |
| 2000 | £204,807 | -4% |
46 Properties |
| 1999 | £212,498 | 5% |
41 Properties |
| 1998 | £200,870 | -13% |
60 Properties |
| 1997 | £226,379 | 45% |
49 Properties |
| 1996 | £125,454 | 12% |
58 Properties |
| 1995 | £110,220 | - |
45 Properties |
Property Price per Property Type in Cage Green
Here you can find historic sold price data in order to help with your property search.
The average Property Paid Price for specific property types in the last three years are:
| Property Type | Average Sold Price | Sold Properties |
|---|---|---|
| Semi Detached House | £478,250.00 | 56 Semi Detached Houses |
| Detached House | £701,347.00 | 46 Detached Houses |
| Terraced House | £405,416.00 | 6 Terraced Houses |
| Flat | £280,416.00 | 6 Flats |

