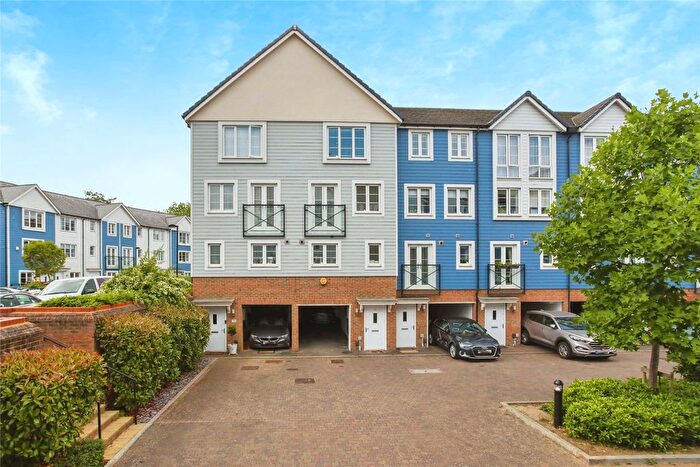
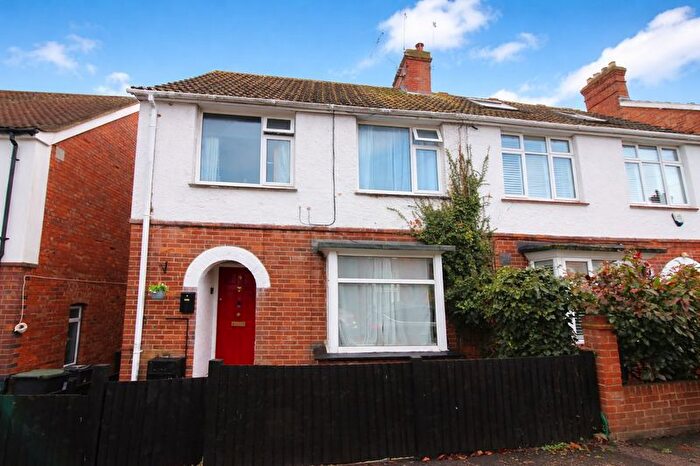
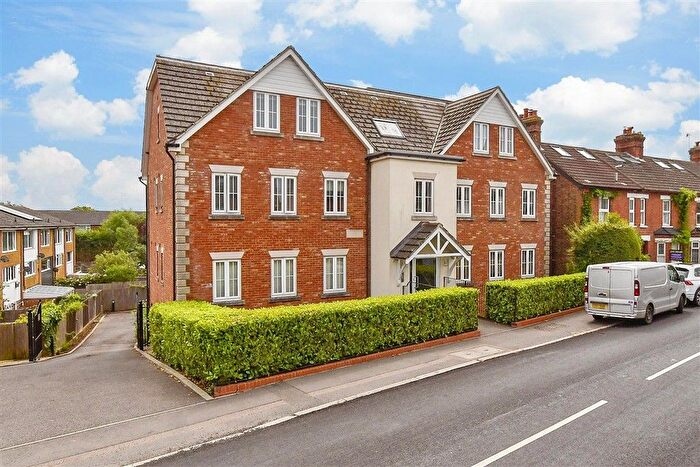
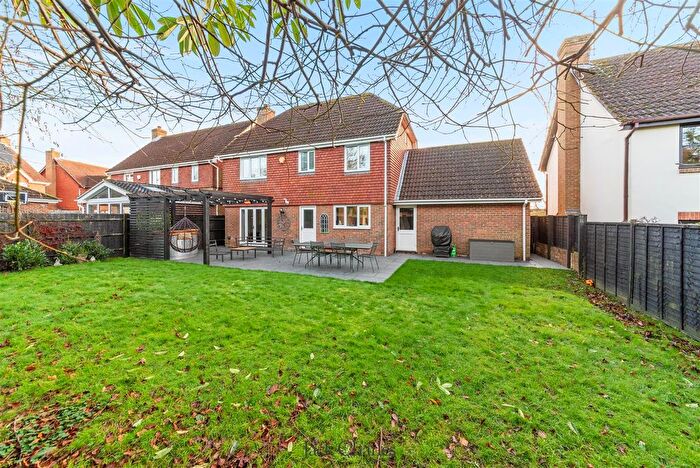
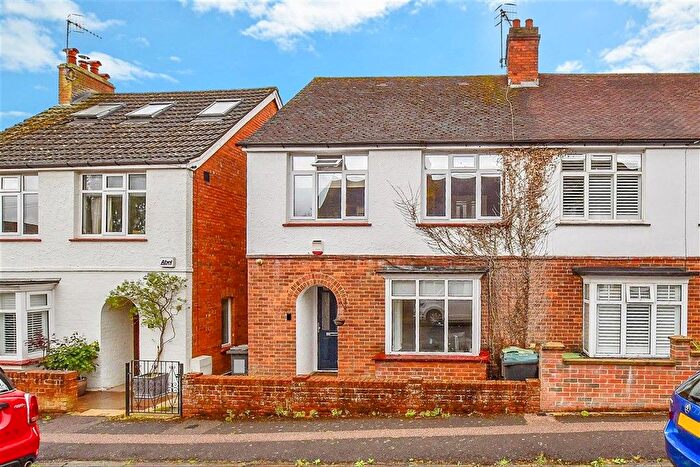
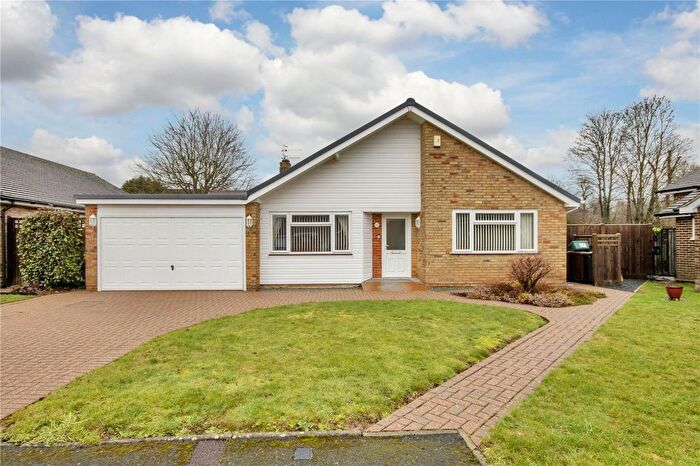
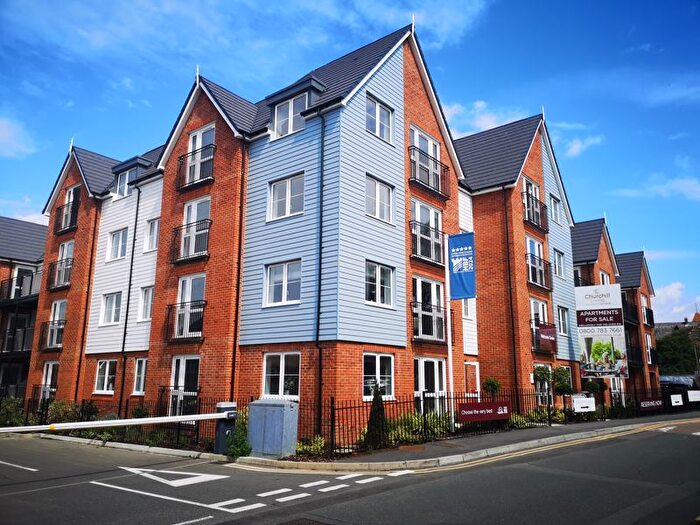
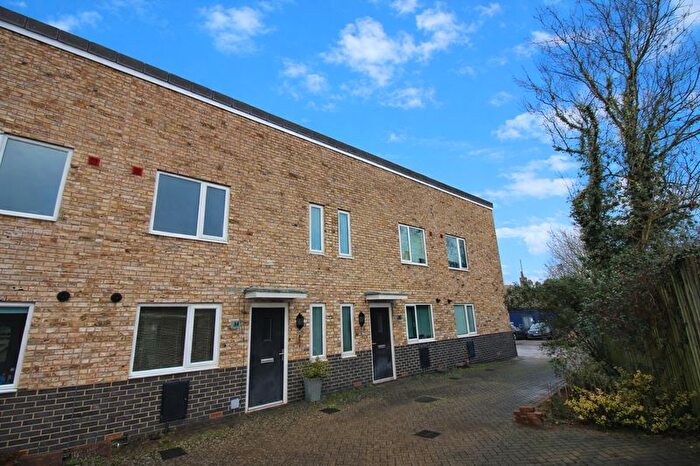
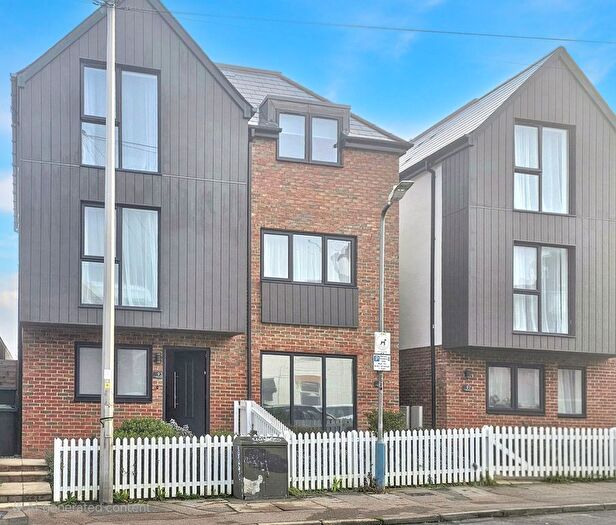
Houses for sale & to rent in Castle, Tonbridge
House Prices in Castle
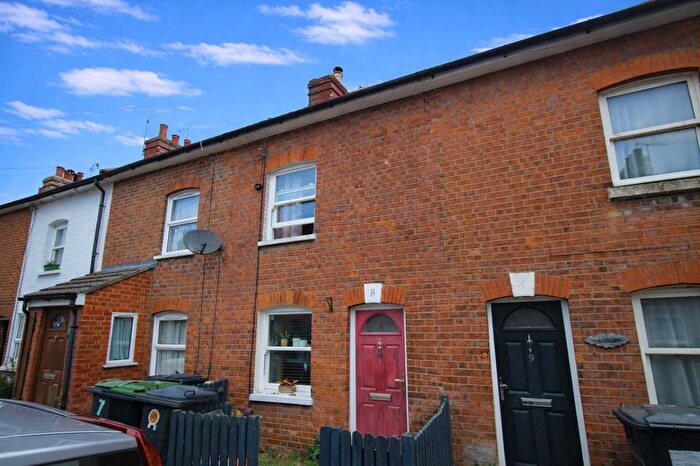
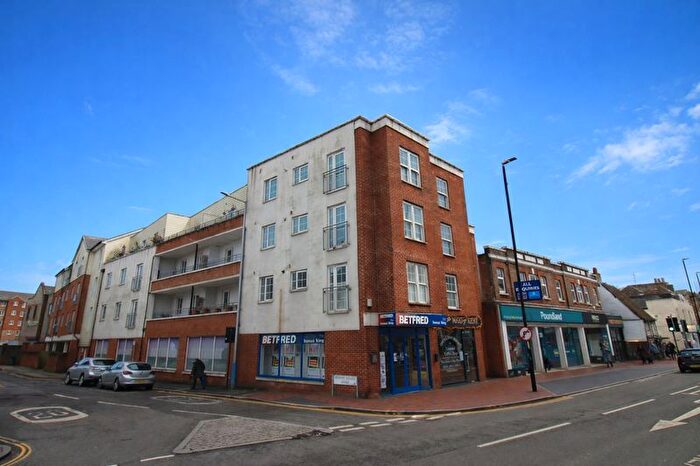
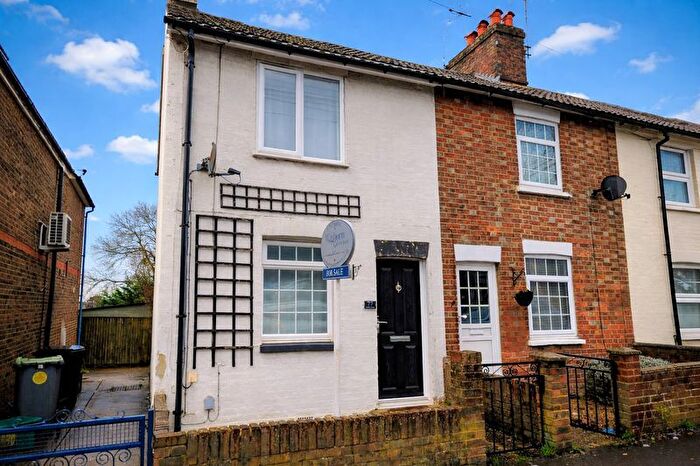
Properties in Castle have an average house price of £483,625.00 and had 219 Property Transactions within the last 3 years¹.
Castle is an area in Tonbridge, Kent with 2,045 households², where the most expensive property was sold for £1,720,000.00.
Properties for sale in Castle
Previously listed properties in Castle
Roads and Postcodes in Castle
Navigate through our locations to find the location of your next house in Castle, Tonbridge for sale or to rent.
Transport near Castle
- FAQ
- Price Paid By Year
- Property Type Price
Frequently asked questions about Castle
What is the average price for a property for sale in Castle?
The average price for a property for sale in Castle is £483,625. This amount is 0.2% higher than the average price in Tonbridge. There are 1,276 property listings for sale in Castle.
What streets have the most expensive properties for sale in Castle?
The streets with the most expensive properties for sale in Castle are Dry Hill Park Crescent at an average of £1,550,000, The Haydens at an average of £1,141,250 and Yardley Park Road at an average of £1,055,721.
What streets have the most affordable properties for sale in Castle?
The streets with the most affordable properties for sale in Castle are Havelock Road at an average of £218,000, Avebury Avenue at an average of £243,242 and Castle Fields at an average of £246,250.
Which train stations are available in or near Castle?
Some of the train stations available in or near Castle are Tonbridge, Hildenborough and Leigh (Kent).
Property Price Paid in Castle by Year
The average sold property price by year was:
| Year | Average Sold Price | Price Change |
Sold Properties
|
|---|---|---|---|
| 2025 | £472,811 | -6% |
68 Properties |
| 2024 | £499,327 | 4% |
78 Properties |
| 2023 | £476,921 | 6% |
73 Properties |
| 2022 | £448,473 | -8% |
90 Properties |
| 2021 | £485,753 | 10% |
128 Properties |
| 2020 | £437,682 | 2% |
72 Properties |
| 2019 | £428,465 | 5% |
86 Properties |
| 2018 | £408,038 | -8% |
83 Properties |
| 2017 | £439,772 | 17% |
85 Properties |
| 2016 | £362,975 | -7% |
93 Properties |
| 2015 | £389,010 | 4% |
101 Properties |
| 2014 | £372,559 | 16% |
132 Properties |
| 2013 | £314,053 | -12% |
100 Properties |
| 2012 | £351,737 | 13% |
76 Properties |
| 2011 | £307,428 | -8% |
88 Properties |
| 2010 | £333,105 | 18% |
74 Properties |
| 2009 | £272,017 | -7% |
75 Properties |
| 2008 | £291,795 | -6% |
59 Properties |
| 2007 | £308,109 | 14% |
128 Properties |
| 2006 | £263,859 | 12% |
130 Properties |
| 2005 | £232,611 | 0,1% |
101 Properties |
| 2004 | £232,283 | 5% |
101 Properties |
| 2003 | £220,344 | 18% |
76 Properties |
| 2002 | £180,855 | 10% |
95 Properties |
| 2001 | £163,074 | 7% |
114 Properties |
| 2000 | £151,057 | 13% |
97 Properties |
| 1999 | £131,367 | 21% |
95 Properties |
| 1998 | £103,179 | -7% |
84 Properties |
| 1997 | £110,506 | 17% |
85 Properties |
| 1996 | £92,177 | -2% |
88 Properties |
| 1995 | £94,472 | - |
94 Properties |
Property Price per Property Type in Castle
Here you can find historic sold price data in order to help with your property search.
The average Property Paid Price for specific property types in the last three years are:
| Property Type | Average Sold Price | Sold Properties |
|---|---|---|
| Semi Detached House | £520,889.00 | 38 Semi Detached Houses |
| Detached House | £894,500.00 | 43 Detached Houses |
| Terraced House | £392,205.00 | 62 Terraced Houses |
| Flat | £307,104.00 | 76 Flats |

