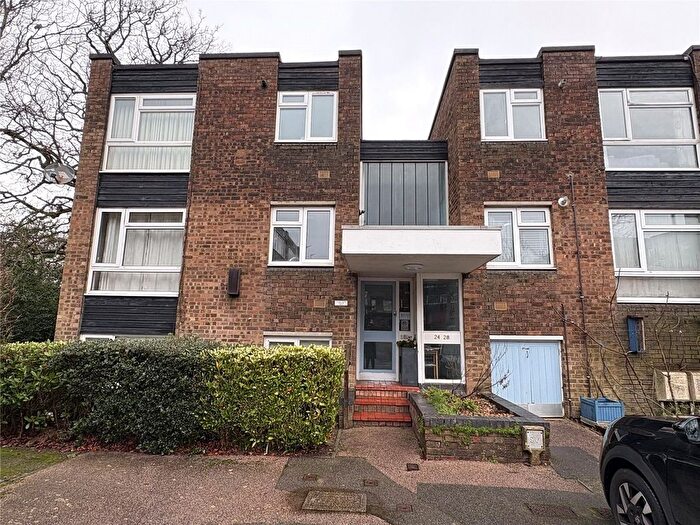
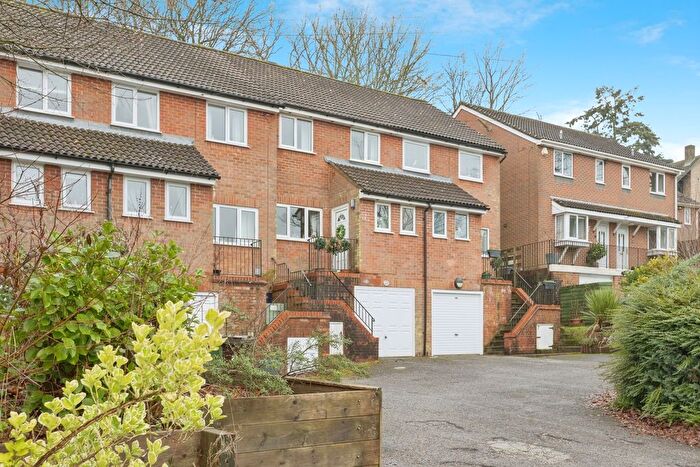
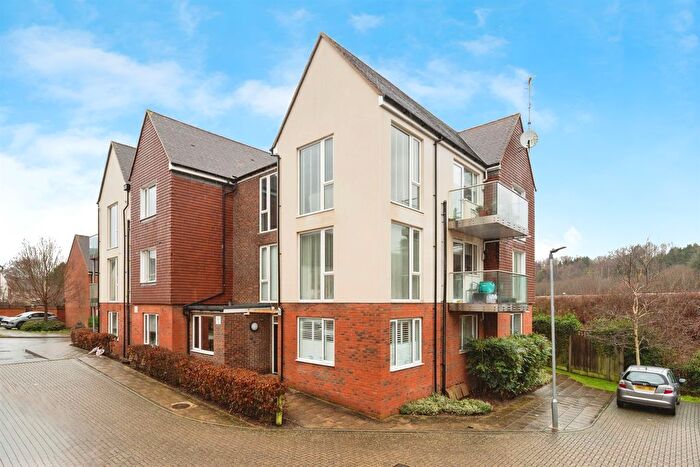
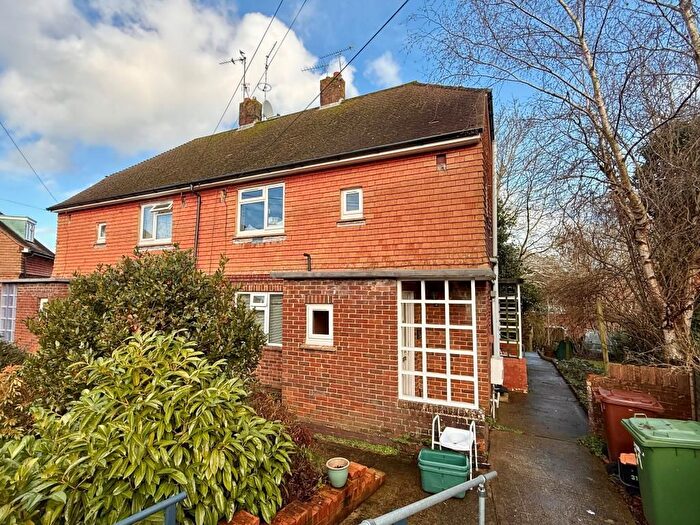
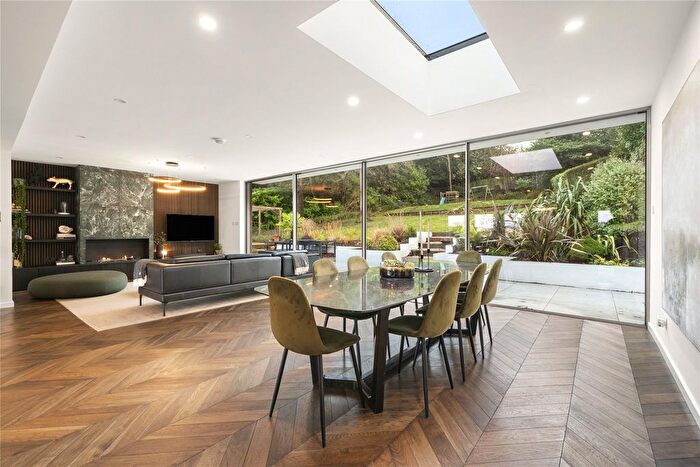
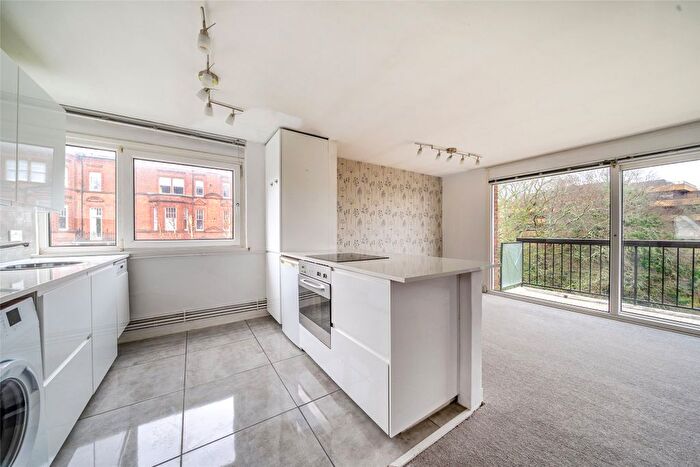
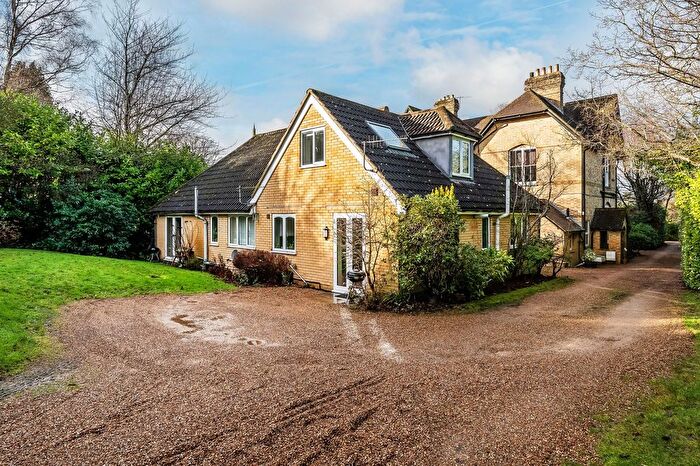
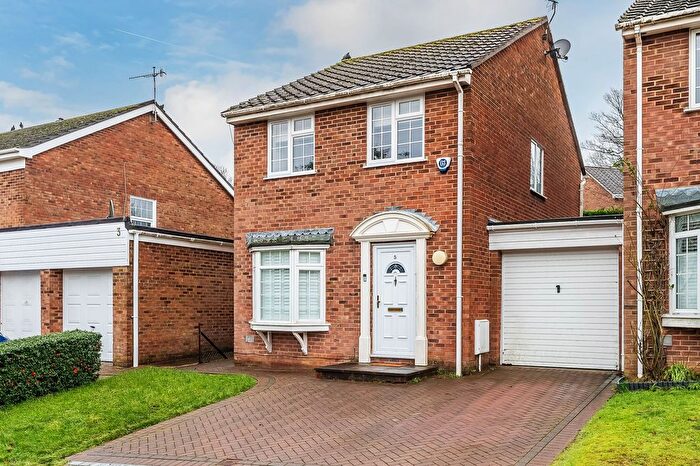
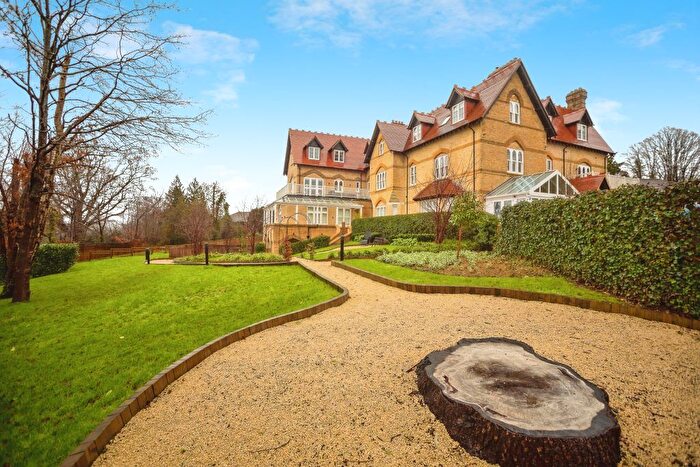
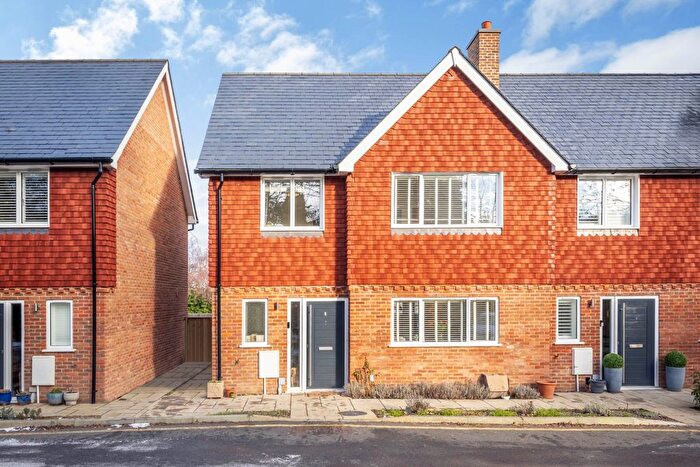
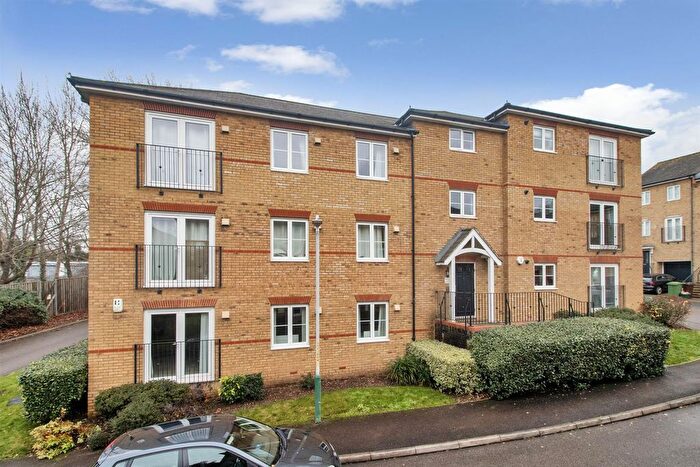
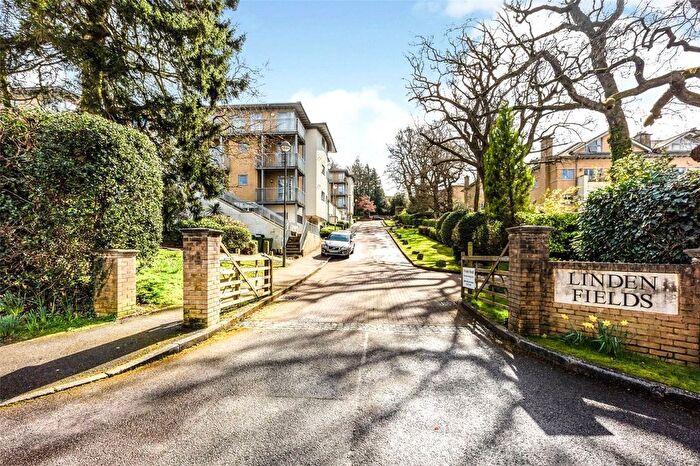
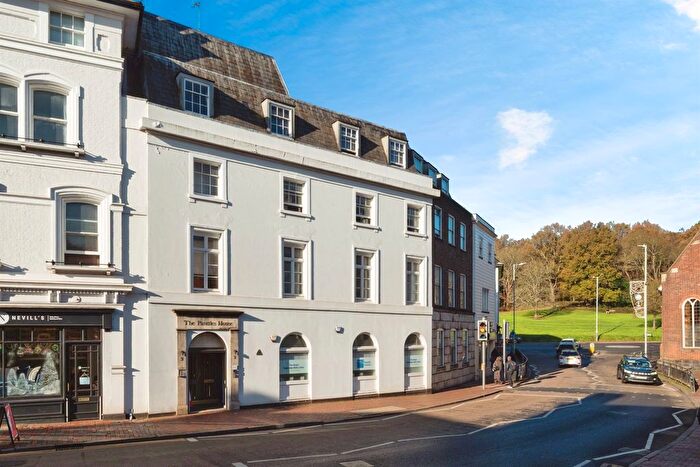
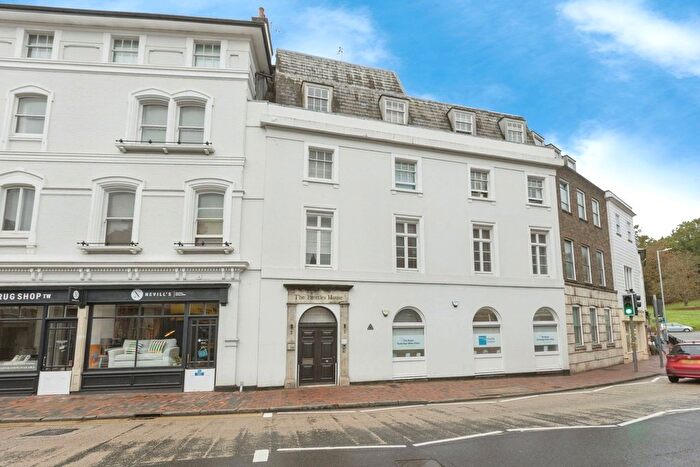
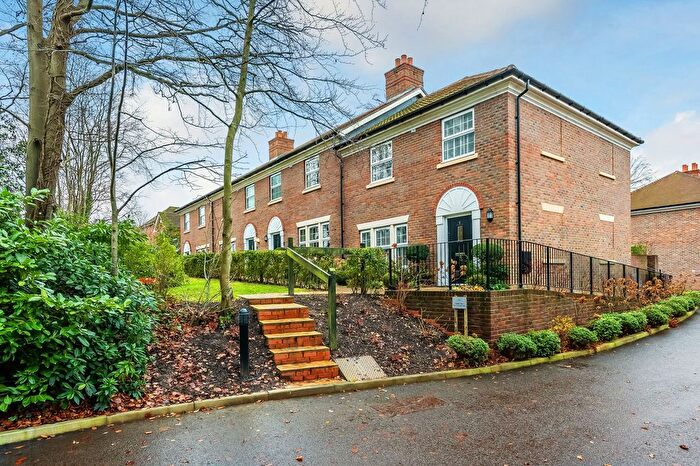
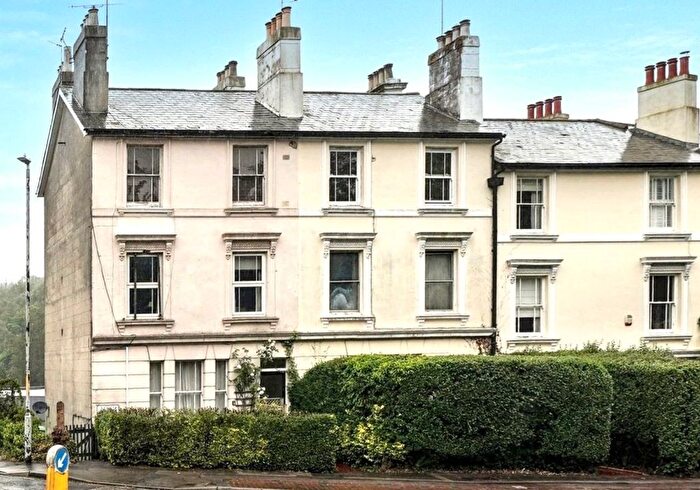
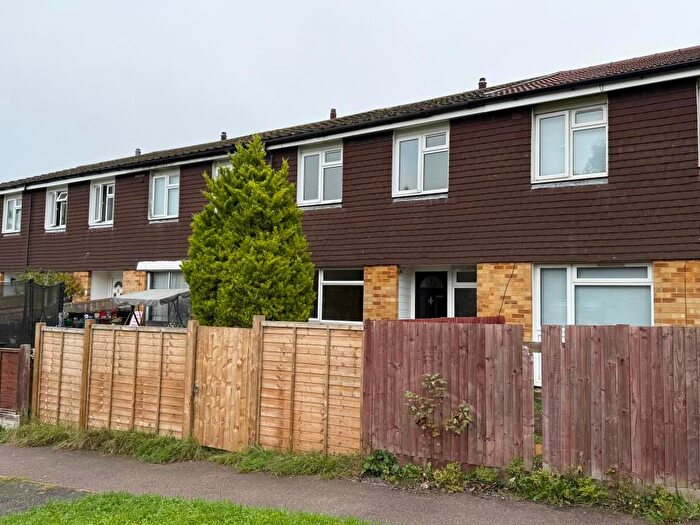
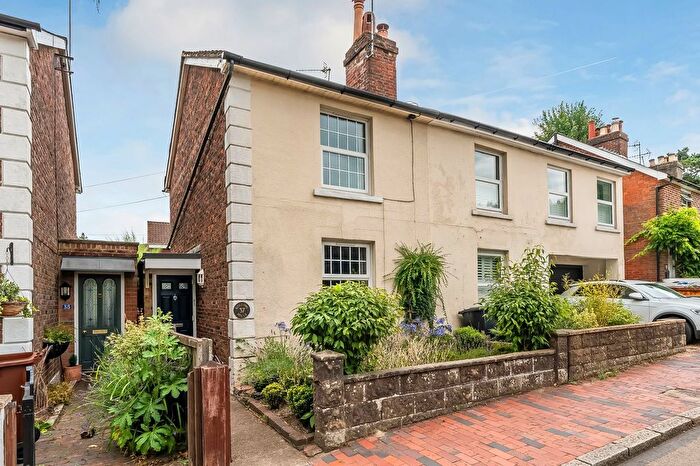
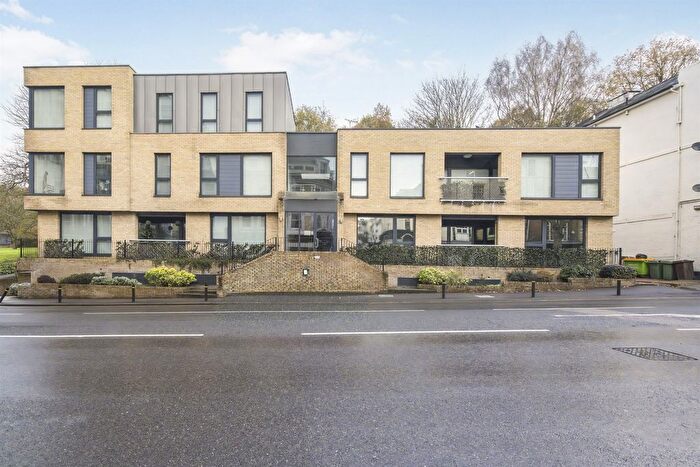
Houses for sale & to rent in Broadwater, Tunbridge Wells
House Prices in Broadwater
Properties in Broadwater have an average house price of £610,268.00 and had 149 Property Transactions within the last 3 years¹.
Broadwater is an area in Tunbridge Wells, Kent with 1,957 households², where the most expensive property was sold for £7,450,000.00.
Properties for sale in Broadwater
Previously listed properties in Broadwater
Roads and Postcodes in Broadwater
Navigate through our locations to find the location of your next house in Broadwater, Tunbridge Wells for sale or to rent.
| Streets | Postcodes |
|---|---|
| Broad Oak Close | TN2 5UF |
| Broadcroft | TN2 5UG |
| Broadmead | TN2 5NE TN2 5NN TN2 5NW TN2 5RH TN2 5RL TN2 5RN TN2 5RW |
| Broadmead Avenue | TN2 5PG |
| Broadwater Court | TN2 5PB |
| Broadwater Down | TN2 5NG TN2 5NR TN2 5NX TN2 5PE TN2 5FP |
| Broadwater Lane | TN2 5RB TN2 5RP TN2 5RD TN2 5RE TN2 5RT |
| Broadwater Rise | TN2 5UD TN2 5UE |
| Cabbage Stalk Lane | TN4 8NG |
| Castle Road | TN4 8BY |
| Charltons Way | TN4 8JS TN4 8JT |
| Cherry Tree Road | TN2 5QA TN2 5FH |
| Cobbetts Ride | TN2 5QG |
| Crawford Close | TN4 8EU TN4 8EW |
| Devonshire Close | TN2 5PQ |
| Eastlands Close | TN4 8JU TN4 8JX |
| Eastlands Road | TN4 8JR TN4 8JY TN4 8JP |
| Eridge Road | TN4 8HJ TN4 8HR TN4 8HS TN4 8HT TN4 8LX TN3 9ET TN4 8HN |
| Essex Close | TN2 5RQ |
| Fir Tree Road | TN4 8AH |
| Friezland Road | TN4 8LH TN4 8LJ |
| Furnival Court | TN2 5PF |
| Glenmore Park | TN2 5NZ |
| High Rocks Lane | TN4 8FR |
| Hungershall Park | TN4 8ND TN4 8NE |
| Hungershall Park Close | TN4 8NH |
| Hunters Way | TN2 5QE TN2 5QF TN2 5QD |
| Kentish Gardens | TN2 5XU |
| Langton Road | TN4 8XA TN4 8XD |
| Leicester Drive | TN2 5PH |
| Leneda Drive | TN2 5RJ |
| London Road | TN1 1DE |
| Major Yorks Road | TN2 5TP TN4 8NY |
| Nevill Park | TN4 8NN TN4 8NW |
| Nevill Terrace | TN2 5QY |
| Nottidge Road | TN4 8LP |
| Ramslye Road | TN4 8LA TN4 8LL TN4 8LN TN4 8LR TN4 8LS TN4 8LT TN4 8LU |
| Ropers Gate | TN4 8JE |
| Rowan Tree Road | TN2 5PX TN2 5PY TN2 5PZ |
| Rusthall Place | TN4 8XB |
| Saunders Road | TN4 8LB |
| School Rise | TN2 5TQ |
| Scotts Way | TN2 5RG |
| Showfields Road | TN2 5PL TN2 5PN TN2 5PP TN2 5PW TN2 5UN TN2 5PR |
| Sidney Close | TN2 5QQ |
| Spa Crescent | TN4 8FB |
| Spring Walk | TN4 8EH TN4 8EQ |
| Strawberry Close | TN2 5PD |
| Stuart Close | TN2 5PJ |
| Summervale Road | TN4 8JA TN4 8JB TN4 8JD TN4 8JG TN4 8JH TN4 8JJ TN4 8JL TN4 8JN TN4 8JQ TN4 8JW |
| Surrey Close | TN2 5RF |
| Tea Garden Lane | TN3 9JH |
| The Common | TN1 1EB TN4 8BX TN4 8NB TN4 8NA TN4 8YU |
| The Crossway | TN4 8NL |
| The Goodwins | TN2 5RS |
| The Midway | TN4 8NJ |
| Tudor Court | TN2 5QH |
| Underwood Rise | TN2 5RY |
| Waterdown Road | TN4 8LD TN4 8LE TN4 8LF TN4 8LG |
| Willow Tree Road | TN2 5PS TN2 5PT TN2 5PU |
| Wood Mews | TN4 8DF |
Transport near Broadwater
- FAQ
- Price Paid By Year
- Property Type Price
Frequently asked questions about Broadwater
What is the average price for a property for sale in Broadwater?
The average price for a property for sale in Broadwater is £610,268. This amount is 15% higher than the average price in Tunbridge Wells. There are 648 property listings for sale in Broadwater.
What streets have the most expensive properties for sale in Broadwater?
The streets with the most expensive properties for sale in Broadwater are The Midway at an average of £4,687,500, Nevill Park at an average of £2,374,367 and Broadcroft at an average of £1,020,000.
What streets have the most affordable properties for sale in Broadwater?
The streets with the most affordable properties for sale in Broadwater are The Goodwins at an average of £171,000, Spa Crescent at an average of £205,166 and Showfields Road at an average of £215,000.
Which train stations are available in or near Broadwater?
Some of the train stations available in or near Broadwater are Tunbridge Wells, High Brooms and Frant.
Property Price Paid in Broadwater by Year
The average sold property price by year was:
| Year | Average Sold Price | Price Change |
Sold Properties
|
|---|---|---|---|
| 2025 | £723,013 | 11% |
38 Properties |
| 2024 | £643,778 | 21% |
52 Properties |
| 2023 | £508,117 | -1% |
59 Properties |
| 2022 | £513,737 | -6% |
91 Properties |
| 2021 | £546,232 | -22% |
99 Properties |
| 2020 | £664,879 | 27% |
54 Properties |
| 2019 | £482,250 | -6% |
65 Properties |
| 2018 | £512,333 | 15% |
65 Properties |
| 2017 | £433,604 | -9% |
58 Properties |
| 2016 | £470,968 | 3% |
47 Properties |
| 2015 | £457,486 | 36% |
71 Properties |
| 2014 | £293,839 | 1% |
88 Properties |
| 2013 | £291,815 | 5% |
76 Properties |
| 2012 | £277,009 | -42% |
52 Properties |
| 2011 | £394,410 | -5% |
62 Properties |
| 2010 | £412,496 | 13% |
60 Properties |
| 2009 | £359,503 | 20% |
62 Properties |
| 2008 | £286,472 | -5% |
64 Properties |
| 2007 | £301,758 | 8% |
121 Properties |
| 2006 | £278,855 | -1% |
91 Properties |
| 2005 | £280,276 | 12% |
71 Properties |
| 2004 | £246,726 | 22% |
110 Properties |
| 2003 | £191,431 | -15% |
77 Properties |
| 2002 | £221,022 | 18% |
95 Properties |
| 2001 | £180,716 | 22% |
105 Properties |
| 2000 | £140,229 | 5% |
84 Properties |
| 1999 | £133,778 | 18% |
98 Properties |
| 1998 | £109,399 | -5% |
73 Properties |
| 1997 | £114,553 | 18% |
87 Properties |
| 1996 | £94,112 | -13% |
66 Properties |
| 1995 | £105,914 | - |
53 Properties |
Property Price per Property Type in Broadwater
Here you can find historic sold price data in order to help with your property search.
The average Property Paid Price for specific property types in the last three years are:
| Property Type | Average Sold Price | Sold Properties |
|---|---|---|
| Semi Detached House | £443,384.00 | 26 Semi Detached Houses |
| Detached House | £1,378,654.00 | 36 Detached Houses |
| Terraced House | £452,819.00 | 28 Terraced Houses |
| Flat | £289,685.00 | 59 Flats |

