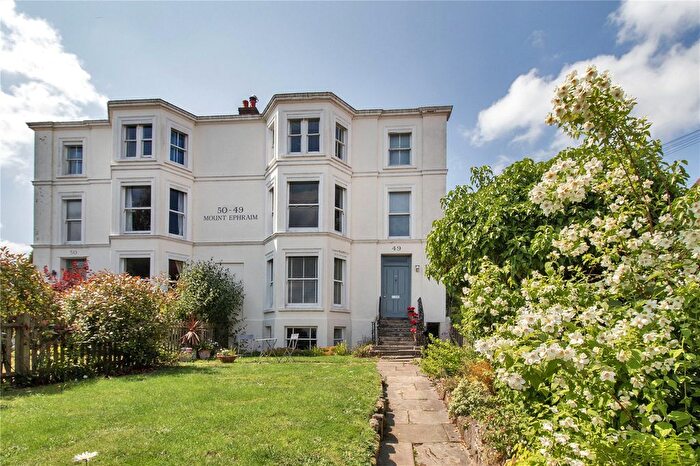
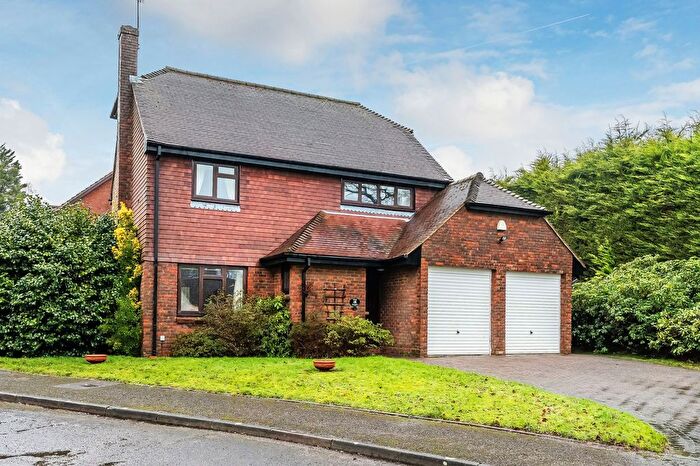
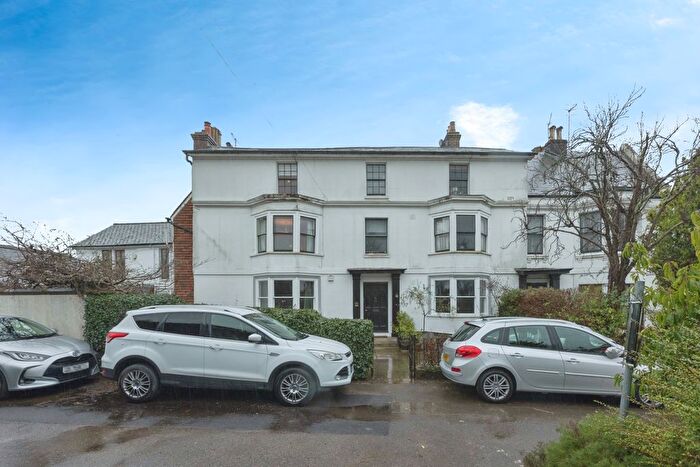
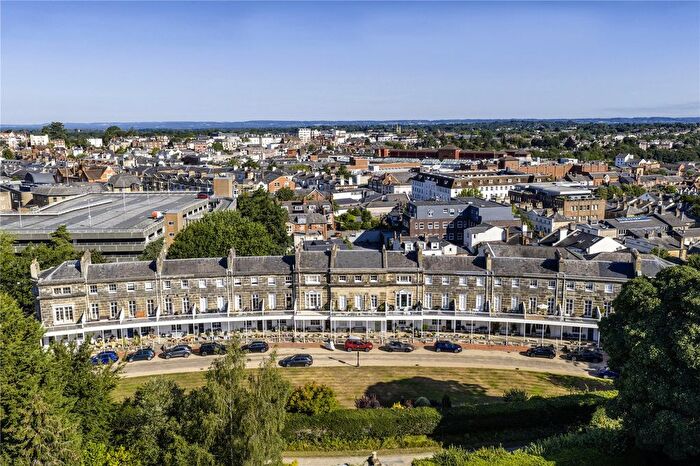
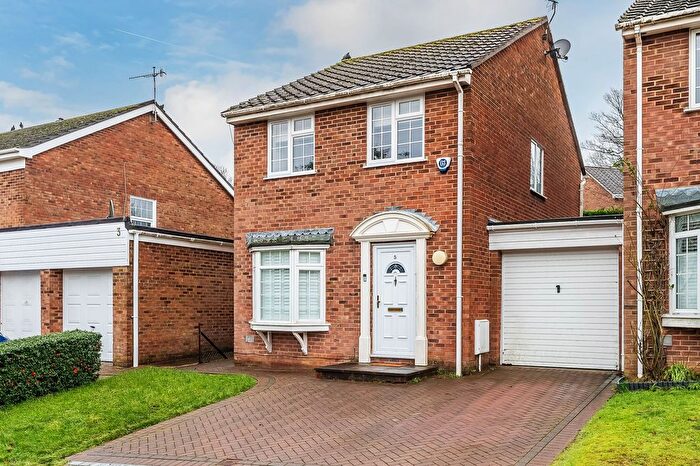
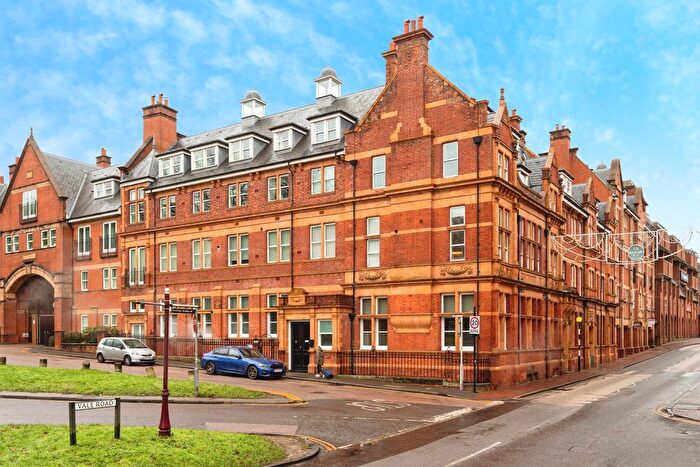
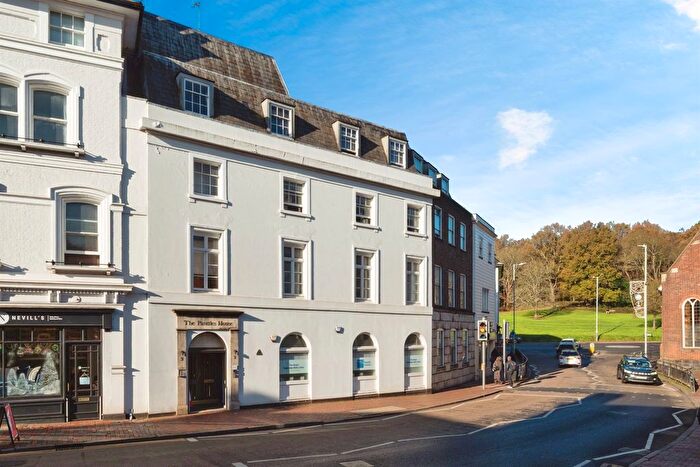
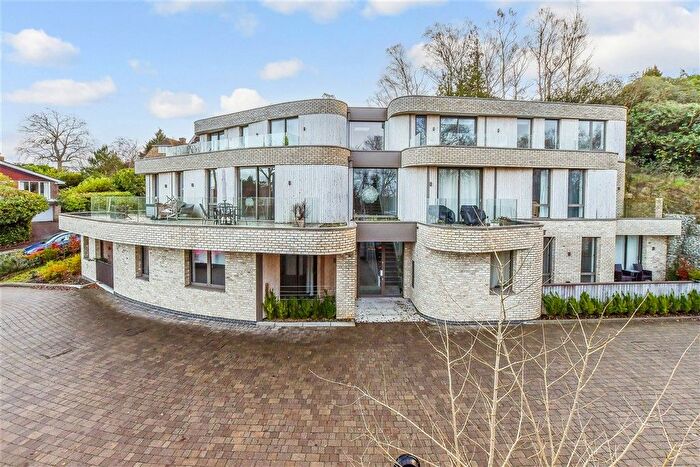
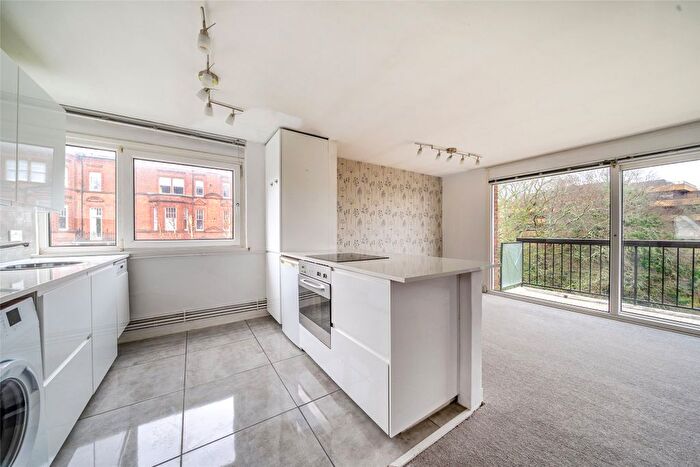
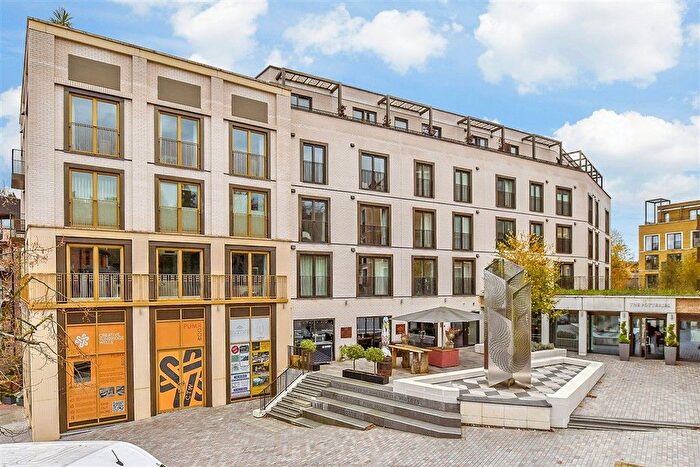
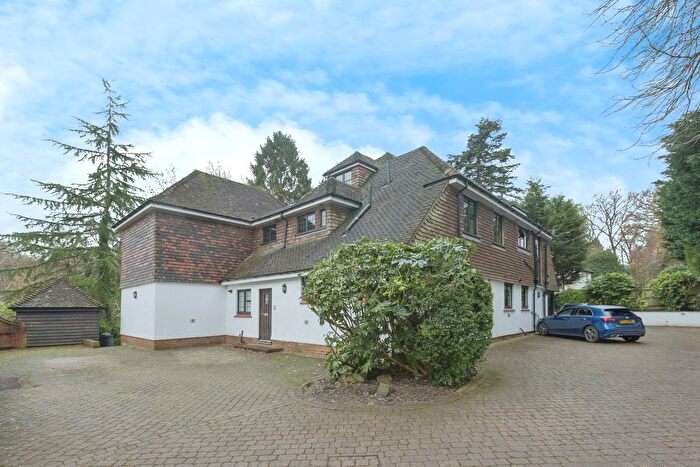
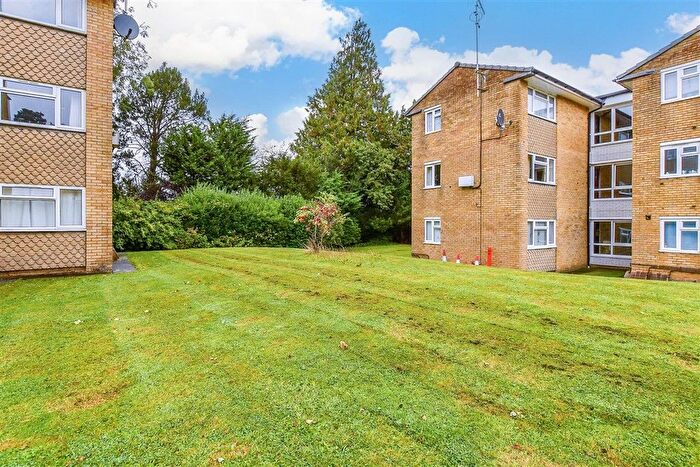
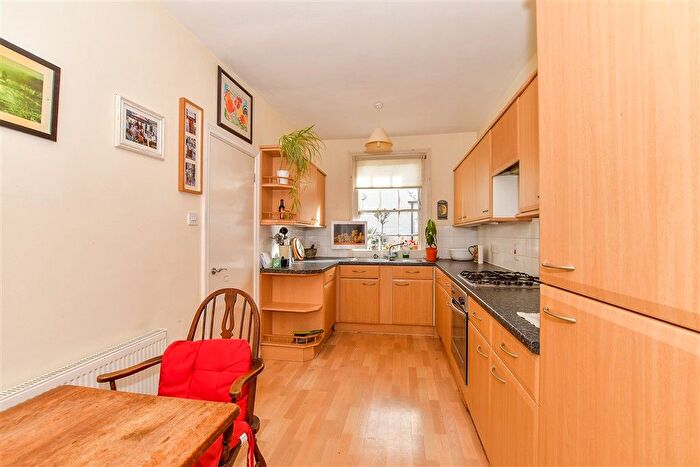
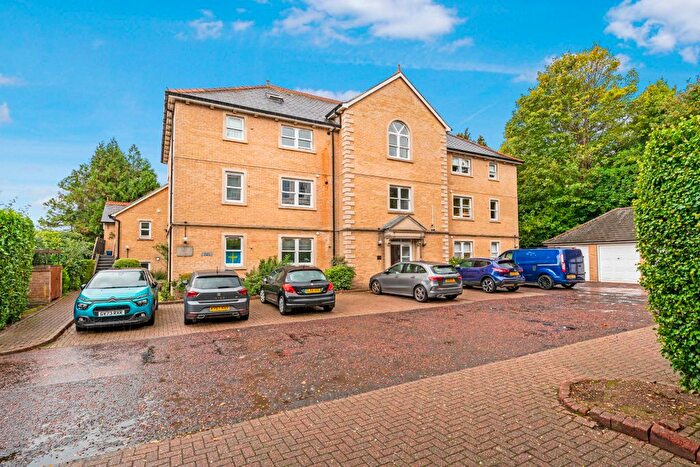
Houses for sale & to rent in Pantiles And St Marks, Tunbridge Wells
House Prices in Pantiles And St Marks
Properties in Pantiles And St Marks have an average house price of £694,044.01 and had 319 Property Transactions within the last 3 years¹.
Pantiles And St Marks is an area in Tunbridge Wells, Kent with 3,014 households², where the most expensive property was sold for £3,325,000.00.
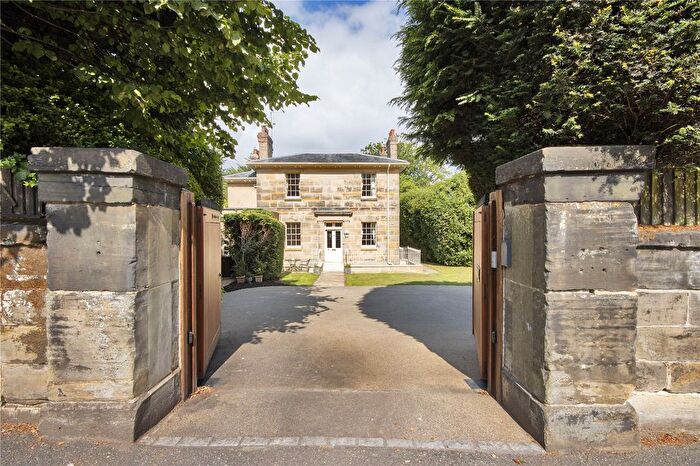
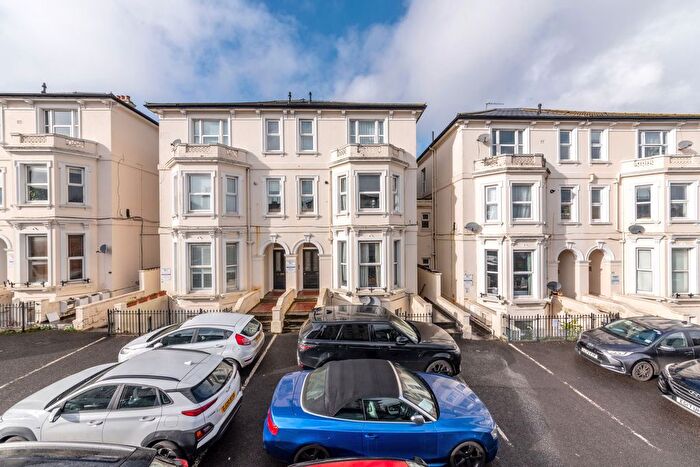
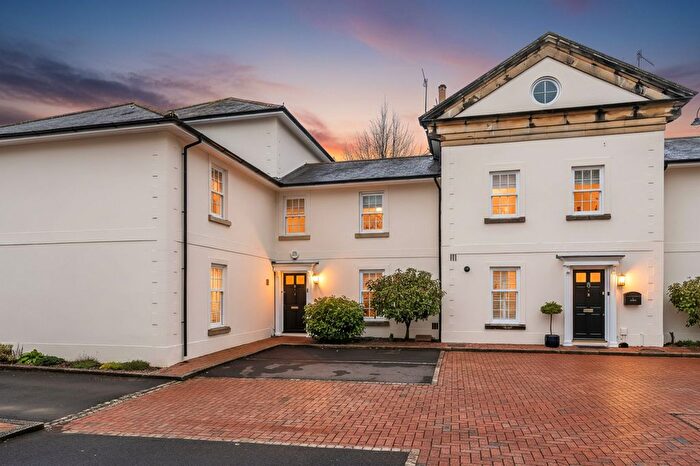
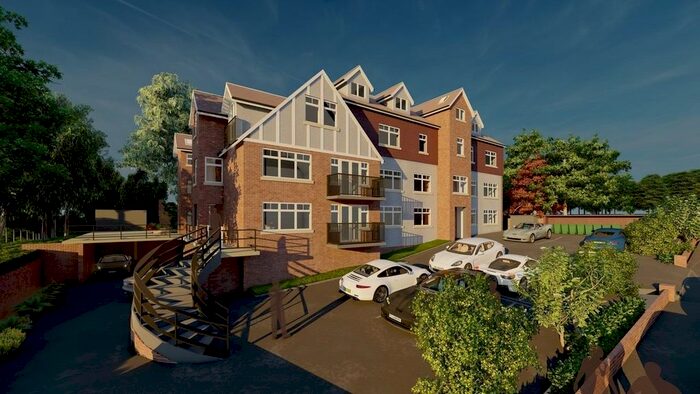
Properties for sale in Pantiles And St Marks
Roads and Postcodes in Pantiles And St Marks
Navigate through our locations to find the location of your next house in Pantiles And St Marks, Tunbridge Wells for sale or to rent.
| Streets | Postcodes |
|---|---|
| Acer Avenue | TN2 5JQ |
| Arundel Road | TN1 1TB |
| Ash Close | TN2 5EW |
| Banner Farm Road | TN2 5EA TN2 5DW TN2 5EB |
| Barnfield | TN2 5XD |
| Bayham Road | TN2 5HP TN2 5HR TN2 5HU TN2 5HX |
| Bedford Terrace | TN1 1YJ |
| Beech Close | TN2 5GB |
| Belgrove | TN1 1YW |
| Benhall Mill Place | TN2 5EE |
| Benhall Mill Road | TN2 5JH TN2 5JJ |
| Berkeley Place | TN1 1YN |
| Berkeley Road | TN1 1YR |
| Birling Drive | TN2 5LG |
| Birling Park Avenue | TN2 5LQ |
| Birling Road | TN2 5LX TN2 5LY TN2 5LZ TN2 5NA TN2 5GR |
| Blatchington Road | TN2 5EG |
| Broad Grove | TN2 5NQ |
| Broadwater Down | TN2 5NJ TN2 5NL TN2 5NU TN2 5NY |
| Brunswick Terrace | TN1 1TR |
| Buckingham Road | TN1 1TQ |
| Cambridge Gardens | TN2 4SB TN2 4SD TN2 4SE |
| Camden Hill | TN2 4TB TN2 4TH TN2 4TJ |
| Camden Park | TN2 5AA TN2 5AD TN2 5BB |
| Castle Street | TN1 1XJ |
| Cavendish Drive | TN2 5DU TN2 5DX TN2 5DY |
| Chapel Place | TN1 1YQ |
| Chenies Close | TN2 5LL TN2 5LN |
| Christchurch Avenue | TN1 1UW |
| Claremont Gardens | TN2 5DD |
| Claremont Road | TN1 1SY TN1 1SZ TN1 1TA TN1 1TE TN1 1TF TN1 1TH |
| Clarendon Gardens | TN2 5LA |
| Clarendon Way | TN2 5LD |
| Clifton Place | TN1 1TL |
| Coach & Horses Passage | TN2 5NP |
| Connaught Place | TN2 5QS |
| Copperfields | TN2 5HZ |
| Cumberland Gardens | TN1 1UQ TN1 1UH |
| Cumberland Mews | TN1 1TU |
| Cumberland Walk | TN1 1UJ |
| Cumberland Yard | TN1 1TY |
| Cypress Grove | TN2 5JR |
| Delves Avenue | TN2 5DP TN2 5DR TN2 5DS |
| Dukes Drive | TN2 5FA |
| Eden Road | TN1 1TS |
| Eden Walk | TN1 1TT |
| Elphicks Place | TN2 5NB |
| Farmcombe Close | TN2 5DG |
| Farmcombe Lane | TN2 5DB |
| Farmcombe Road | TN2 5DE TN2 5DF TN2 5DH TN2 5DJ TN2 5DL TN2 5DQ |
| Forest Road | TN2 5BE TN2 5GY TN2 5HS TN2 5HT TN2 5JA TN2 5JB TN2 5JD TN2 5EY |
| Frankfield Rise | TN2 5LF |
| Frant Road | TN2 5GT TN2 5JT TN2 5LE TN2 5LH TN2 5LJ TN2 5LP TN2 5LR TN2 5SB TN2 5SD TN2 5SE TN2 5SJ TN2 5SN TN2 5LS |
| Frog Lane | TN1 1YT |
| Gloucester Place | TN2 5QW |
| Grecian Road | TN1 1TG |
| Grove Avenue | TN1 1UP |
| Grove Hill Gardens | TN1 1SR TN1 1SS |
| Grove Hill Road | TN1 1ST |
| Harescroft | TN2 5XB TN2 5XE |
| Hargate Close | TN2 5PA |
| High Street | TN1 1UL TN1 1UT TN1 1UX TN1 1XF TN1 1YB TN1 1UU TN1 1XL TN1 1XP TN1 1XU TN1 1XX TN1 1XY TN1 1XZ TN1 1YF TN1 1YG |
| Highgrove | TN2 5NF |
| Hollyshaw Close | TN2 5AB |
| Howard Gardens | TN2 5SL |
| Linden Close | TN4 8HH TN4 8FN TN4 8FP |
| Linden Fields | TN2 5QN |
| Linden Gardens | TN2 5QT TN2 5QU |
| Linden Park Road | TN2 5QL TN2 5QZ TN2 5FQ TN2 5FR TN2 5FS |
| Little Mount Sion | TN1 1YP TN1 1YS |
| London Road | TN1 1BX TN1 1DA TN1 1DB TN1 1DD TN1 1DQ TN2 5BF TN1 1AB TN1 1DG TN1 1DH |
| Madeira Park | TN2 5SU TN2 5SX TN2 5SY TN2 5SZ |
| Maple Close | TN2 5LB |
| Maple Gardens | TN2 5JE TN2 5JL |
| Market Street | TN2 5SQ |
| Moat Farm | TN2 5XA TN2 5XG TN2 5XJ |
| Montacute Gardens | TN4 8HG |
| Montacute Mews | TN2 5NH |
| Montacute Road | TN2 5QP TN2 5QR |
| Mount Sion | TN1 1TJ TN1 1TN TN1 1TW TN1 1TZ TN1 1UA TN1 1UD TN1 1UE TN1 1UF TN1 1US TN2 5DA |
| Nevill Gate | TN2 5ES |
| Nevill Street | TN2 5RU TN2 5SA TN2 5TT |
| Norfolk Road | TN1 1TD |
| Oaktree Close | TN2 5SS |
| Old Gardens Close | TN2 5ND |
| Poona Road | TN1 1SU |
| Redcliffe Place | TN2 5GQ |
| Richmond Place | TN2 5JZ |
| Rodmell Road | TN2 5SR TN2 5ST TN2 5SW |
| Roedean Road | TN2 5JX TN2 5JY |
| Sherbourne Place | TN2 5QX |
| Sion Walk | TN1 1UG |
| South Grove | TN1 1UR |
| Spencer Mews | TN1 1YY |
| St Georges Park | TN2 5NT |
| St Marks Road | TN2 5LT TN2 5LU |
| Sussex Close | TN2 5DT |
| Sussex Mews | TN2 5QJ |
| The Chase | TN2 5DN |
| The Drive | TN2 5ER |
| The Pantiles | TN2 5TD TN2 5TE TN2 5TJ TN2 5TN TN2 5TW |
| The Shaw | TN2 5BD |
| Trinity Mews | TN2 5HN |
| Upper Cumberland Walk | TN2 5EH |
| Vale Road | TN1 1BS TN1 1BF TN1 1BJ |
| Wallace Close | TN2 5HW |
| Warwick Park | TN2 5EF TN2 5EJ TN2 5EN TN2 5ET TN2 5FD TN2 5TA TN2 5TB |
| Warwick Road | TN1 1YL |
| Waterfield | TN2 5XH |
| Wybourne Rise | TN2 5JG |
| TN1 1UB TN2 5GN TN2 5TF |
Transport near Pantiles And St Marks
- FAQ
- Price Paid By Year
- Property Type Price
Frequently asked questions about Pantiles And St Marks
What is the average price for a property for sale in Pantiles And St Marks?
The average price for a property for sale in Pantiles And St Marks is £694,044. This amount is 31% higher than the average price in Tunbridge Wells. There are 1,475 property listings for sale in Pantiles And St Marks.
What streets have the most expensive properties for sale in Pantiles And St Marks?
The streets with the most expensive properties for sale in Pantiles And St Marks are Camden Hill at an average of £2,212,500, Richmond Place at an average of £2,000,000 and Nevill Gate at an average of £1,750,000.
What streets have the most affordable properties for sale in Pantiles And St Marks?
The streets with the most affordable properties for sale in Pantiles And St Marks are Chenies Close at an average of £187,400, Belgrove at an average of £193,333 and Montacute Road at an average of £208,000.
Which train stations are available in or near Pantiles And St Marks?
Some of the train stations available in or near Pantiles And St Marks are Tunbridge Wells, Frant and High Brooms.
Property Price Paid in Pantiles And St Marks by Year
The average sold property price by year was:
| Year | Average Sold Price | Price Change |
Sold Properties
|
|---|---|---|---|
| 2025 | £618,383.15 | -21% |
92 Properties |
| 2024 | £748,984.57 | 6% |
110 Properties |
| 2023 | £701,884.5 | -5% |
117 Properties |
| 2022 | £734,607.56 | 6% |
172 Properties |
| 2021 | £689,389.34 | 5% |
229 Properties |
| 2020 | £652,876.11 | 5% |
161 Properties |
| 2019 | £619,051 | 6% |
130 Properties |
| 2018 | £582,265.86 | -7% |
167 Properties |
| 2017 | £624,627 | 18% |
136 Properties |
| 2016 | £514,438.65 | -6% |
199 Properties |
| 2015 | £544,425.82 | 18% |
174 Properties |
| 2014 | £444,982 | -1% |
181 Properties |
| 2013 | £451,548 | -3% |
153 Properties |
| 2012 | £466,808 | 1% |
142 Properties |
| 2011 | £464,027 | 3% |
128 Properties |
| 2010 | £450,139 | 16% |
137 Properties |
| 2009 | £377,384 | -19% |
133 Properties |
| 2008 | £449,530 | 15% |
121 Properties |
| 2007 | £382,340 | 8% |
297 Properties |
| 2006 | £350,336 | -4% |
235 Properties |
| 2005 | £365,233.22 | 8% |
189 Properties |
| 2004 | £335,485.87 | 11% |
205 Properties |
| 2003 | £299,081 | 11% |
179 Properties |
| 2002 | £265,131 | 14% |
244 Properties |
| 2001 | £227,965 | 2% |
226 Properties |
| 2000 | £223,835 | 19% |
169 Properties |
| 1999 | £180,536.01 | 18% |
251 Properties |
| 1998 | £148,280 | 11% |
202 Properties |
| 1997 | £131,401 | 9% |
210 Properties |
| 1996 | £119,107 | 9% |
175 Properties |
| 1995 | £107,933 | - |
139 Properties |
Property Price per Property Type in Pantiles And St Marks
Here you can find historic sold price data in order to help with your property search.
The average Property Paid Price for specific property types in the last three years are:
| Property Type | Average Sold Price | Sold Properties |
|---|---|---|
| Flat | £349,691.49 | 141 Flats |
| Semi Detached House | £903,868.57 | 35 Semi Detached Houses |
| Detached House | £1,161,474.60 | 91 Detached Houses |
| Terraced House | £668,537.50 | 52 Terraced Houses |

