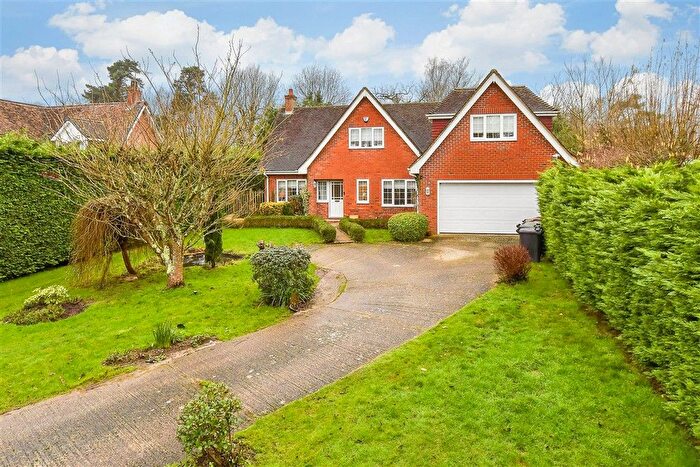
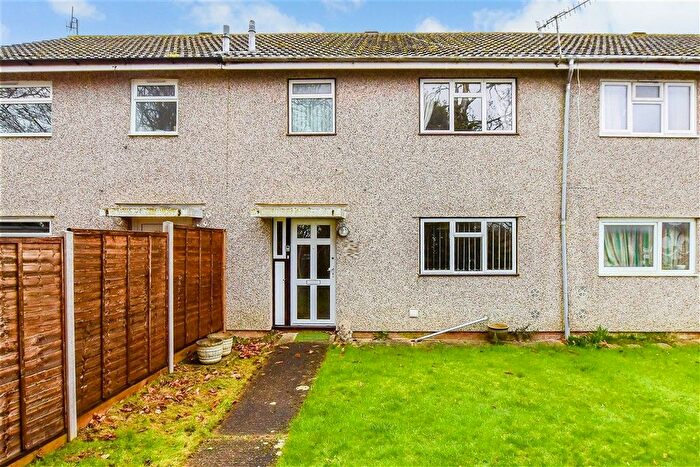
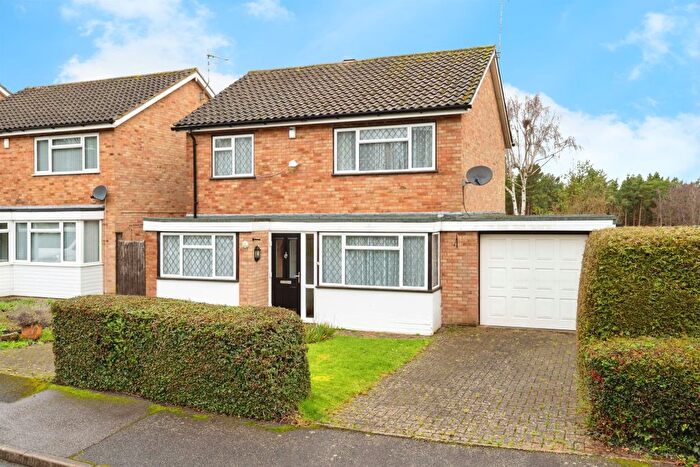
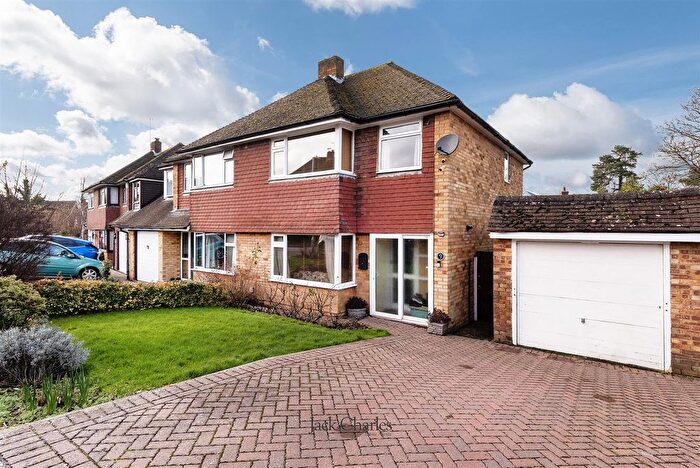
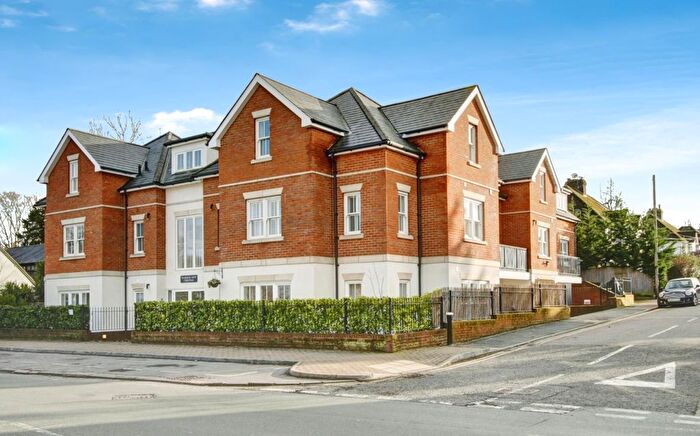
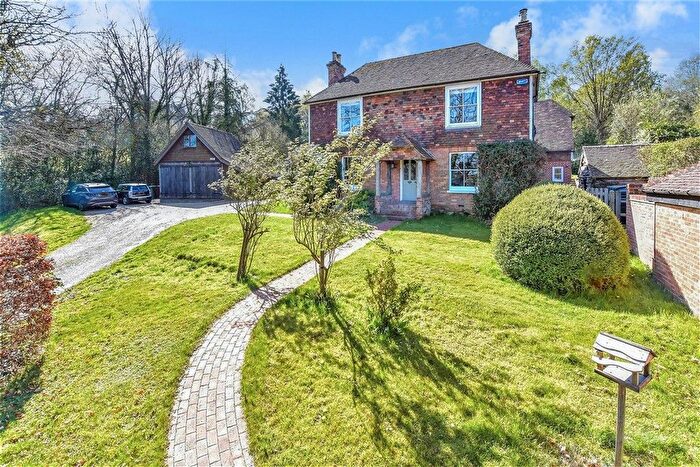
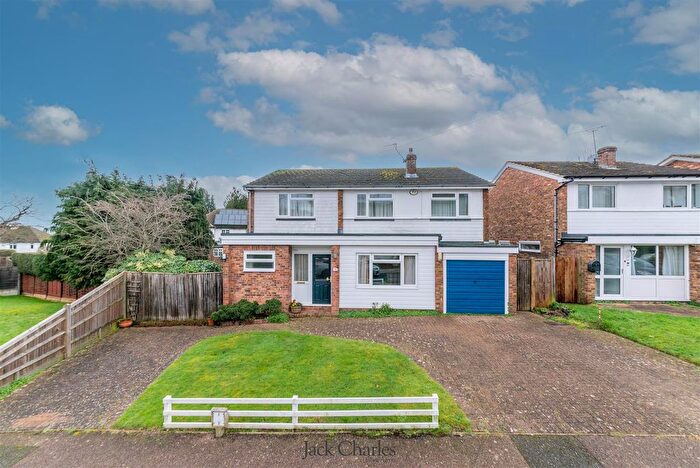
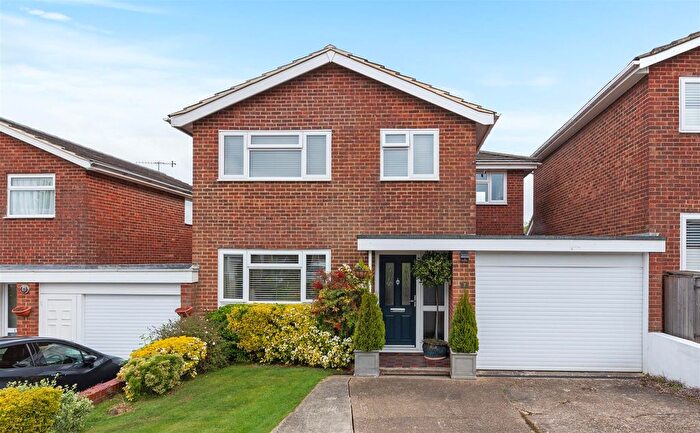
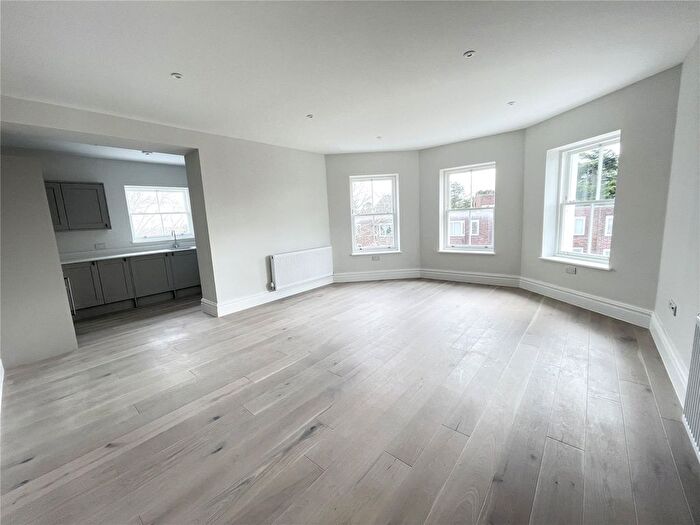
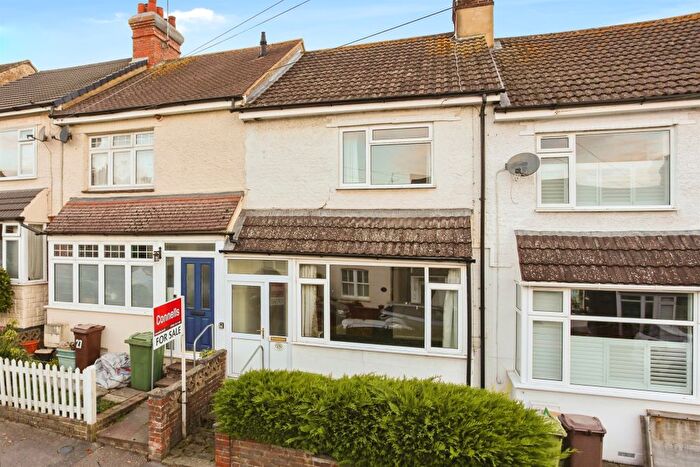
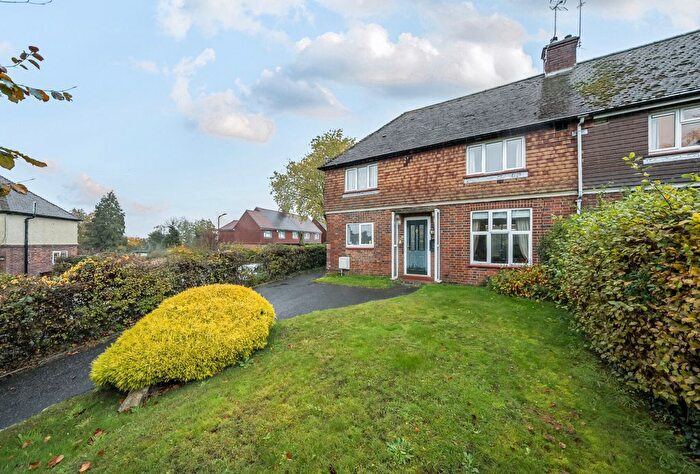
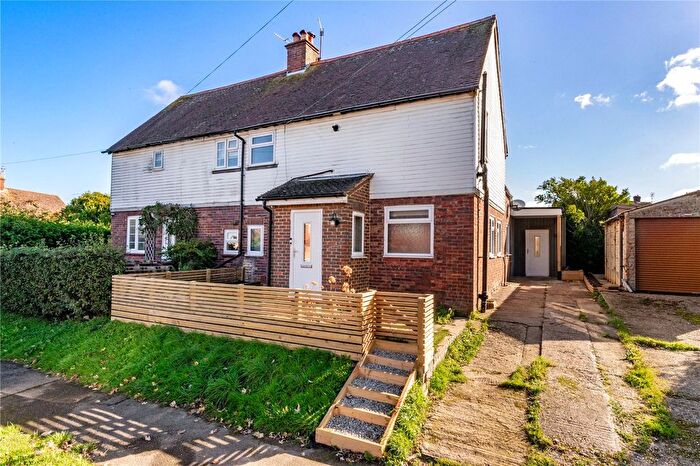
Houses for sale & to rent in Pembury, Tunbridge Wells
House Prices in Pembury
Properties in Pembury have an average house price of £494,244.00 and had 191 Property Transactions within the last 3 years¹.
Pembury is an area in Tunbridge Wells, Kent with 2,385 households², where the most expensive property was sold for £1,877,875.00.
Properties for sale in Pembury
Previously listed properties in Pembury
Roads and Postcodes in Pembury
Navigate through our locations to find the location of your next house in Pembury, Tunbridge Wells for sale or to rent.
| Streets | Postcodes |
|---|---|
| Amberleaze Drive | TN2 4HF |
| Batchelors | TN2 4ED |
| Beagles Wood Road | TN2 4HX TN2 4HY TN2 4HZ TN2 4JH TN2 4JJ |
| Beech Hurst | TN2 4DU |
| Belfield Road | TN2 4HL TN2 4HN |
| Berkeley Close | TN2 4LU |
| Brickfields | TN2 4XX |
| Bulls Place | TN2 4HJ |
| Camden Avenue | TN2 4PQ |
| Canterbury Road | TN2 4JT |
| Chalket Lane | TN2 4AA TN2 4PE TN2 4PF |
| Chestnut Walk | TN2 4BY |
| Church Road | TN2 4BS TN2 4BT |
| Cornford Close | TN2 4QP |
| Cornford Lane | TN2 4QR TN2 4QS TN2 4QT |
| Cornford Park | TN2 4PW |
| Dundale Road | TN3 9AH |
| Elmhurst Avenue | TN2 4DA |
| Forest Way | TN2 4EP |
| Gimble Way | TN2 4BX |
| Greenleas | TN2 4NS |
| Hastings Road | TN2 4BL TN2 4JP TN2 4JR TN2 4JS TN2 4JU TN2 4JY TN2 4PB TN2 4PD |
| Henwood Green Road | TN2 4LA TN2 4LB TN2 4LE TN2 4LF TN2 4LH TN2 4LN TN2 4LP TN2 4LR TN2 4LW TN2 4LG |
| Henwoods Crescent | TN2 4LJ TN2 4LL |
| Henwoods Mount | TN2 4BH |
| Herons Way | TN2 4DH TN2 4DN TN2 4DQ TN2 4DW |
| Heskett Park | TN2 4JF TN2 4JG |
| High Street | TN2 4NG TN2 4NU TN2 4NY TN2 4PH TN2 4DY TN2 4NT TN2 4PN |
| Highfield Close | TN2 4HG TN2 4HQ |
| Horse Pasture Cottages | TN2 4AQ |
| Kings Toll Road | TN2 4BE |
| Knights Close | TN2 4EL |
| Knights Place | TN2 4DX |
| Knights Ridge | TN2 4HP |
| Lower Green Road | TN2 4DZ TN2 4EB TN2 4EE TN2 4EF TN2 4HB TN2 4HE TN2 4HH TN2 4PA TN2 4EA TN2 4HR TN2 4HS |
| Maidstone Road | TN2 4AD TN2 4AE TN2 4AH TN2 4AJ TN2 4DB TN2 4DD TN2 4DE TN2 4AG TN2 4TA |
| Middle Field | TN2 4EJ |
| Oast Gardens | TN2 4DT |
| Old Church Road | TN2 4AS TN2 4AT TN2 4AU TN2 4AX TN2 4BN |
| Pembury Close | TN2 4LS |
| Penns Yard | TN2 4XY |
| Petersfield | TN2 4HD |
| Polley Close | TN2 4HW |
| Redwings Lane | TN2 4AN TN2 4AR |
| Ridgeway | TN2 4ER TN2 4ES TN2 4ET TN2 4EZ |
| Romford Road | TN2 4AY TN2 4BA TN2 4BB TN2 4HT TN2 4HU TN2 4JA TN2 4JB TN2 4JD TN2 4JE |
| Sandhurst Avenue | TN2 4JZ |
| Snipe Close | TN2 4DG |
| Stanam Road | TN2 4LD |
| Stone Court Lane | TN2 4AB |
| Stonecourt Lane | TN2 4DF |
| Sunhill Place | TN2 4NZ |
| Sweeps Hill Close | TN2 4LT |
| Sycamore Cottages | TN2 4PJ |
| The Coppice | TN2 4EY |
| The Forstal | TN2 4EG |
| The Gill | TN2 4DJ TN2 4DL |
| The Glebe | TN2 4EN |
| The Grove | TN2 4BU |
| The Meadow | TN2 4EH |
| The Paddock | TN2 4NR |
| The Rowans | TN2 4JQ |
| The Woodlands | TN2 4AZ |
| Tonbridge Road | TN2 4QL TN2 4QH TN2 4QJ TN2 4QN |
| Westway | TN2 4EX |
| Woodhill Park | TN2 4NN TN2 4NP TN2 4NW |
| Woodsgate Way | TN2 4NJ |
| Woodside Close | TN2 4BQ |
| Woodside Road | TN2 4BG |
Transport near Pembury
- FAQ
- Price Paid By Year
- Property Type Price
Frequently asked questions about Pembury
What is the average price for a property for sale in Pembury?
The average price for a property for sale in Pembury is £494,244. This amount is 7% lower than the average price in Tunbridge Wells. There are 220 property listings for sale in Pembury.
What streets have the most expensive properties for sale in Pembury?
The streets with the most expensive properties for sale in Pembury are Lower Green Road at an average of £862,434, Woodside Road at an average of £795,000 and Stonecourt Lane at an average of £697,000.
What streets have the most affordable properties for sale in Pembury?
The streets with the most affordable properties for sale in Pembury are Snipe Close at an average of £300,000, The Glebe at an average of £322,332 and Petersfield at an average of £330,000.
Which train stations are available in or near Pembury?
Some of the train stations available in or near Pembury are High Brooms, Tunbridge Wells and Frant.
Property Price Paid in Pembury by Year
The average sold property price by year was:
| Year | Average Sold Price | Price Change |
Sold Properties
|
|---|---|---|---|
| 2025 | £512,192 | 4% |
70 Properties |
| 2024 | £490,702 | 3% |
60 Properties |
| 2023 | £477,133 | -9% |
61 Properties |
| 2022 | £520,428 | 2% |
81 Properties |
| 2021 | £512,284 | 6% |
103 Properties |
| 2020 | £479,179 | 11% |
67 Properties |
| 2019 | £428,772 | -1% |
77 Properties |
| 2018 | £433,577 | 4% |
67 Properties |
| 2017 | £416,573 | 4% |
75 Properties |
| 2016 | £398,415 | 7% |
71 Properties |
| 2015 | £369,397 | 13% |
70 Properties |
| 2014 | £322,999 | 4% |
81 Properties |
| 2013 | £310,848 | 8% |
78 Properties |
| 2012 | £286,023 | -0,1% |
75 Properties |
| 2011 | £286,392 | -9% |
61 Properties |
| 2010 | £312,200 | 17% |
78 Properties |
| 2009 | £260,497 | -10% |
65 Properties |
| 2008 | £286,235 | -8% |
57 Properties |
| 2007 | £309,494 | 4% |
121 Properties |
| 2006 | £297,487 | 12% |
113 Properties |
| 2005 | £261,388 | 4% |
86 Properties |
| 2004 | £250,064 | 6% |
100 Properties |
| 2003 | £235,116 | 16% |
107 Properties |
| 2002 | £197,736 | 14% |
116 Properties |
| 2001 | £169,438 | 6% |
113 Properties |
| 2000 | £158,764 | 7% |
76 Properties |
| 1999 | £147,631 | 14% |
135 Properties |
| 1998 | £126,552 | 20% |
93 Properties |
| 1997 | £101,249 | 12% |
107 Properties |
| 1996 | £89,587 | -8% |
92 Properties |
| 1995 | £96,600 | - |
94 Properties |
Property Price per Property Type in Pembury
Here you can find historic sold price data in order to help with your property search.
The average Property Paid Price for specific property types in the last three years are:
| Property Type | Average Sold Price | Sold Properties |
|---|---|---|
| Semi Detached House | £473,089.00 | 56 Semi Detached Houses |
| Detached House | £687,049.00 | 61 Detached Houses |
| Terraced House | £355,068.00 | 54 Terraced Houses |
| Flat | £341,200.00 | 20 Flats |

