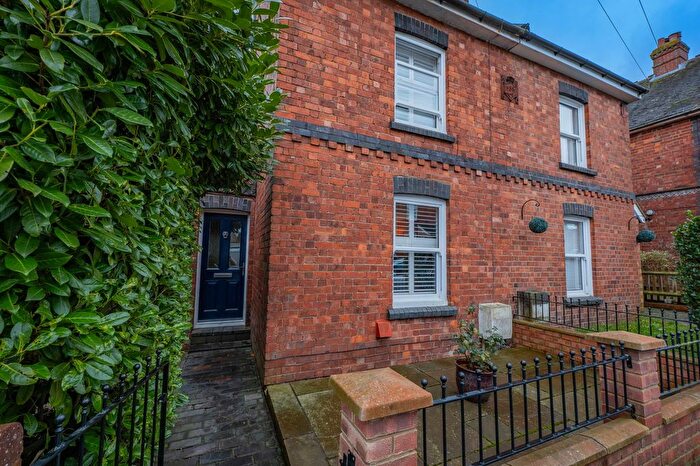
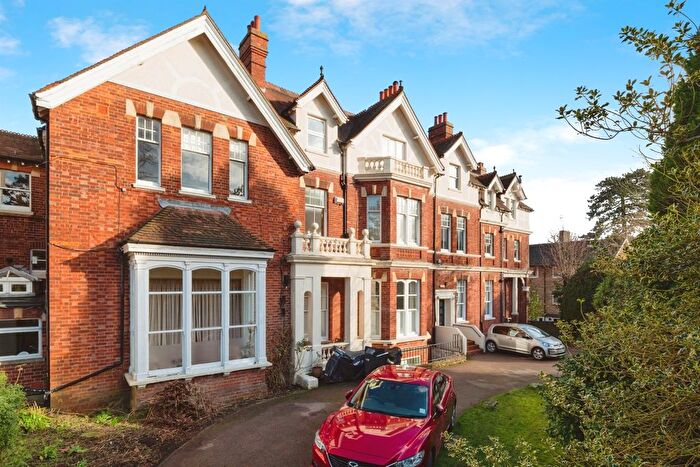
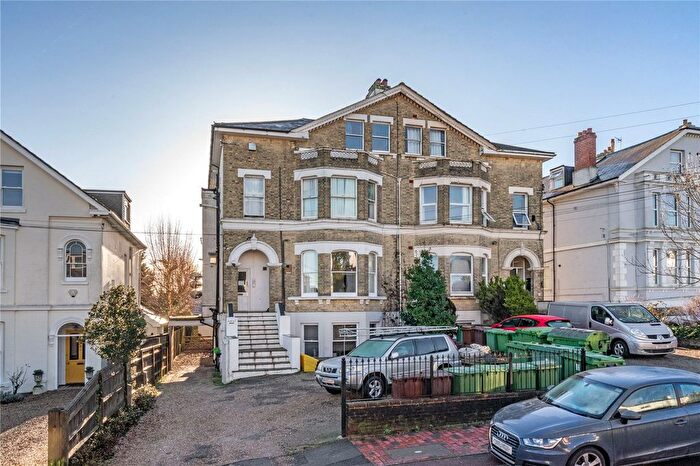
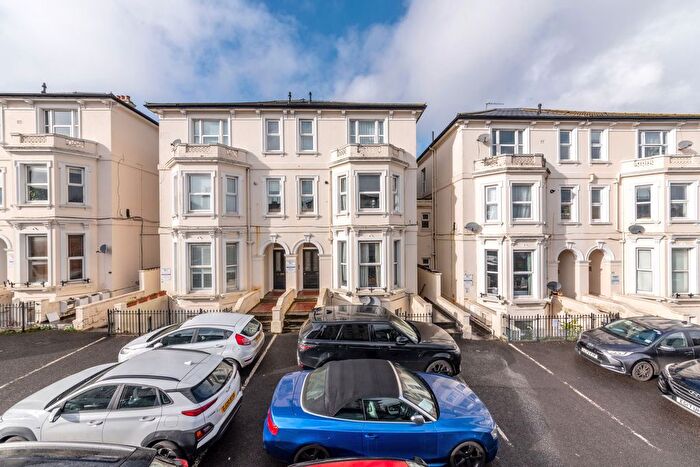
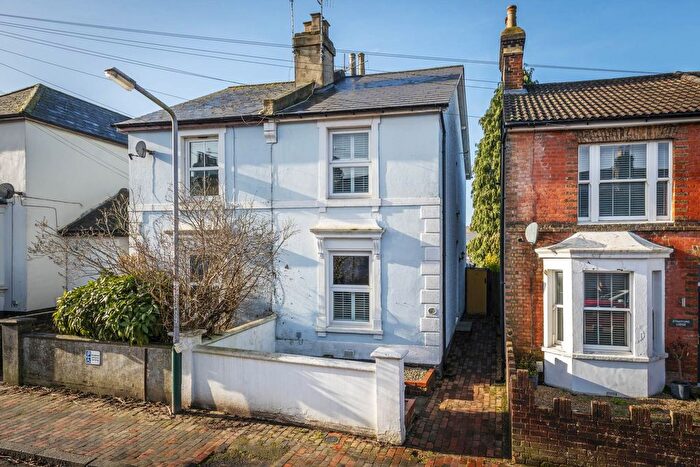
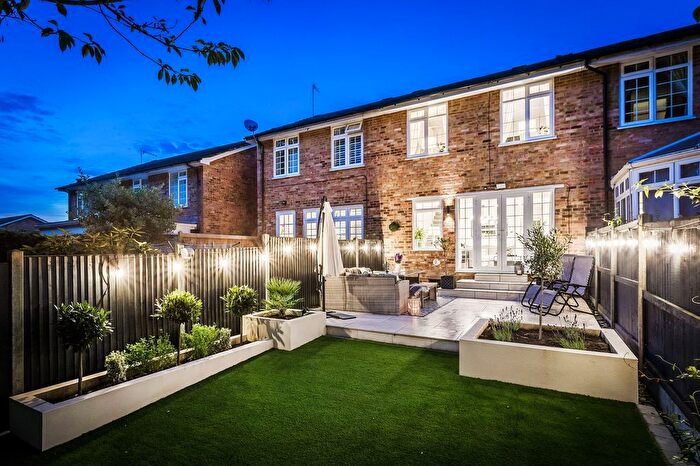
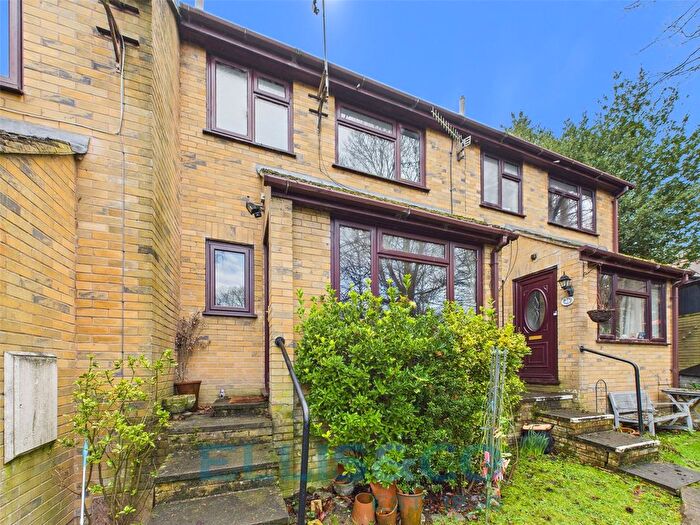
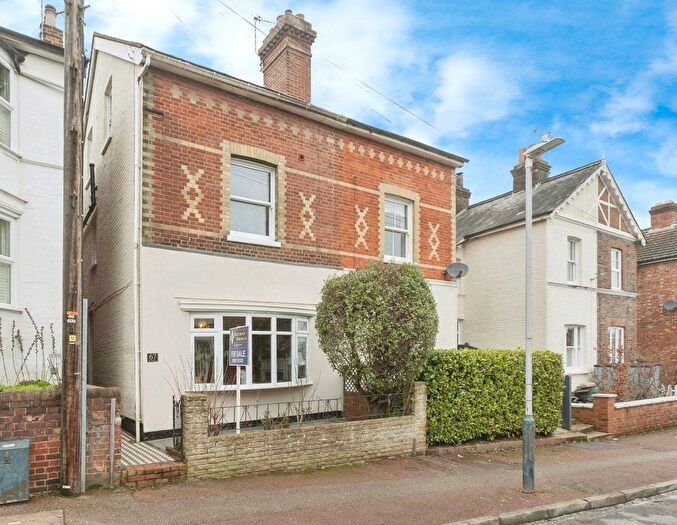
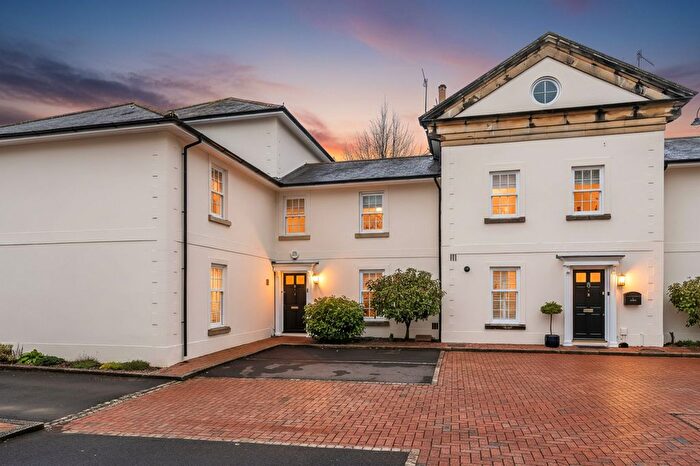
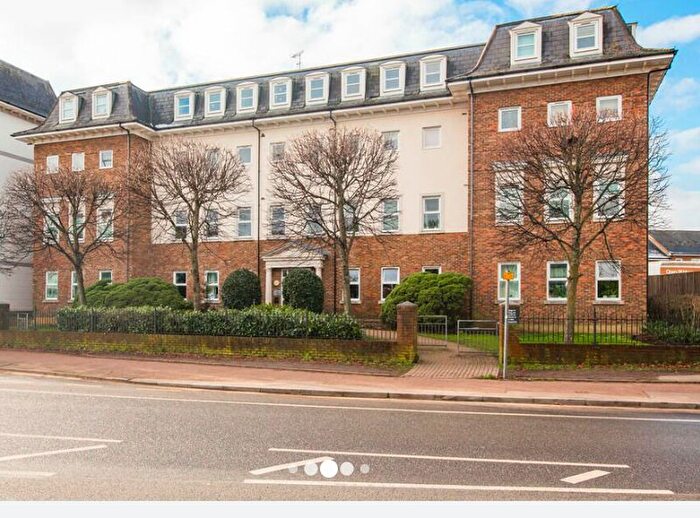
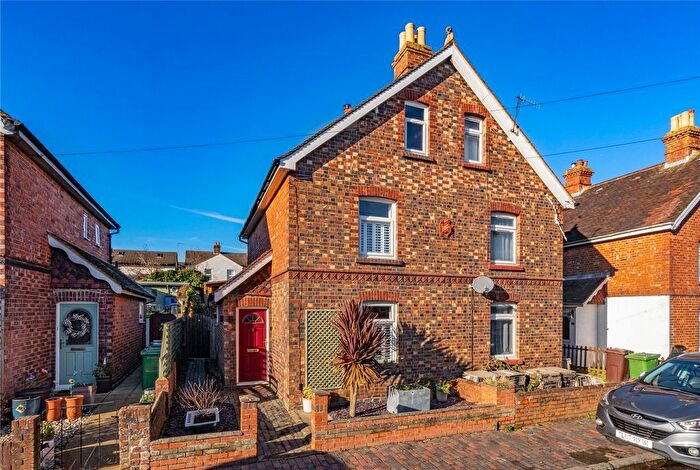
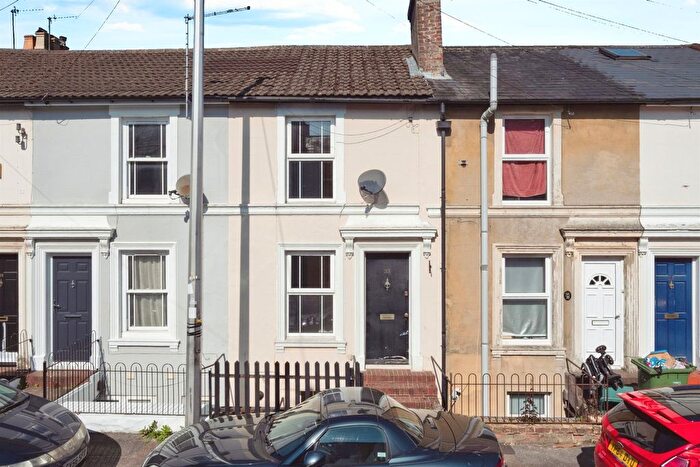
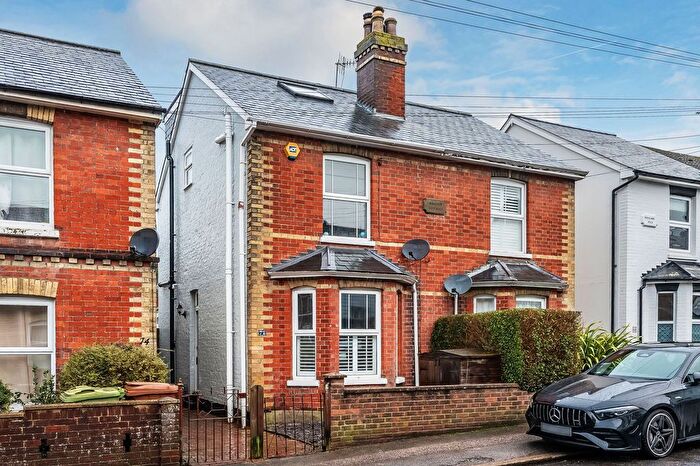
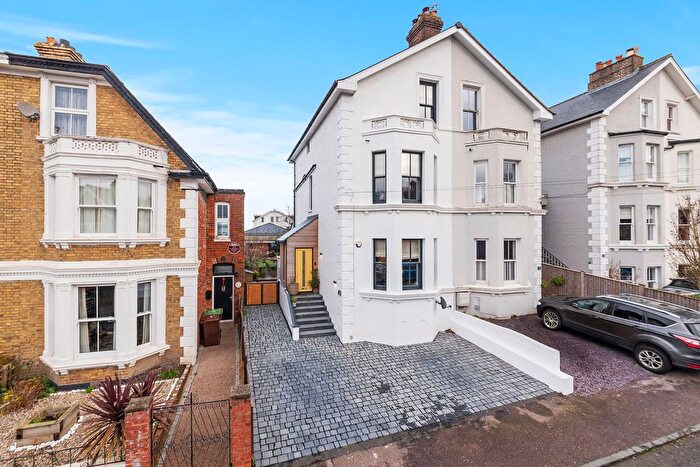
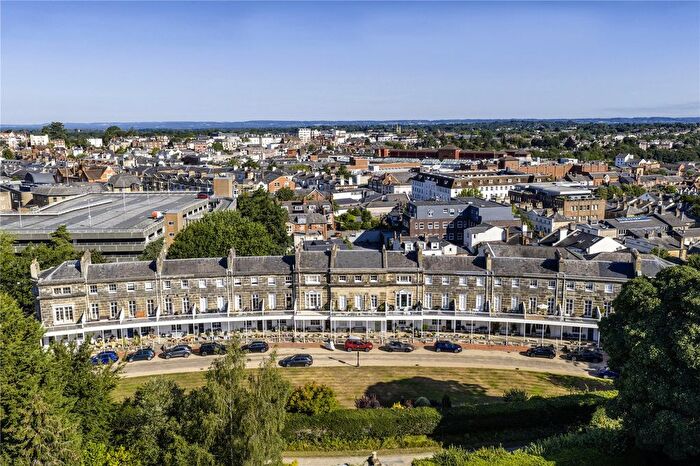
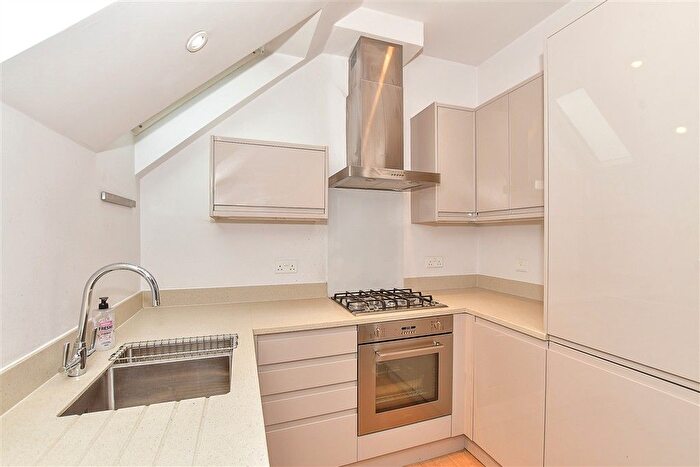
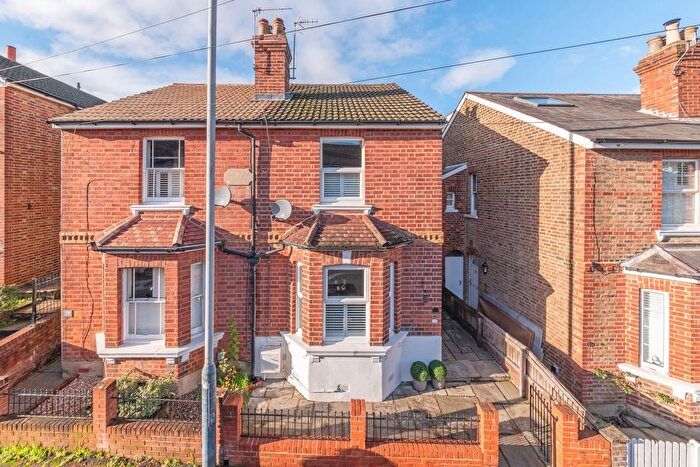
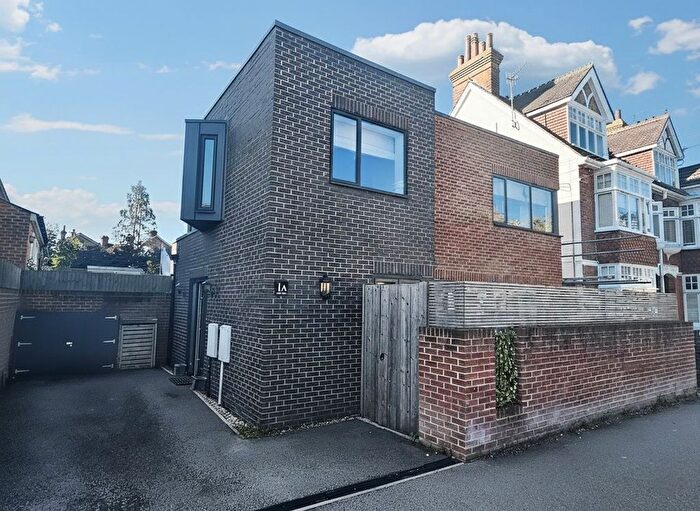
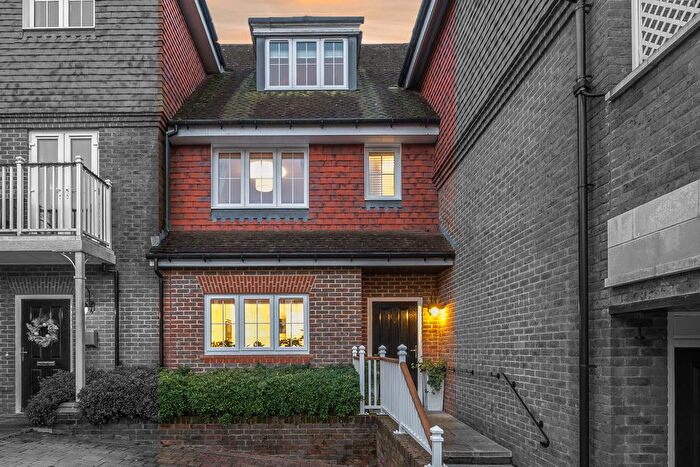
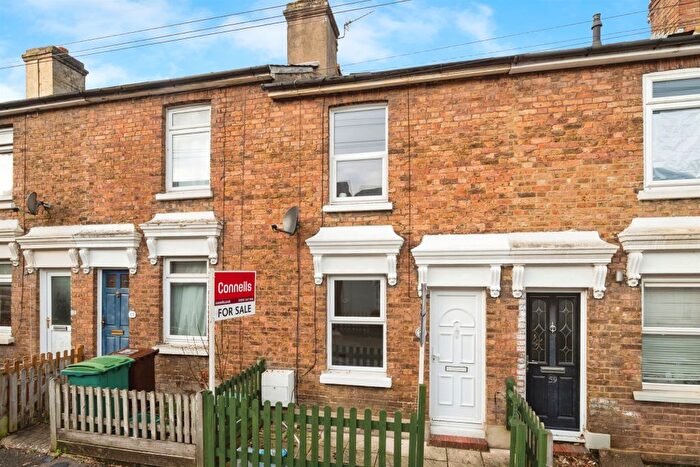
Houses for sale & to rent in St Johns, Tunbridge Wells
House Prices in St Johns
Properties in St Johns have an average house price of £556,597.01 and had 283 Property Transactions within the last 3 years¹.
St Johns is an area in Tunbridge Wells, Kent with 2,850 households², where the most expensive property was sold for £2,100,000.00.
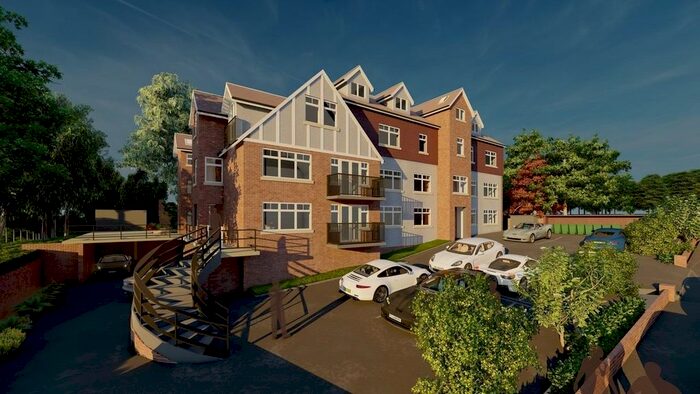
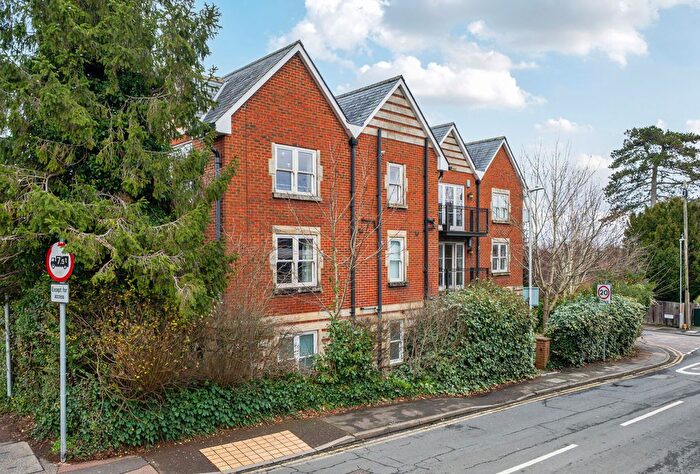
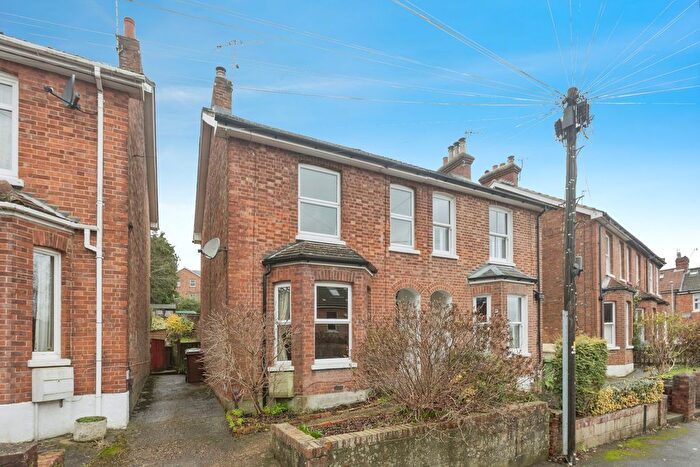
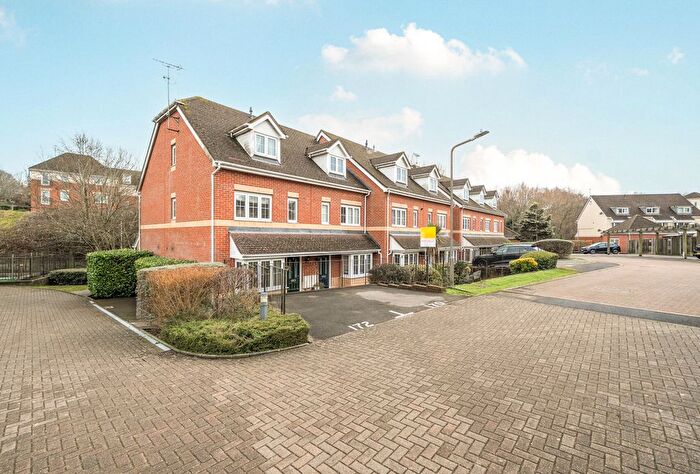
Properties for sale in St Johns
Roads and Postcodes in St Johns
Navigate through our locations to find the location of your next house in St Johns, Tunbridge Wells for sale or to rent.
| Streets | Postcodes |
|---|---|
| All Saints Rise | TN4 9PW |
| All Saints Road | TN4 9JF |
| Beltring Road | TN4 9UA |
| Cambrian Road | TN4 9HH TN4 9HJ |
| Campbell Road | TN4 9RG |
| Culverden Avenue | TN4 9AQ TN4 9RE TN4 9RF |
| Culverden Down | TN4 9RX TN4 9SA TN4 9SF TN4 9SG |
| Cunningham Close | TN4 9EH |
| Cunningham Road | TN4 9EL TN4 9EN TN4 9EW |
| Currie Road | TN4 9QG TN4 9QH |
| Denbigh Road | TN4 9HS |
| Dunstan Road | TN4 9AF TN4 9NE |
| Dynevor Road | TN4 9HP TN4 9HR |
| East Cliff Road | TN4 9AD TN4 9AE TN4 9AG |
| Floyd Close | TN4 9US TN4 9UR |
| Hasletts Close | TN1 2EE |
| Holmewood Road | TN4 9HA TN4 9HB TN4 9HD |
| Hopwood Gardens | TN4 9PT TN4 9PU |
| Huntleys Park | TN4 9TD |
| Impala Gardens | TN4 9PZ |
| Kent Road | TN4 9UE |
| Lakeman Way | TN4 9LB |
| Leighton Close | TN4 9UX |
| Mereworth Road | TN4 9PL |
| Merrion Close | TN4 9JJ |
| Merrion Way | TN4 9JL |
| Montgomery Road | TN4 9EP TN4 9ER |
| New England Road | TN4 9AA |
| Newcomen Road | TN4 9PA |
| Newlands Rise | TN4 9AH |
| Newlands Road | TN4 9AR TN4 9AS TN4 9AT TN4 9AU |
| Newlands Way | TN4 9AN |
| Percy Terrace | TN4 9RH |
| Powder Mill Lane | TN4 9EJ |
| Powdermill Lane | TN4 0DA TN4 0DB TN4 0DL |
| Queens Gardens | TN4 9NB |
| Queens Road | TN4 9JU TN4 9JX TN4 9JY TN4 9LL TN4 9LZ TN4 9NA |
| Reynolds Lane | TN4 9XJ TN4 9XL TN4 9XN |
| Richardson Road | TN4 9PB |
| Riddlesdale Avenue | TN4 9AB |
| Rosehurst Villas | TN4 9HE |
| Shaftesbury Road | TN4 9PD |
| Silverdale Lane | TN4 9LA |
| Silverdale Mews | TN4 9FN |
| Silverdale Road | TN4 9HT TN4 9HU TN4 9HX TN4 9HY TN4 9HZ TN4 9JA TN4 9JB |
| Somerset Road | TN4 9PR TN4 9PX TN4 9PY TN4 9PS |
| South View Road | TN4 9BU |
| Southfield Road | TN4 9UH TN4 9UL TN4 9UN TN4 9UJ |
| Southwood Avenue | TN4 9PN |
| Speldhurst Road | TN4 0HY TN4 0HZ |
| St Davids Road | TN4 9JQ |
| St Johns Park | TN4 9XG |
| St Johns Road | TN4 9PE TN4 9PH TN4 9TU TN4 9UG TN4 9UP TN4 9UT TN4 9UU TN4 9UY TN4 9XD TN4 9XE TN4 9FJ TN4 9NY TN4 9PG TN4 9QQ TN4 9TX TN4 9UZ TN4 9XB |
| St Lukes Road | TN4 9JH |
| St Michaels Road | TN4 9JG |
| Stephens Road | TN4 9JD TN4 9JE TN4 9QA TN4 9QB TN4 9QD TN4 9QE |
| Stonewood Close | TN4 9RW |
| Tedder Road | TN4 9ES |
| Upper Dunstan Road | TN4 9NF |
| Upper Grosvenor Road | TN1 2EB TN1 2ED TN1 2EF TN1 2EG TN1 2EH TN1 2EJ TN1 2EQ TN1 2ER TN4 9EX TN4 9EY TN4 9EZ |
| Whitefield Road | TN4 9TG TN4 9UB TN4 9UD |
| Whitegate Close | TN4 9XW |
| Wilman Road | TN4 9AJ TN4 9AL TN4 9AP |
| Woodland Close | TN4 9HL |
| Woodland Road | TN4 9HF TN4 9HG TN4 9HN TN4 9HW |
| TN4 9SH |
Transport near St Johns
-
High Brooms Station
-
Tunbridge Wells Station
-
Frant Station
-
Tonbridge Station
-
Leigh (Kent) Station
-
Eridge Station
- FAQ
- Price Paid By Year
- Property Type Price
Frequently asked questions about St Johns
What is the average price for a property for sale in St Johns?
The average price for a property for sale in St Johns is £556,597. This amount is 5% higher than the average price in Tunbridge Wells. There are 1,918 property listings for sale in St Johns.
What streets have the most expensive properties for sale in St Johns?
The streets with the most expensive properties for sale in St Johns are Huntleys Park at an average of £1,187,500, Beltring Road at an average of £876,250 and Culverden Avenue at an average of £860,583.
What streets have the most affordable properties for sale in St Johns?
The streets with the most affordable properties for sale in St Johns are Floyd Close at an average of £192,500, Cunningham Close at an average of £270,000 and Powdermill Lane at an average of £282,500.
Which train stations are available in or near St Johns?
Some of the train stations available in or near St Johns are High Brooms, Tunbridge Wells and Frant.
Property Price Paid in St Johns by Year
The average sold property price by year was:
| Year | Average Sold Price | Price Change |
Sold Properties
|
|---|---|---|---|
| 2025 | £546,727.58 | -5% |
78 Properties |
| 2024 | £574,222.13 | 5% |
112 Properties |
| 2023 | £543,648.66 | 4% |
93 Properties |
| 2022 | £524,502.06 | 2% |
127 Properties |
| 2021 | £515,586.08 | 7% |
197 Properties |
| 2020 | £480,883.75 | 7% |
120 Properties |
| 2019 | £447,717.8 | 7% |
124 Properties |
| 2018 | £416,941.72 | 2% |
178 Properties |
| 2017 | £410,364 | 3% |
120 Properties |
| 2016 | £396,848 | 13% |
155 Properties |
| 2015 | £343,624 | -0,4% |
138 Properties |
| 2014 | £345,118 | 5% |
149 Properties |
| 2013 | £327,193 | 8% |
124 Properties |
| 2012 | £300,723 | 4% |
116 Properties |
| 2011 | £289,504 | -4% |
119 Properties |
| 2010 | £302,478 | 14% |
123 Properties |
| 2009 | £259,273 | -10% |
120 Properties |
| 2008 | £285,821 | 6% |
106 Properties |
| 2007 | £268,914 | 2% |
178 Properties |
| 2006 | £262,960 | 16% |
197 Properties |
| 2005 | £220,231 | -5% |
161 Properties |
| 2004 | £231,168 | 13% |
191 Properties |
| 2003 | £200,563 | 7% |
171 Properties |
| 2002 | £186,378 | 21% |
209 Properties |
| 2001 | £147,843 | 2% |
218 Properties |
| 2000 | £144,564 | 25% |
156 Properties |
| 1999 | £108,015 | 4% |
208 Properties |
| 1998 | £103,990 | 21% |
164 Properties |
| 1997 | £81,965 | -38% |
169 Properties |
| 1996 | £113,057 | 30% |
172 Properties |
| 1995 | £79,374 | - |
139 Properties |
Property Price per Property Type in St Johns
Here you can find historic sold price data in order to help with your property search.
The average Property Paid Price for specific property types in the last three years are:
| Property Type | Average Sold Price | Sold Properties |
|---|---|---|
| Semi Detached House | £602,054.00 | 129 Semi Detached Houses |
| Detached House | £854,600.00 | 44 Detached Houses |
| Terraced House | £486,599.00 | 57 Terraced Houses |
| Flat | £273,836.32 | 53 Flats |

