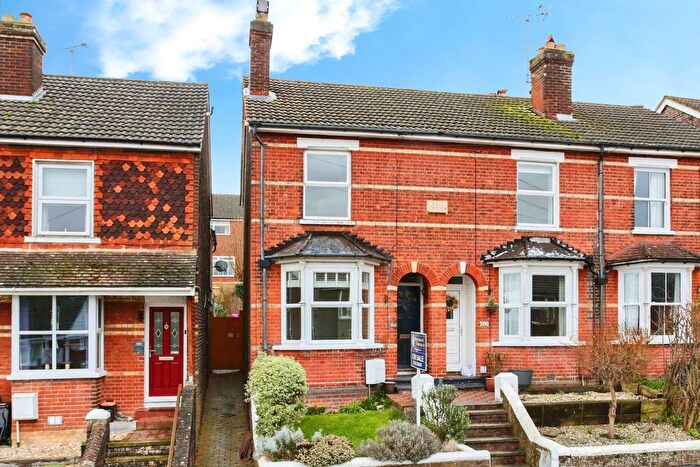
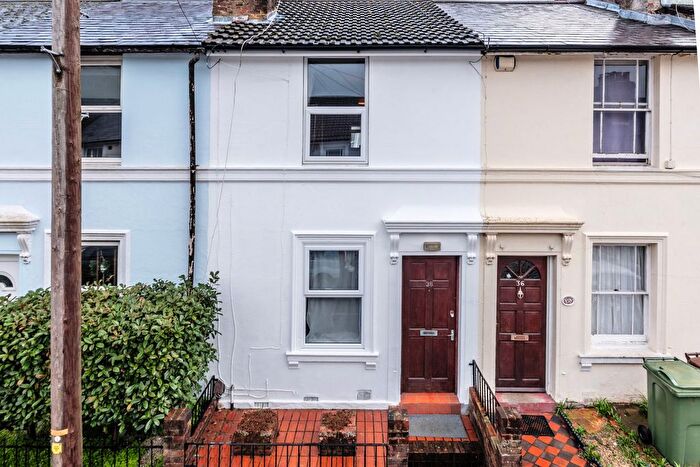
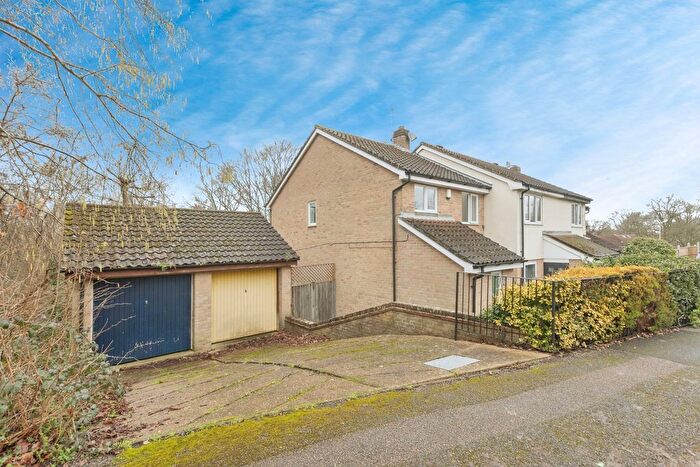
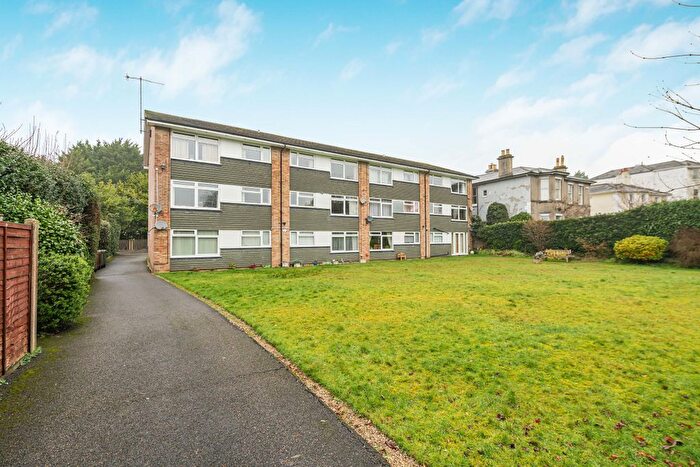
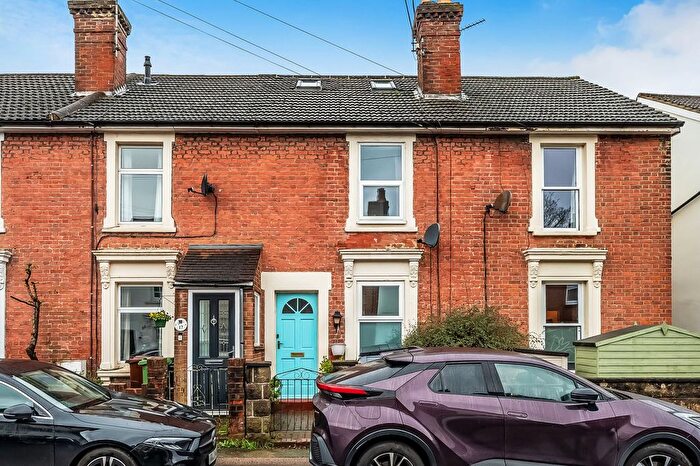
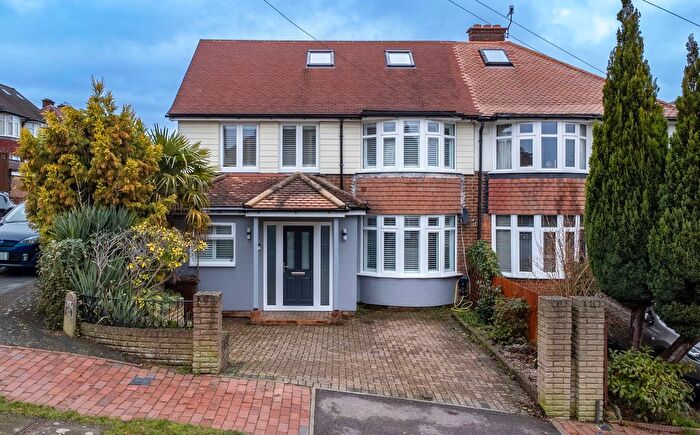
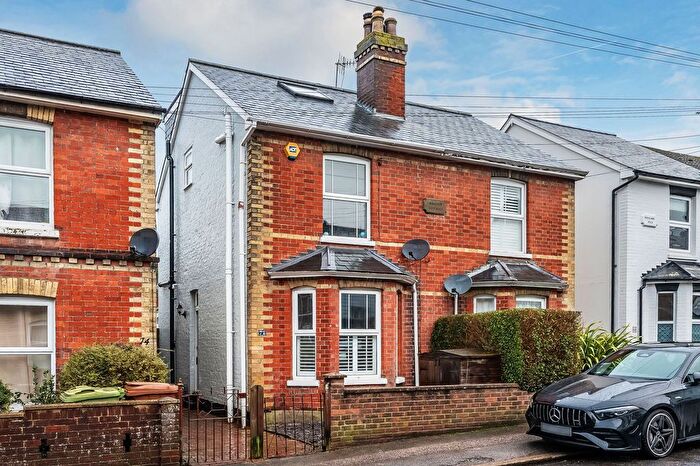
Houses for sale & to rent in Southborough North, Tunbridge Wells
House Prices in Southborough North
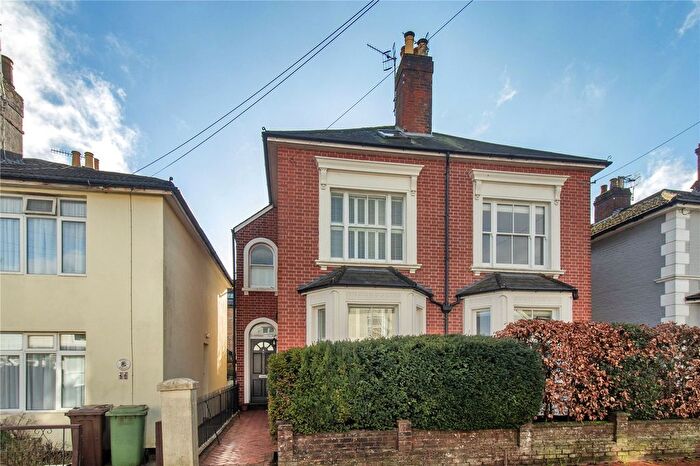
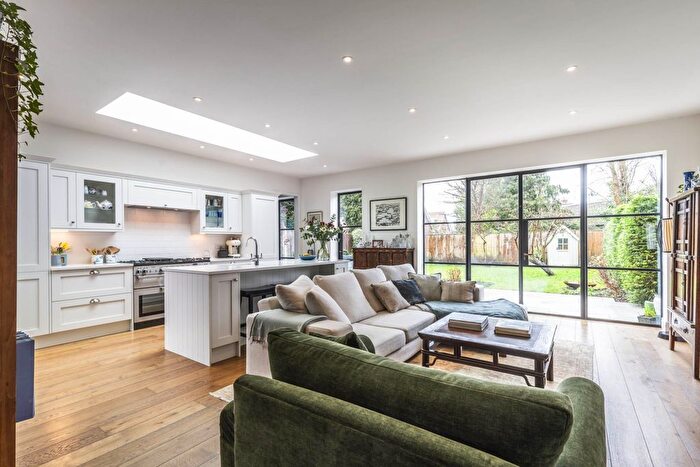
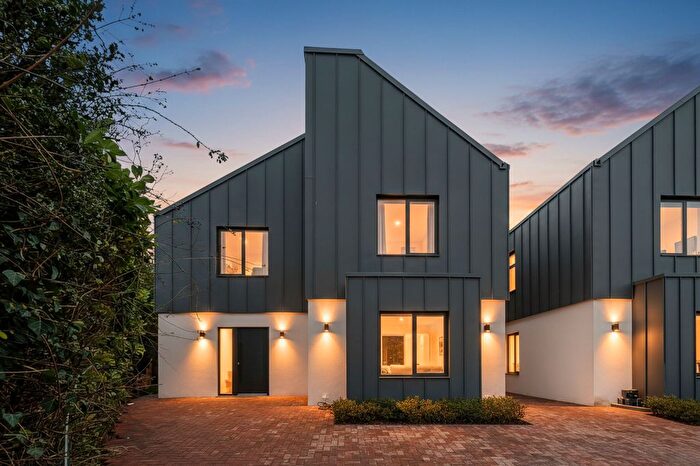
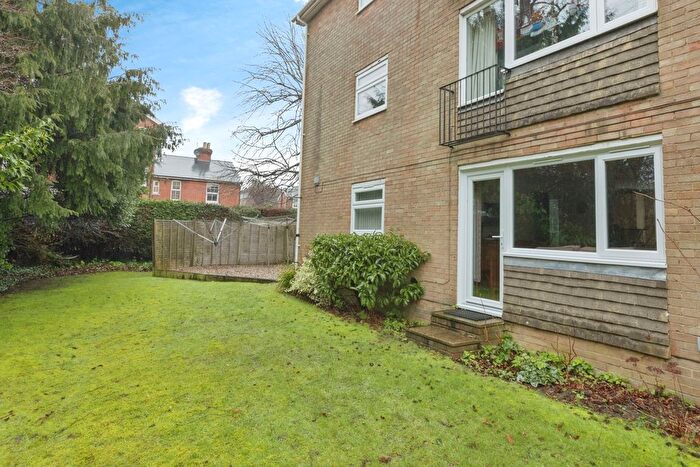
Properties in Southborough North have an average house price of £565,959.00 and had 187 Property Transactions within the last 3 years¹.
Southborough North is an area in Tunbridge Wells, Kent with 1,769 households², where the most expensive property was sold for £3,150,000.00.
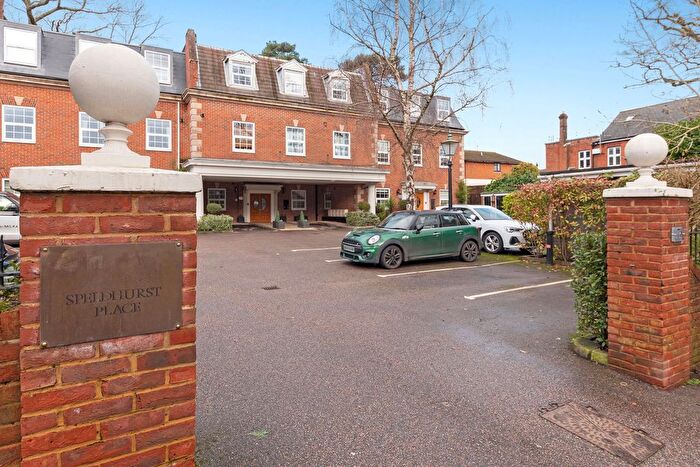
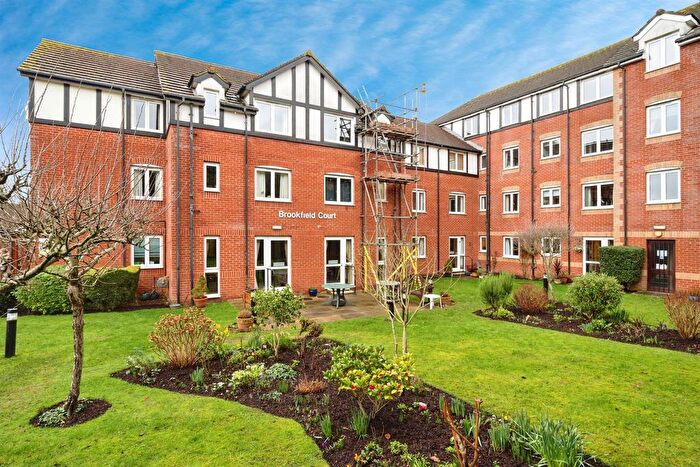
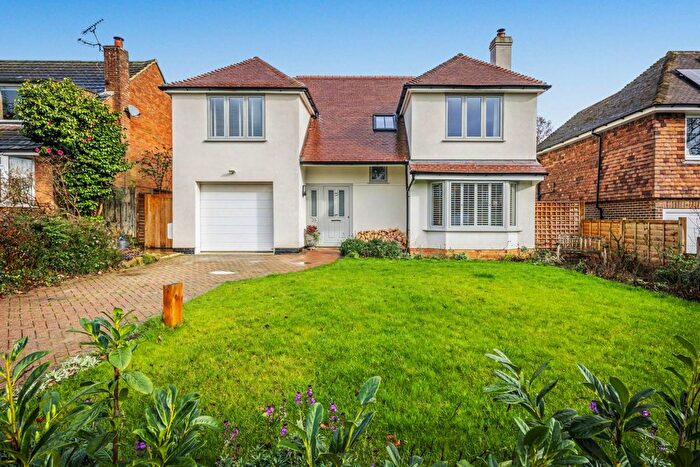
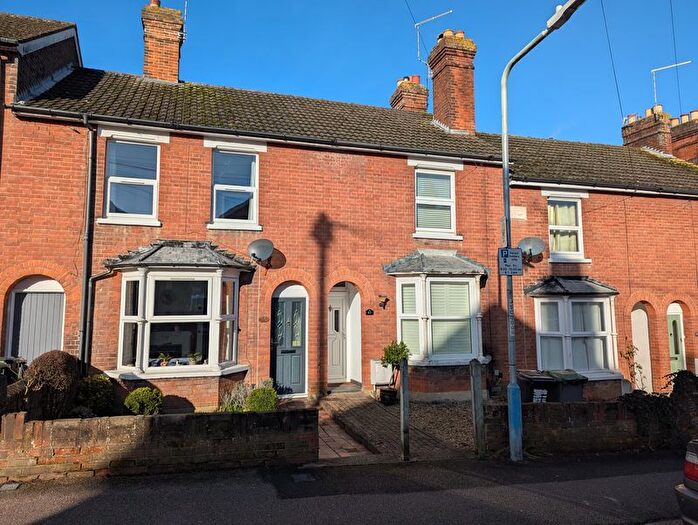
Properties for sale in Southborough North
Roads and Postcodes in Southborough North
Navigate through our locations to find the location of your next house in Southborough North, Tunbridge Wells for sale or to rent.
| Streets | Postcodes |
|---|---|
| Argyle Road | TN4 0SU |
| Birchwood Avenue | TN4 0UD TN4 0UE |
| Bounds Oak Way | TN4 0TN TN4 0TW TN4 0TX TN4 0UB |
| Breedon Avenue | TN4 0QR |
| Brookhurst Gardens | TN4 0UA |
| Carville Avenue | TN4 0QY |
| Castle Street | TN4 0PE |
| Church Road | TN4 0RT TN4 0RU TN4 0RX |
| Colonels Way | TN4 0SZ |
| Darnley Drive | TN4 0TH TN4 0TL |
| Doon Brae | TN4 0TF |
| Doric Avenue | TN4 0QN TN4 0QS TN4 0QU TN4 0QW |
| Doric Close | TN4 0QT |
| Dower House Crescent | TN4 0TS TN4 0TT |
| Draper Mews | TN4 0FB |
| Draper Street | TN4 0PG |
| Fairlight Close | TN4 0TG |
| Fernhurst Crescent | TN4 0TB TN4 0TD |
| Flaxmore Place | TN4 0TA |
| Garlinge Road | TN4 0NR |
| Glenmore Cottages | TN4 0SD |
| Great Bounds Drive | TN4 0TP TN4 0TR |
| Hardinge Avenue | TN4 0TU |
| Harland Way | TN4 0TQ |
| Holden Corner | TN4 0LP |
| Holden Road | TN4 0LR TN4 0QD TN4 0QE TN4 0QG TN4 0GD |
| Hythe Close | TN4 0NG |
| Kibbles Lane | TN4 0JR TN4 0LN |
| Little Boundes Close | TN4 0RS |
| London Road | TN4 0NH TN4 0PA TN4 0PB TN4 0PU TN4 0PX TN4 0QA TN4 0QB TN4 0RG TN4 0RJ TN4 0RQ TN4 0RR TN4 0UJ TN4 0UL TN4 0UN TN4 0NA TN4 0NS TN4 0PY TN4 0RE TN4 0RP TN4 0UH |
| Manor Road | TN4 0LB TN4 0LD |
| Modest Corner | TN4 0LS |
| Oak End Close | TN4 0TE |
| Park House Gardens | TN4 0NQ |
| Park Road | TN4 0NT TN4 0NU TN4 0NX TN4 0NZ TN4 0PQ |
| Pennington Manor | TN4 0SP |
| Pennington Place | TN4 0AQ |
| Pennington Road | TN4 0AF TN4 0SH TN4 0SJ TN4 0SL TN4 0SQ TN4 0SR TN4 0SS TN4 0ST TN4 0SX TN4 0AG |
| Pinewood Gardens | TN4 0NN TN4 0NW TN4 0FN TN4 0LZ |
| Prospect Park | TN4 0EQ |
| Rocks Hollow Gardens | TN4 0FE |
| Ruscombe Close | TN4 0SG |
| Salomons Grove | TN4 0FH TN4 0FJ TN4 0FL |
| Sheffield Road | TN4 0PD |
| Sir Davids Park | TN4 0JF |
| Smythe Close | TN4 0TY |
| Springfield Road | TN4 0LY TN4 0RA TN4 0RB |
| St Andrews Park Road | TN4 0NL |
| Still Lane | TN4 0FP |
| Stockland Green Road | TN3 0TJ TN3 0TL |
| Summerhill Avenue | TN4 0QX |
| The Common | TN4 0RY |
| The Crescent | TN4 0TJ |
| The Ridgewaye | TN4 0AD TN4 0AE |
| Vale Avenue | TN4 0QL |
| Vale Road | TN4 0QH TN4 0QJ TN4 0QQ |
| Valley View | TN4 0SY |
| Vauxhall Lane | TN4 0XD TN11 0NG |
| Vicarage Road | TN4 0SN |
| Victoria Road | TN4 0LT TN4 0LX TN4 0SA TN4 0SB |
| West Park Avenue | TN4 0QP |
| Woodlands Court | TN4 0NY |
Transport near Southborough North
- FAQ
- Price Paid By Year
- Property Type Price
Frequently asked questions about Southborough North
What is the average price for a property for sale in Southborough North?
The average price for a property for sale in Southborough North is £565,959. This amount is 7% higher than the average price in Tunbridge Wells. There are 2,466 property listings for sale in Southborough North.
What streets have the most expensive properties for sale in Southborough North?
The streets with the most expensive properties for sale in Southborough North are Darnley Drive at an average of £1,525,000, The Common at an average of £1,470,000 and St Andrews Park Road at an average of £1,275,000.
What streets have the most affordable properties for sale in Southborough North?
The streets with the most affordable properties for sale in Southborough North are Salomons Grove at an average of £176,691, Hythe Close at an average of £180,000 and Victoria Road at an average of £213,500.
Which train stations are available in or near Southborough North?
Some of the train stations available in or near Southborough North are High Brooms, Tonbridge and Tunbridge Wells.
Property Price Paid in Southborough North by Year
The average sold property price by year was:
| Year | Average Sold Price | Price Change |
Sold Properties
|
|---|---|---|---|
| 2025 | £574,177 | 7% |
49 Properties |
| 2024 | £534,838 | -11% |
71 Properties |
| 2023 | £592,928 | -10% |
67 Properties |
| 2022 | £650,676 | 19% |
92 Properties |
| 2021 | £524,768 | 16% |
130 Properties |
| 2020 | £441,163 | -6% |
83 Properties |
| 2019 | £465,910 | -10% |
119 Properties |
| 2018 | £511,955 | 10% |
78 Properties |
| 2017 | £459,926 | 7% |
84 Properties |
| 2016 | £427,552 | 6% |
85 Properties |
| 2015 | £403,310 | 7% |
81 Properties |
| 2014 | £373,299 | -14% |
94 Properties |
| 2013 | £424,162 | 14% |
83 Properties |
| 2012 | £366,265 | 14% |
66 Properties |
| 2011 | £315,767 | -3% |
72 Properties |
| 2010 | £325,873 | -8% |
73 Properties |
| 2009 | £350,457 | 9% |
53 Properties |
| 2008 | £320,200 | -5% |
61 Properties |
| 2007 | £336,076 | 9% |
89 Properties |
| 2006 | £306,246 | -5% |
95 Properties |
| 2005 | £320,620 | 12% |
87 Properties |
| 2004 | £283,482 | 12% |
82 Properties |
| 2003 | £249,833 | 11% |
82 Properties |
| 2002 | £223,555 | 9% |
87 Properties |
| 2001 | £203,117 | 23% |
75 Properties |
| 2000 | £157,320 | 12% |
71 Properties |
| 1999 | £138,206 | -11% |
119 Properties |
| 1998 | £153,776 | 21% |
72 Properties |
| 1997 | £122,118 | 19% |
87 Properties |
| 1996 | £98,642 | -18% |
71 Properties |
| 1995 | £116,125 | - |
74 Properties |
Property Price per Property Type in Southborough North
Here you can find historic sold price data in order to help with your property search.
The average Property Paid Price for specific property types in the last three years are:
| Property Type | Average Sold Price | Sold Properties |
|---|---|---|
| Semi Detached House | £506,140.00 | 34 Semi Detached Houses |
| Detached House | £944,658.00 | 63 Detached Houses |
| Terraced House | £511,058.00 | 25 Terraced Houses |
| Flat | £251,318.00 | 65 Flats |

