
Houses for sale & to rent in WF17 8NA, Floreat Close, Batley West, Batley
House Prices in WF17 8NA, Floreat Close, Batley West
Properties in WF17 8NA have no sales history available within the last 3 years. WF17 8NA is a postcode in Floreat Close located in Batley West, an area in Batley, Kirklees, with 4 households².
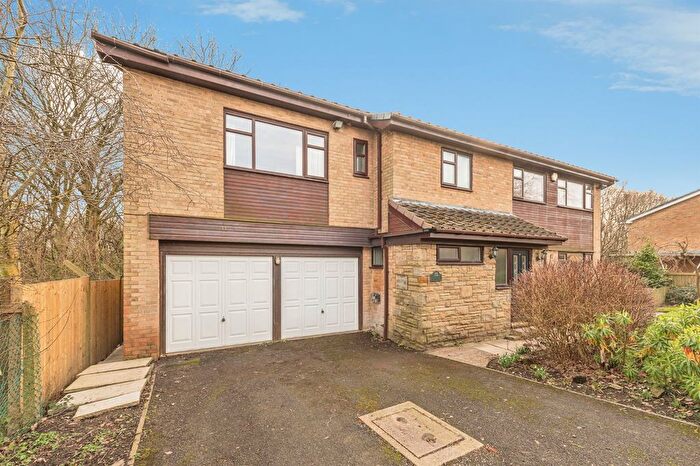
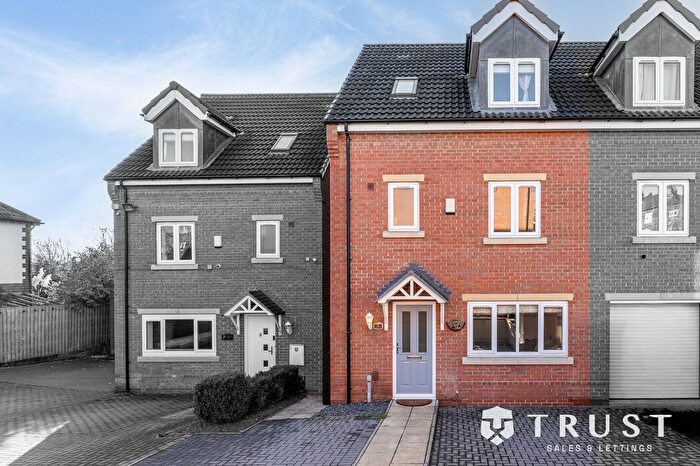
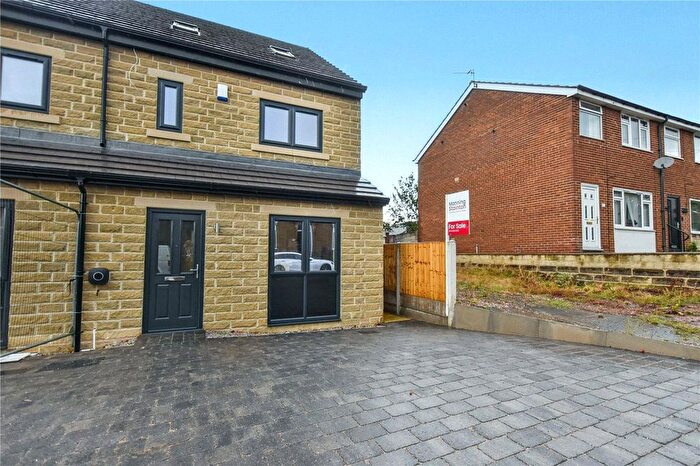
Properties for sale near WF17 8NA, Floreat Close
![]()
If you are looking to sell your house, let it out, or receive a property valuation, an expert can help you.
Click the button below to get started.
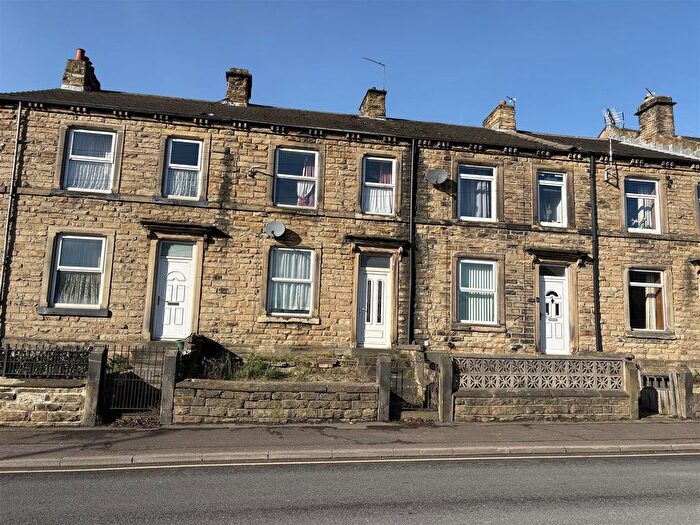
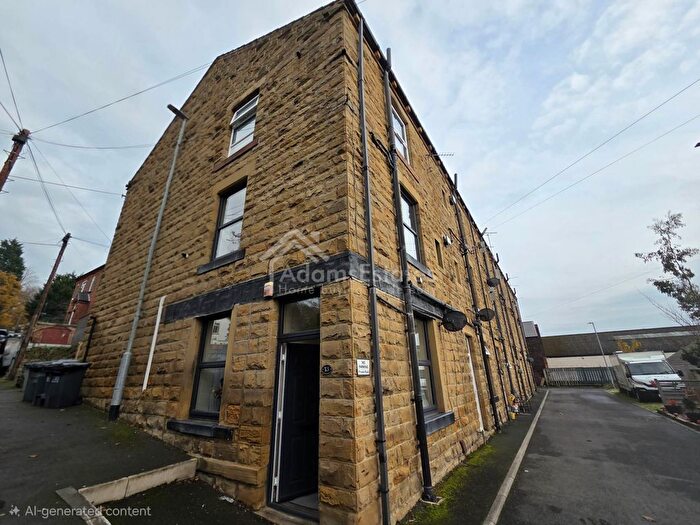
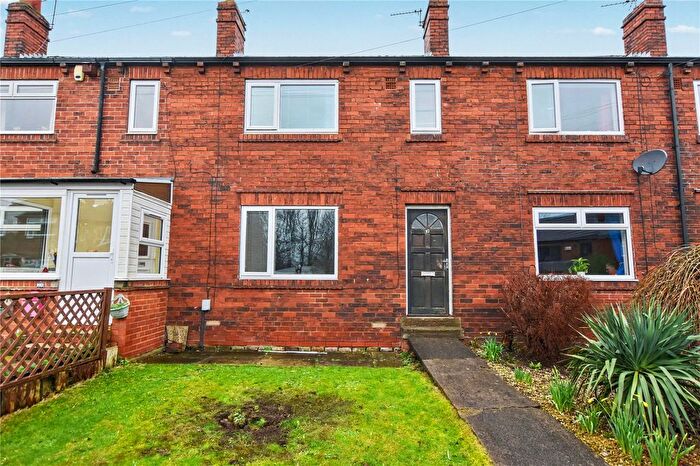
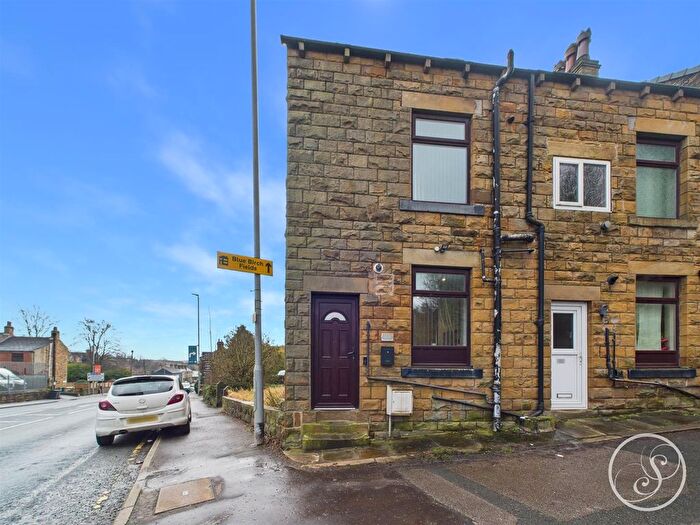

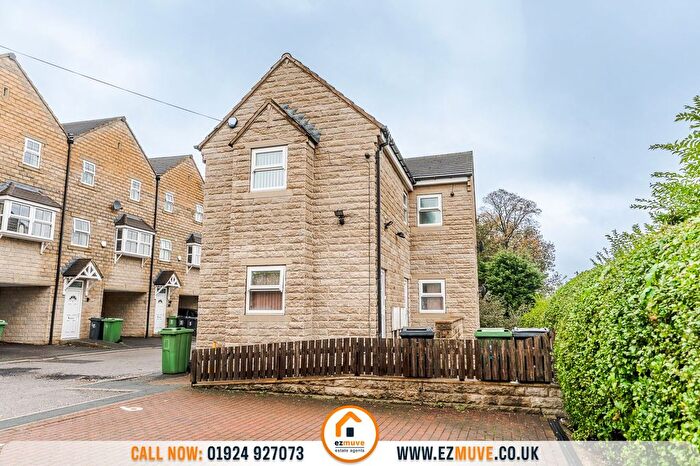
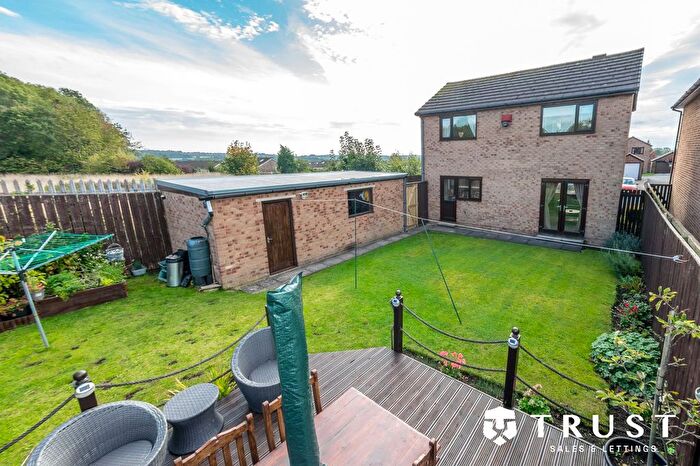
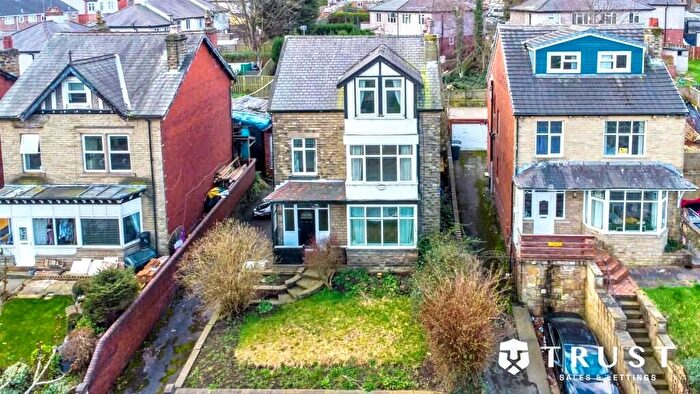
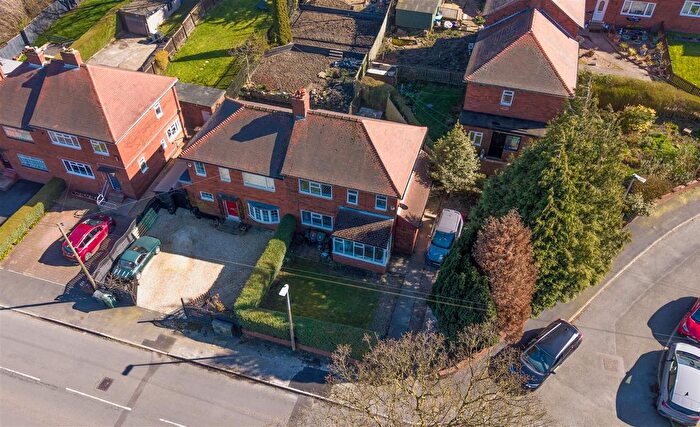
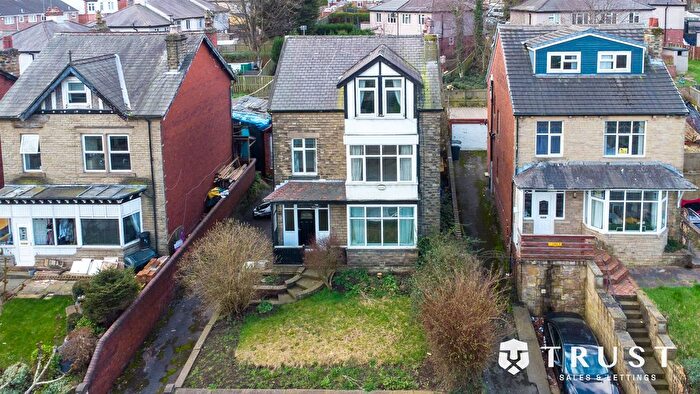
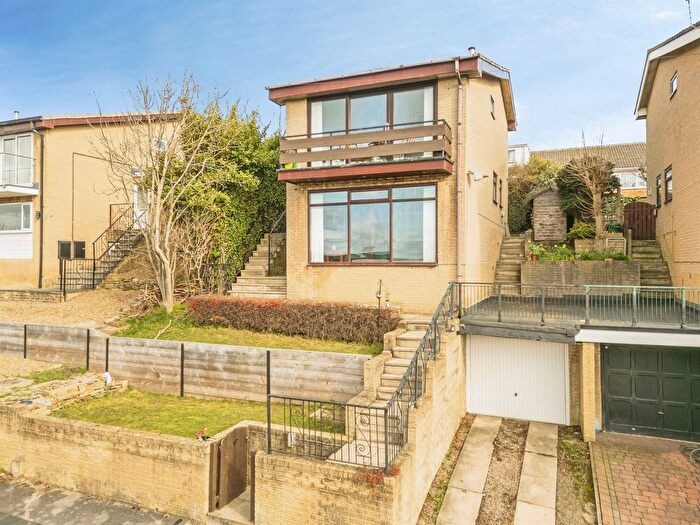
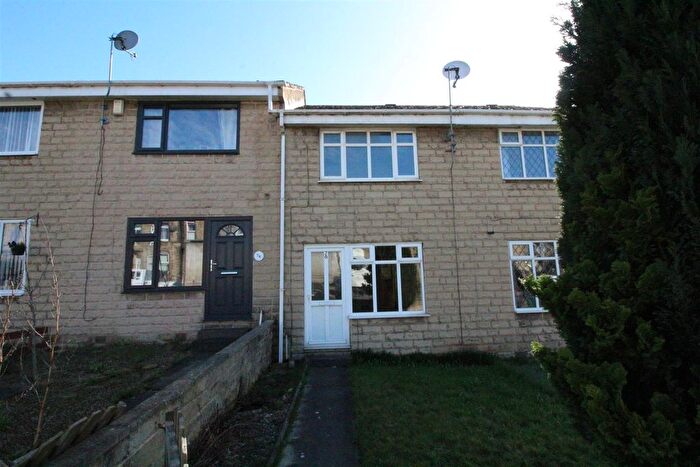
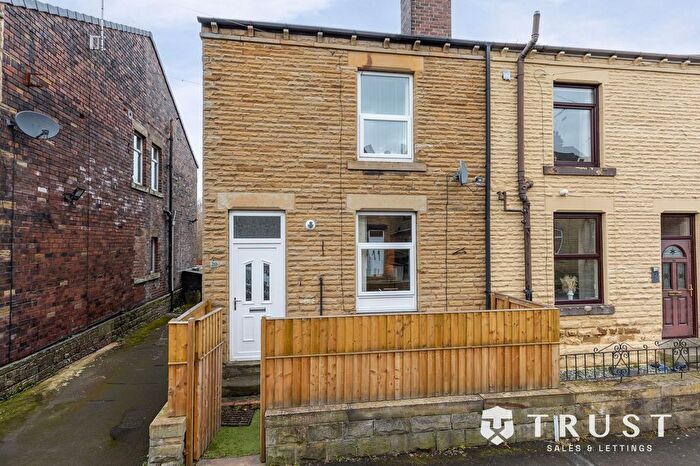
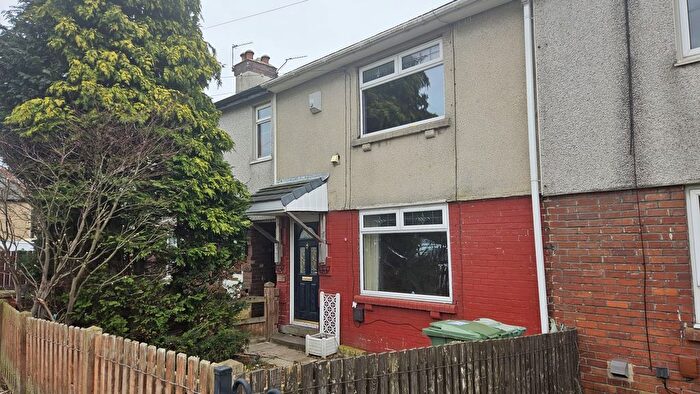
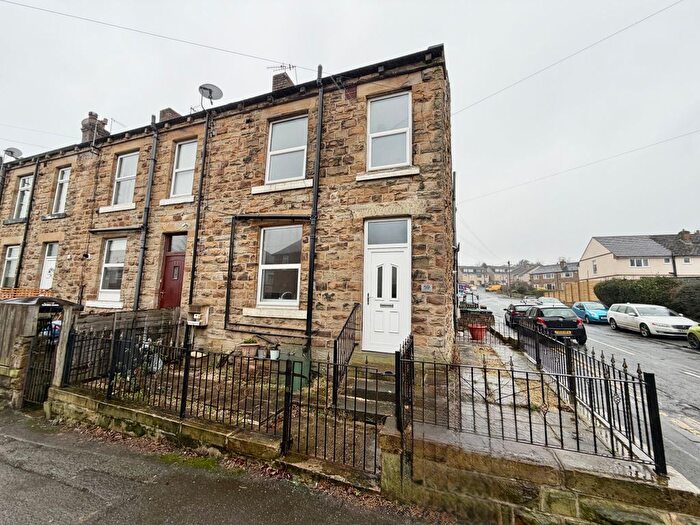
Previously listed properties near WF17 8NA, Floreat Close
Price Paid in Floreat Close, WF17 8NA, Batley West
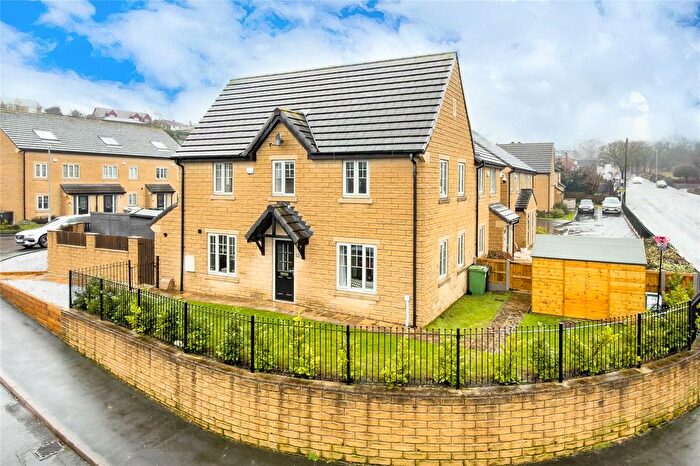
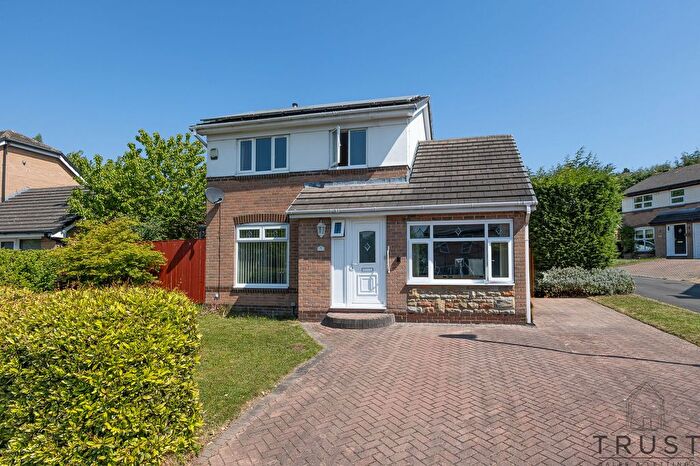
3 Floreat Close, WF17 8NA, Batley West Batley
Property 3 has been sold 2 times. The last time it was sold was in 04/03/2022 and the sold price was £225,000.00.
This detached house, sold as a freehold on 04/03/2022, is a 78 sqm detached house with an EPC rating of D.
| Date | Price | Property Type | Tenure | Classification |
|---|---|---|---|---|
| 04/03/2022 | £225,000.00 | Detached House | freehold | Established Building |
| 18/10/2002 | £120,000.00 | Detached House | freehold | Established Building |
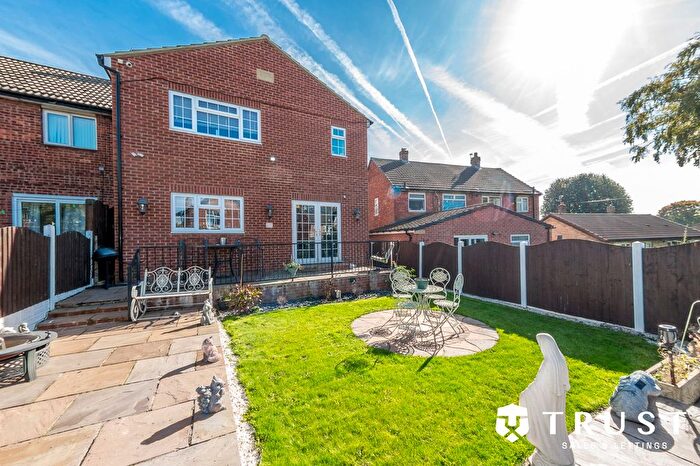
4 Floreat Close, WF17 8NA, Batley West Batley
Property 4 has been sold 3 times. The last time it was sold was in 01/04/2015 and the sold price was £164,000.00.
This detached house, sold as a freehold on 01/04/2015, is a 77 sqm detached house with an EPC rating of E.
| Date | Price | Property Type | Tenure | Classification |
|---|---|---|---|---|
| 01/04/2015 | £164,000.00 | Detached House | freehold | Established Building |
| 22/02/2012 | £158,000.00 | Semi Detached House | freehold | Established Building |
| 01/09/2006 | £158,000.00 | Semi Detached House | freehold | Established Building |
Transport near WF17 8NA, Floreat Close
-
 Batley Station
 -
Dewsbury Station
-
Morley Station
-
Ravensthorpe Station
-
Cottingley Station
-
Mirfield Station
-
Low Moor Station
House price paid reports for WF17 8NA, Floreat Close
Click on the buttons below to see price paid reports by year or property price:
- Price Paid By Year
Property Price Paid in WF17 8NA, Floreat Close by Year
The average sold property price by year was:
| Year | Average Sold Price | Price Change |
Sold Properties
|
|---|---|---|---|
| 2022 | £225,000 | 27% |
1 Property |
| 2015 | £164,000 | 4% |
1 Property |
| 2012 | £158,000 | - |
1 Property |
| 2006 | £158,000 | 24% |
1 Property |
| 2002 | £120,000 | - |
1 Property |