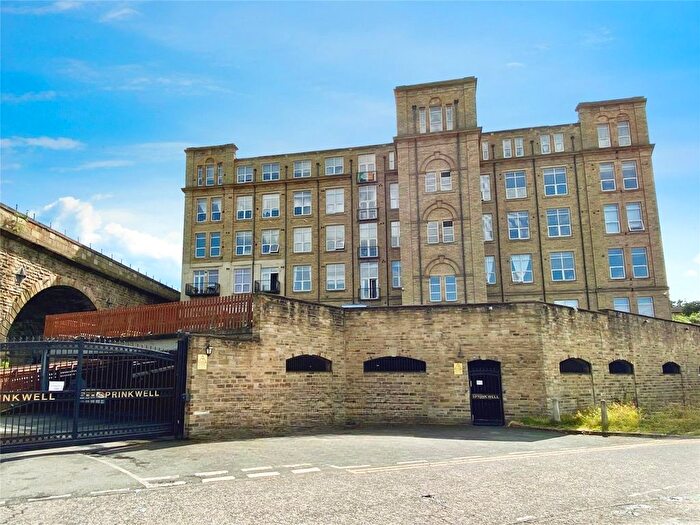
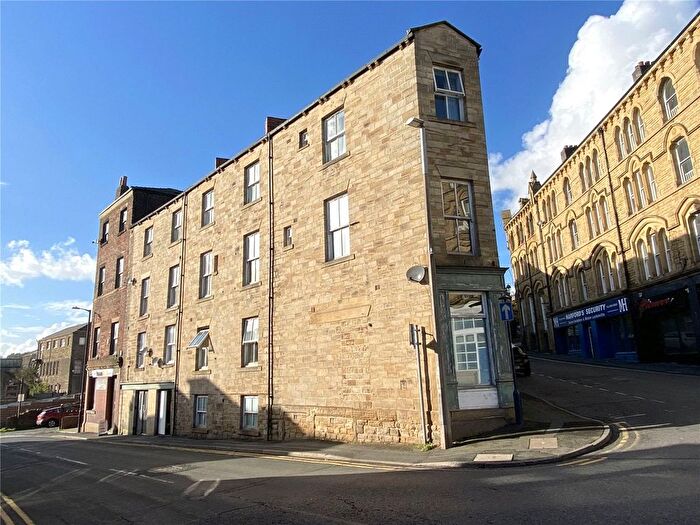
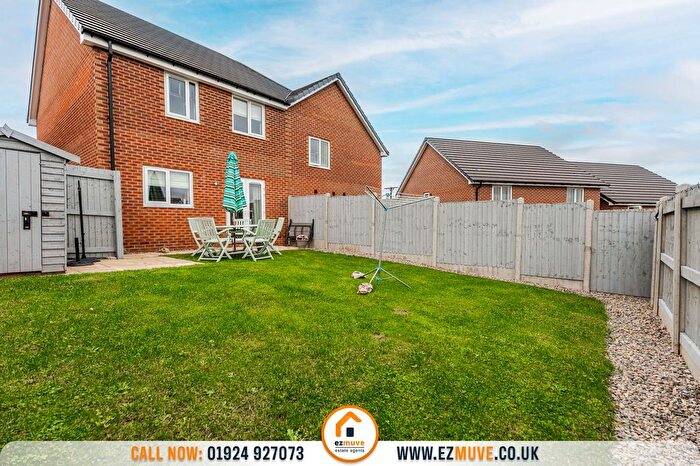
Houses for sale & to rent in Batley East, Dewsbury
House Prices in Batley East
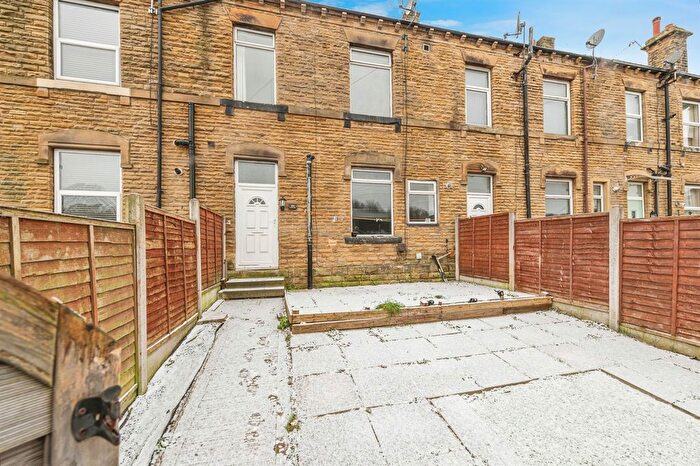
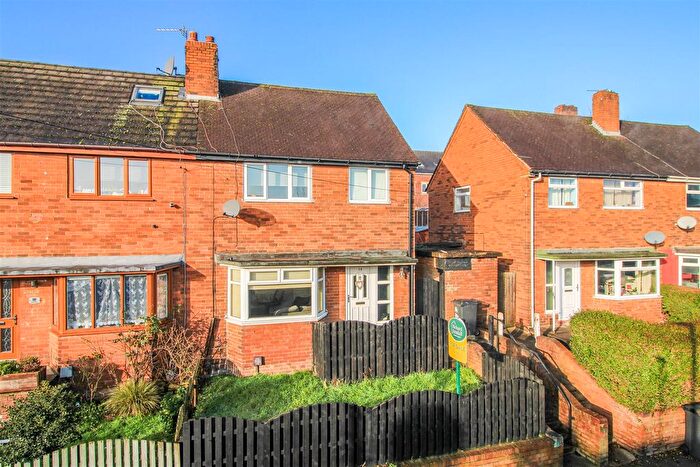
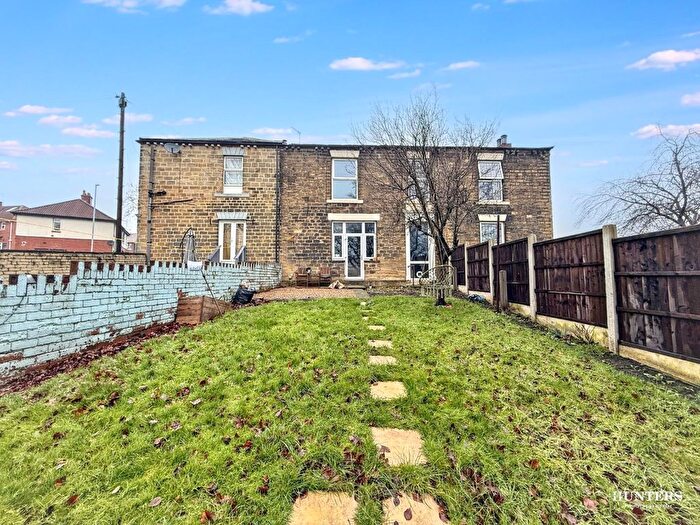
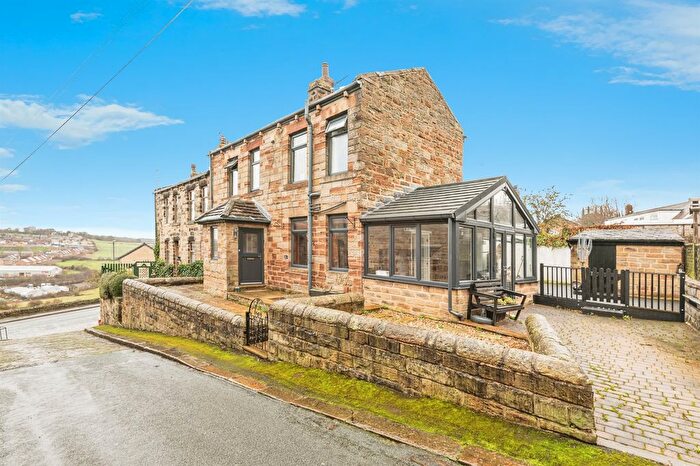
Properties in Batley East have an average house price of £162,399.00 and had 63 Property Transactions within the last 3 years¹.
Batley East is an area in Dewsbury, Kirklees with 866 households², where the most expensive property was sold for £630,000.00.
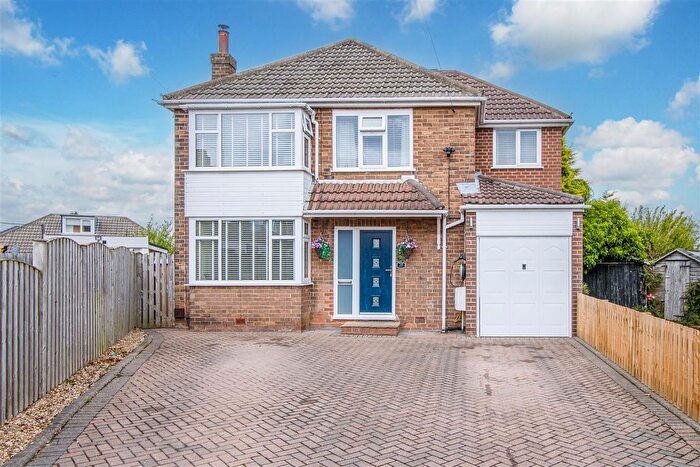
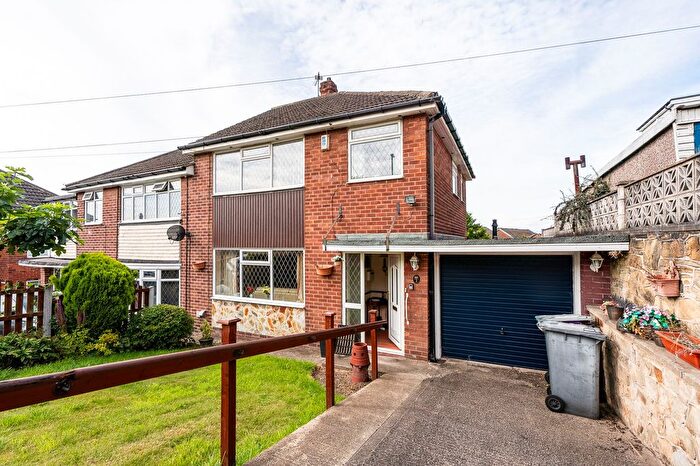
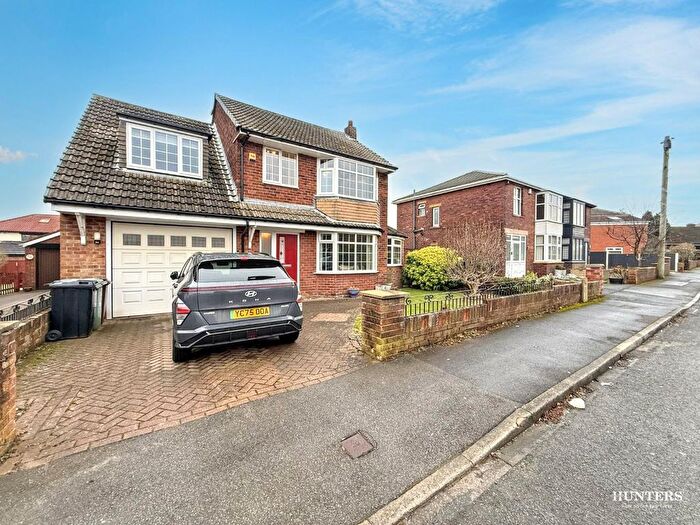
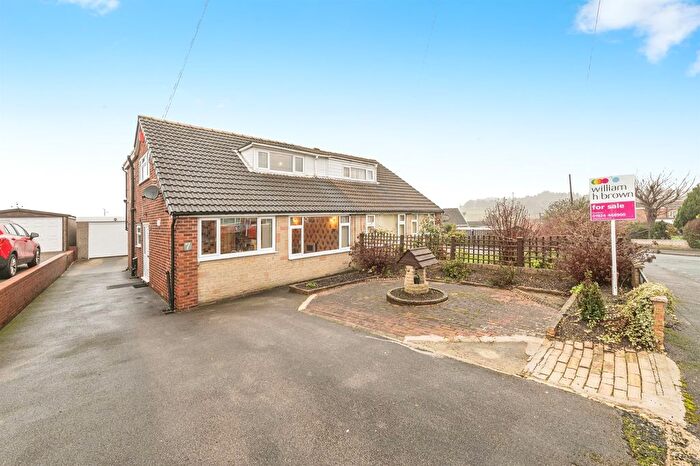
Properties for sale in Batley East
Roads and Postcodes in Batley East
Navigate through our locations to find the location of your next house in Batley East, Dewsbury for sale or to rent.
| Streets | Postcodes |
|---|---|
| Beckett Road | WF13 2DD WF13 2DB WF13 2LS |
| Boundary Terrace | WF13 4JH |
| Bradford Road | WF13 2HD WF13 2ET WF13 2HA WF17 6FF |
| Carlisle Close | WF13 2DN |
| Carr Street | WF13 2HF |
| David Lane | WF13 2HN |
| Dewsbury Road | WF12 7JE |
| Ellis Yard | WF13 2HW |
| Halifax Road | WF13 4JA WF13 4JD |
| Heybeck Lane | WF12 7QT WF12 7QU WF12 7QX WF12 7QY WF12 7QZ WF12 7RA |
| John Street | WF13 2HE |
| Leeds Road | WF12 7HU WF12 7HX WF12 7HY WF12 7JD WF12 7QR WF12 7QS WF12 7JB WF12 7RB |
| Lidgate Close | WF13 2DP |
| Lidgate Gardens | WF13 2BY WF13 2TA |
| Lidgate Lane | WF13 2BZ |
| Lower Peel Street | WF13 2EP |
| Marlborough Gardens | WF13 2LT |
| Marlborough Terrace | WF13 2DA |
| Mill Road | WF13 2HH WF13 2HL WF13 2TG WF13 2TQ |
| Milton Grove | WF13 2HJ |
| Mitchell Avenue | WF13 4JF |
| Naylor Street | WF13 2DF |
| North View Terrace | WF13 4JG |
| Quarry Lane | WF12 7JG WF12 7JJ |
| Rock Terrace | WF12 7JF |
| Rotary Close | WF13 2ES |
| Savile Street | WF13 2HB |
| South View Terrace | WF13 4JE |
| Tate Naylor Street | WF13 2DG |
| Textile Street | WF13 2EX WF13 2EY |
| The Sycamores | WF13 2LU |
| Town Street | WF13 2HG WF13 2HQ |
| Trinity Mount | WF13 2DE |
| Upper Road | WF13 2DH WF13 2DJ WF13 2DL WF13 2DQ WF13 2BH |
| Woodkirk Gardens | WF12 7HZ WF12 7JA |
Transport near Batley East
- FAQ
- Price Paid By Year
- Property Type Price
Frequently asked questions about Batley East
What is the average price for a property for sale in Batley East?
The average price for a property for sale in Batley East is £162,399. This amount is 8% lower than the average price in Dewsbury. There are 1,701 property listings for sale in Batley East.
What streets have the most expensive properties for sale in Batley East?
The streets with the most expensive properties for sale in Batley East are Halifax Road at an average of £485,000, Heybeck Lane at an average of £264,666 and Woodkirk Gardens at an average of £217,540.
What streets have the most affordable properties for sale in Batley East?
The streets with the most affordable properties for sale in Batley East are Rotary Close at an average of £70,250, Mill Road at an average of £75,000 and Textile Street at an average of £75,725.
Which train stations are available in or near Batley East?
Some of the train stations available in or near Batley East are Batley, Dewsbury and Ravensthorpe.
Property Price Paid in Batley East by Year
The average sold property price by year was:
| Year | Average Sold Price | Price Change |
Sold Properties
|
|---|---|---|---|
| 2025 | £179,321 | 12% |
14 Properties |
| 2024 | £157,924 | 1% |
27 Properties |
| 2023 | £157,122 | 15% |
22 Properties |
| 2022 | £133,610 | -17% |
27 Properties |
| 2021 | £156,927 | 36% |
38 Properties |
| 2020 | £100,642 | -11% |
26 Properties |
| 2019 | £112,122 | -9% |
20 Properties |
| 2018 | £122,638 | -8% |
31 Properties |
| 2017 | £131,994 | 33% |
38 Properties |
| 2016 | £89,053 | -28% |
27 Properties |
| 2015 | £113,807 | -1% |
38 Properties |
| 2014 | £114,550 | 21% |
30 Properties |
| 2013 | £90,594 | -17% |
19 Properties |
| 2012 | £106,178 | -9% |
14 Properties |
| 2011 | £115,777 | -1% |
18 Properties |
| 2010 | £117,176 | -9% |
17 Properties |
| 2009 | £127,714 | 11% |
7 Properties |
| 2008 | £113,074 | -30% |
16 Properties |
| 2007 | £147,557 | 18% |
108 Properties |
| 2006 | £121,539 | 8% |
153 Properties |
| 2005 | £111,678 | 13% |
19 Properties |
| 2004 | £96,636 | 12% |
30 Properties |
| 2003 | £85,442 | 12% |
28 Properties |
| 2002 | £75,188 | 23% |
31 Properties |
| 2001 | £58,061 | 7% |
29 Properties |
| 2000 | £54,076 | -23% |
26 Properties |
| 1999 | £66,551 | 25% |
23 Properties |
| 1998 | £49,780 | 19% |
26 Properties |
| 1997 | £40,098 | 6% |
17 Properties |
| 1996 | £37,830 | -7% |
15 Properties |
| 1995 | £40,505 | - |
21 Properties |
Property Price per Property Type in Batley East
Here you can find historic sold price data in order to help with your property search.
The average Property Paid Price for specific property types in the last three years are:
| Property Type | Average Sold Price | Sold Properties |
|---|---|---|
| Semi Detached House | £226,997.00 | 21 Semi Detached Houses |
| Detached House | £280,171.00 | 7 Detached Houses |
| Terraced House | £144,000.00 | 12 Terraced Houses |
| Flat | £77,173.00 | 23 Flats |

