
Houses for sale in Holmfirth, Kirklees
House Prices in Holmfirth
Properties in Holmfirth have an average house price of £298k and had 1,705 Property Transactions within the last 3 years.¹
Holmfirth is an area in Kirklees with 15,572 households², where the most expensive property was sold for £1.6M.
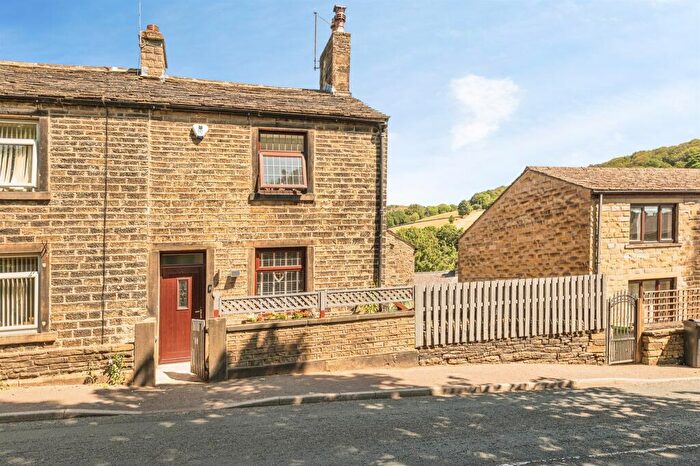
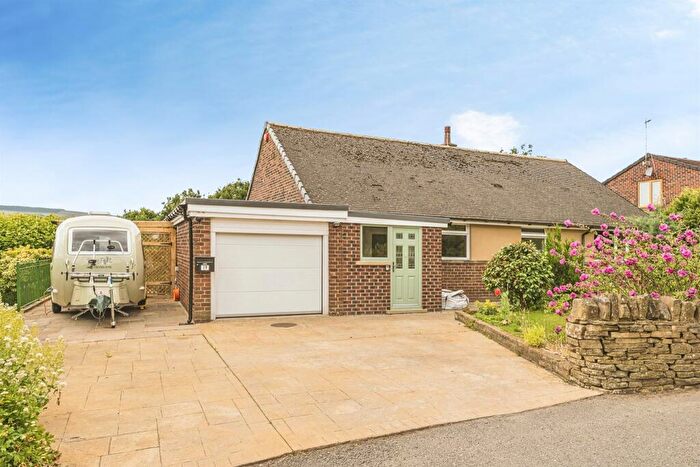
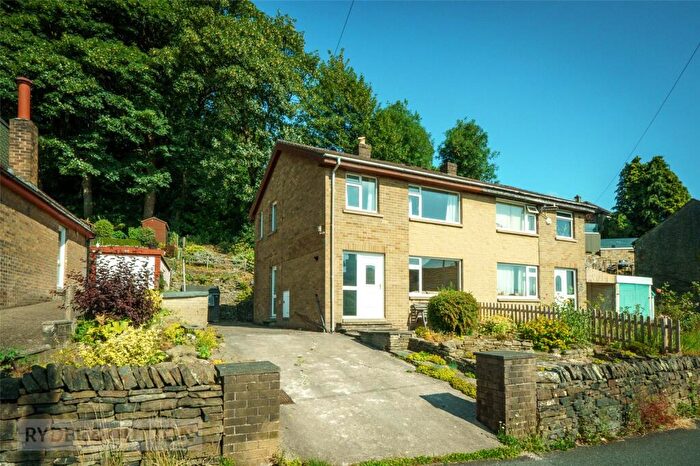
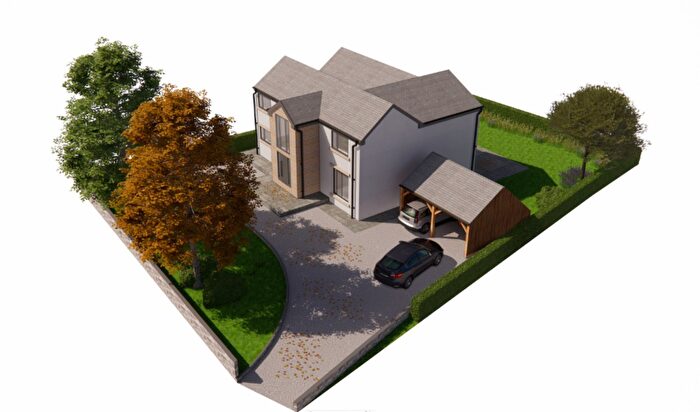
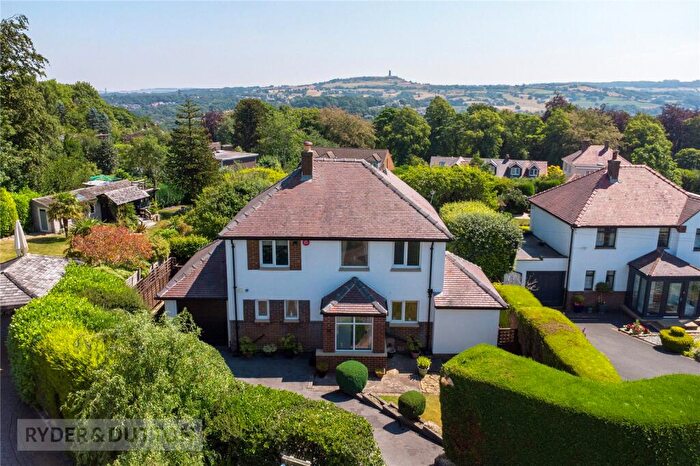
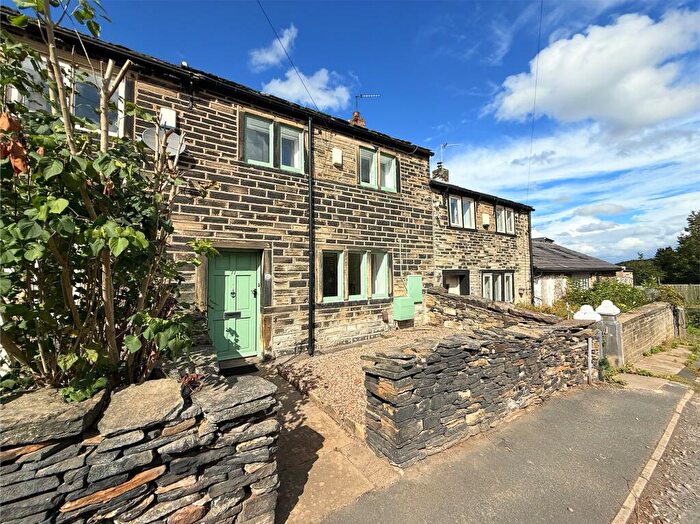
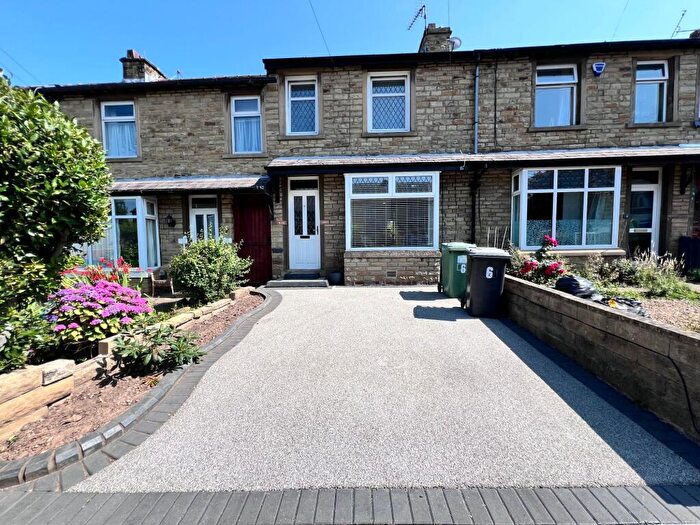
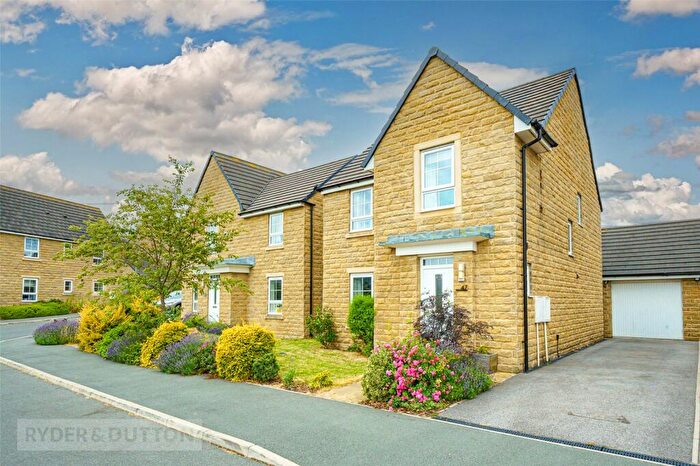
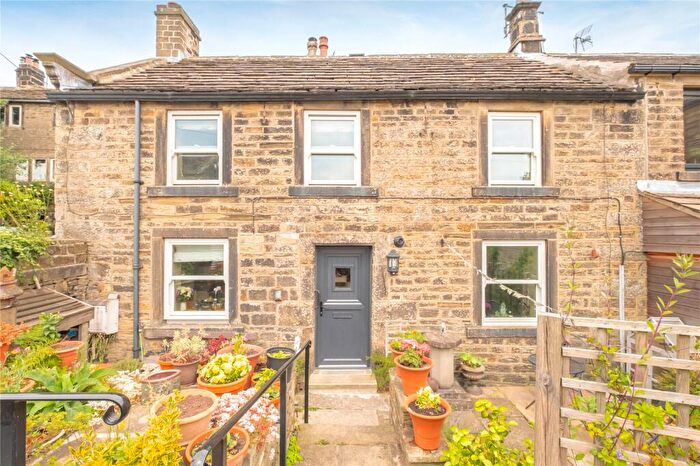
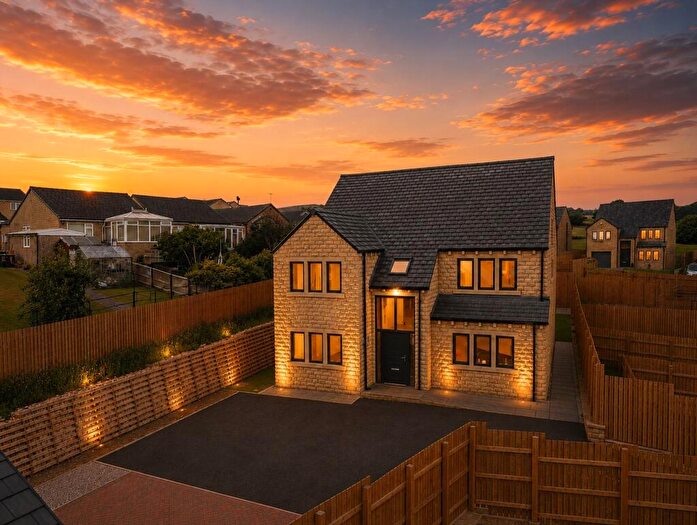
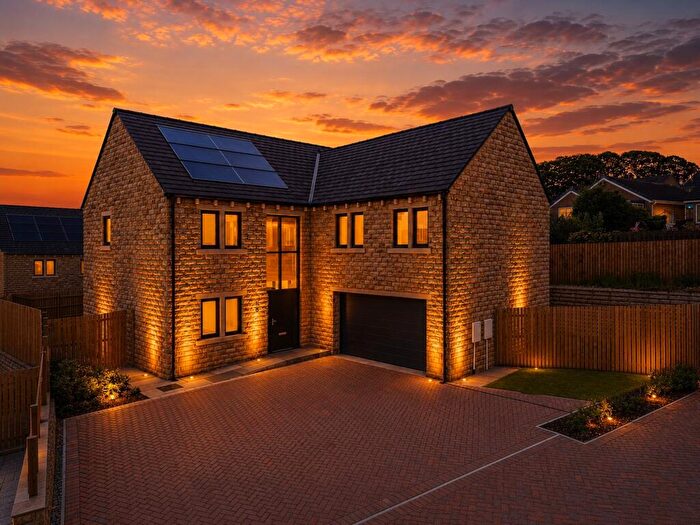
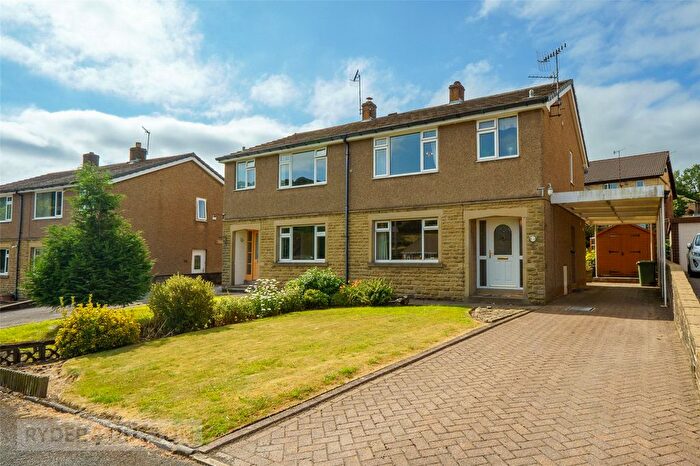
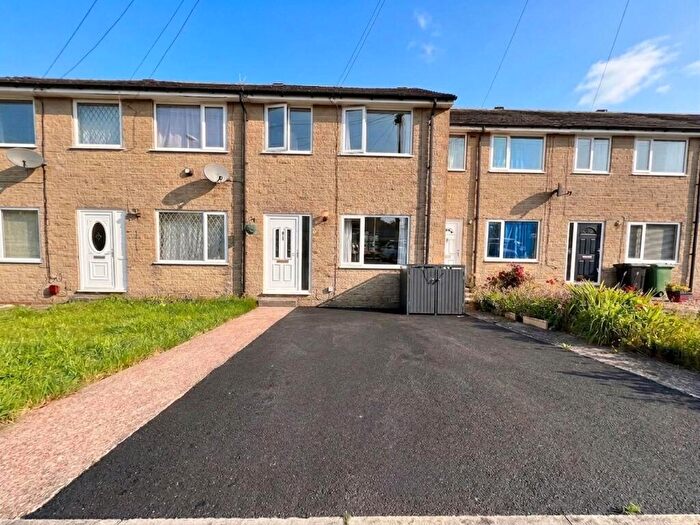
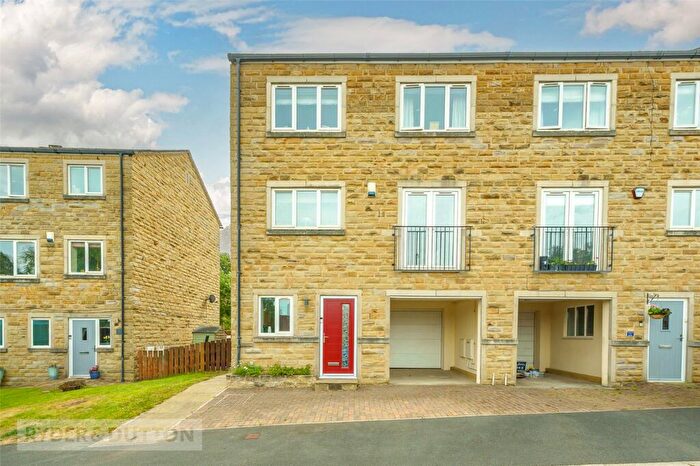
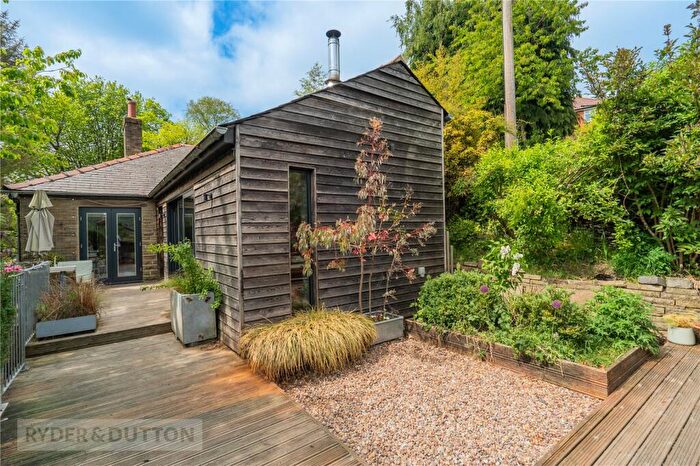
Properties for sale in Holmfirth
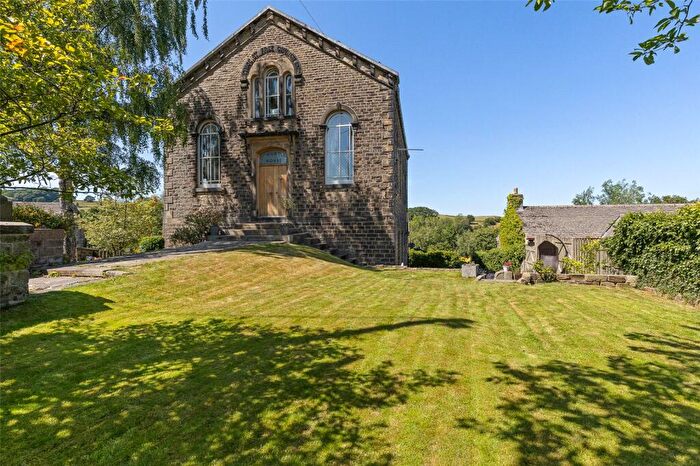
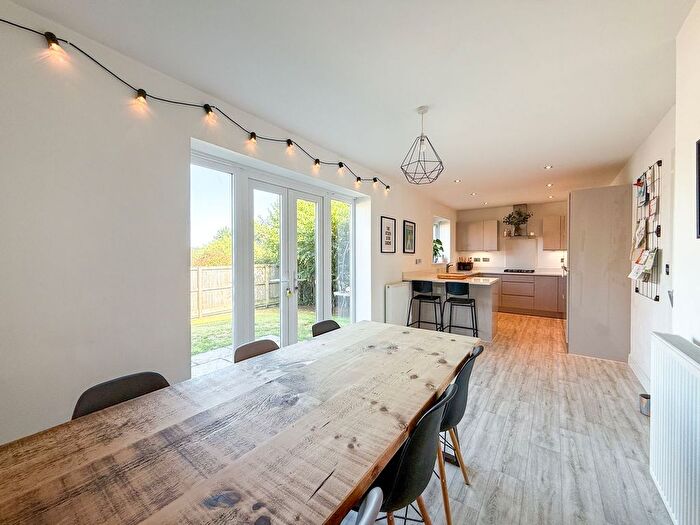

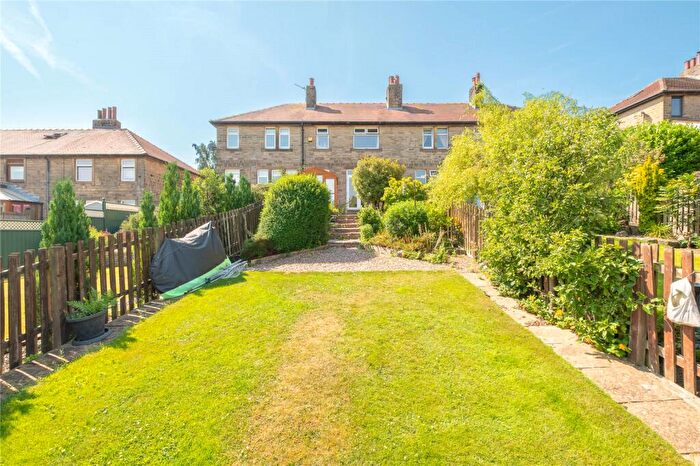
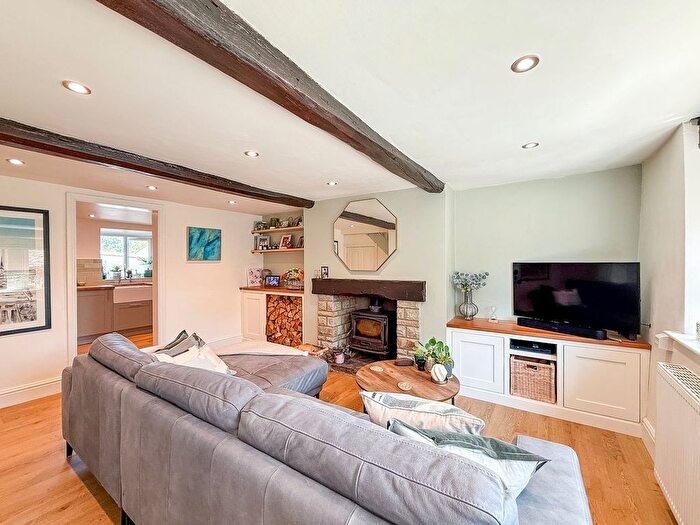
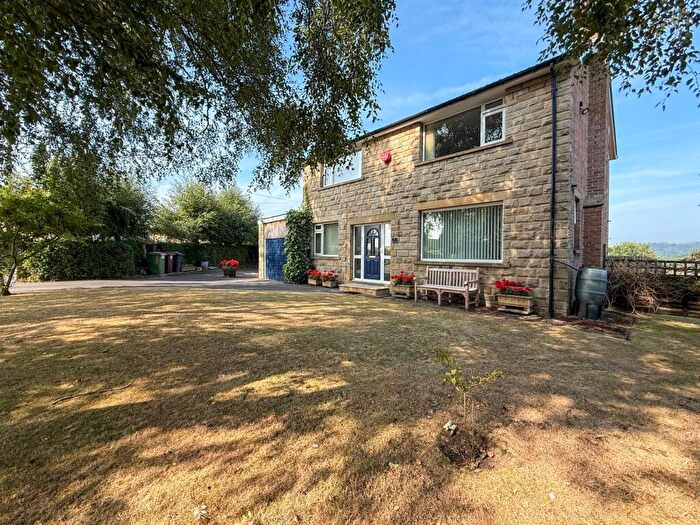
![]()
If you are looking to sell your house, let it out, or receive a property valuation, an expert can help you.
Click the button below to get started.
Neighbourhoods in Holmfirth
Navigate through our locations to find the location of your next house in Holmfirth, Kirklees for sale or to rent.
Property price trends in Holmfirth
According to the latest Land Registry data, the average home in Holmfirth sold for £291,715 in 2026. That figure comes from a substantial record of 20,124 sales logged over the past 31 years.
Prices have moved up over the last three years. Compared with 2023, when the typical sale came in around £279,635, that's a rise of roughly 4.3%.
Looking back five years, average prices are down about 3.7% since 2021, a drop of around £11,142 in cash terms.
Zoom out to the past decade for the fuller picture. Back in 2016, homes here averaged £217,974, so the typical sold price has climbed about 33.8% since then, roughly 3% a year. Stretch the view to fifteen years and that annual pace holds at about 2.8%.
Frequently asked questions about Holmfirth
What is the average price for a property for sale in Holmfirth?
The average price for a property for sale in Holmfirth is £297,590. This amount is 35% higher than the average price in Kirklees. There are 9,304 property listings for sale in Holmfirth.
What locations have the most expensive properties for sale in Holmfirth?
The location with the most expensive properties for sale in Holmfirth is Holme Valley South at an average of £312,738.
What locations have the most affordable properties for sale in Holmfirth?
The location with the most affordable properties for sale in Holmfirth is Holme Valley North at an average of £279,794.
Which train stations are available in or near Holmfirth?
Some of the train stations available in or near Holmfirth are Brockholes, Honley and Berry Brow.
Property Price Paid in Holmfirth by Year
The average sold property price by year was:
| Year | Average Sold Price | Price Change |
Sold Properties
|
|---|---|---|---|
| 2026 | £291,715 | -4% |
40 Properties |
| 2025 | £304,612 | -1% |
559 Properties |
| 2024 | £307,320 | 9% |
584 Properties |
| 2023 | £279,635 | -5% |
522 Properties |
| 2022 | £293,945 | -3% |
627 Properties |
| 2021 | £302,857 | 12% |
729 Properties |
| 2020 | £266,717 | 11% |
702 Properties |
| 2019 | £237,541 | -1% |
735 Properties |
| 2018 | £239,255 | 4% |
709 Properties |
| 2017 | £229,086 | 5% |
652 Properties |
Property Price per Property Type in Holmfirth
Here you can find historic sold price data in order to help with your property search.
The average Property Paid Price for specific property types in the last three years are:
| Property Type | Average Sold Price | Sold Properties |
|---|---|---|
| Semi Detached House | £274,431.00 | 431 Semi Detached Houses |
| Terraced House | £214,486.00 | 679 Terraced Houses |
| Detached House | £460,256.00 | 493 Detached Houses |
| Flat | £162,442.00 | 102 Flats |
Transport in Holmfirth
Please see below transportation links in this area:
