
Houses for sale in Huddersfield, Kirklees
House Prices in Huddersfield
Properties in Huddersfield have an average house price of £218k and had 7,843 Property Transactions within the last 3 years.¹
Huddersfield is an area in Kirklees with 85,927 households², where the most expensive property was sold for £2.1M.
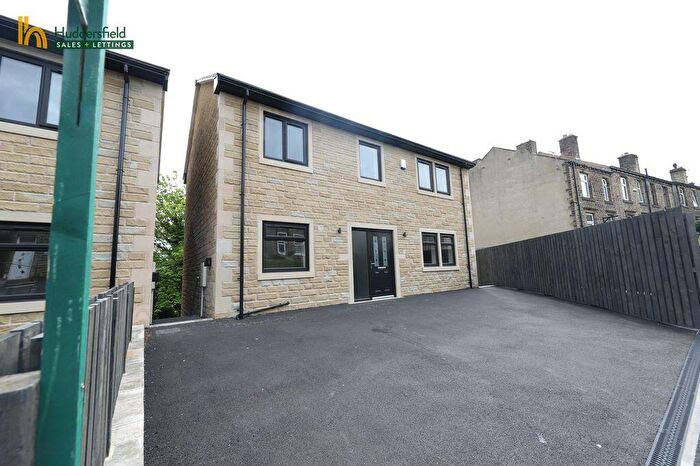
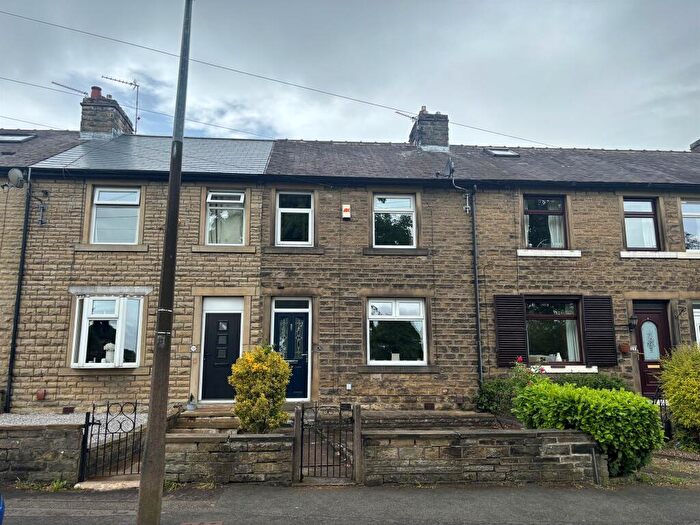
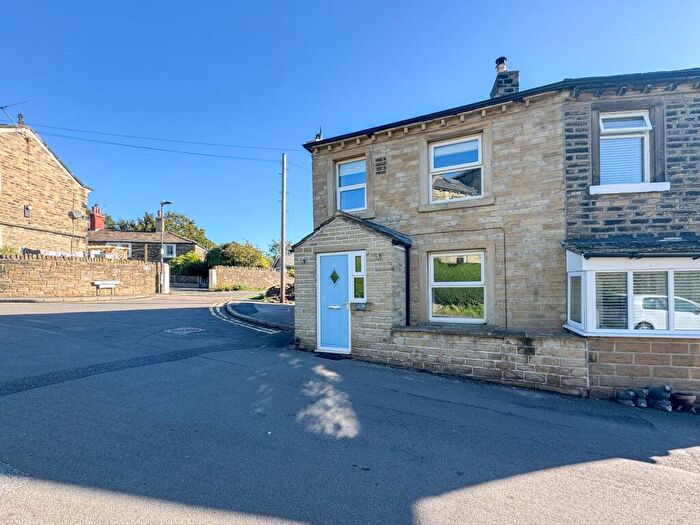
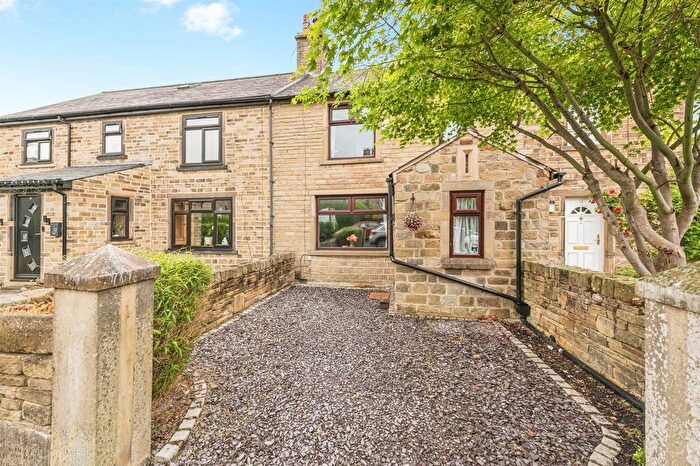
Properties for sale in Huddersfield
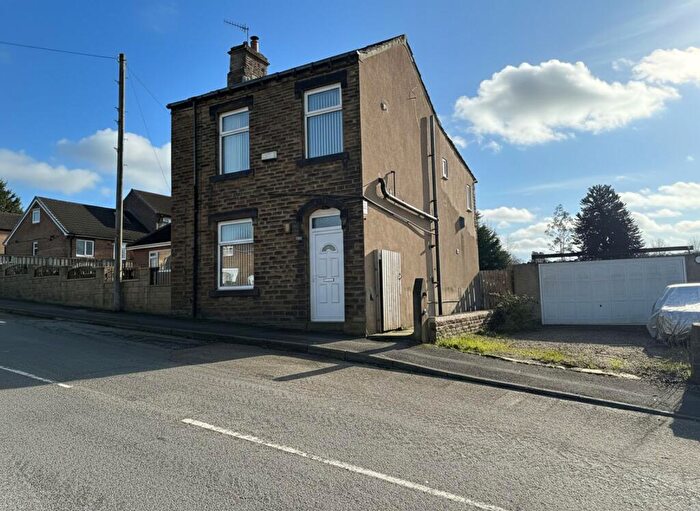
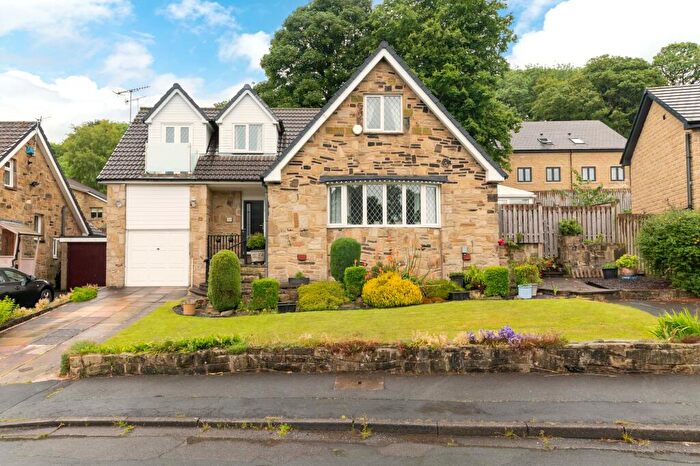
![]()
If you are looking to sell your house, let it out, or receive a property valuation, an expert can help you.
Click the button below to get started.

Neighbourhoods in Huddersfield
Navigate through our locations to find the location of your next house in Huddersfield, Kirklees for sale or to rent.
Property price trends in Huddersfield
According to the latest Land Registry data, the average home in Huddersfield sold for £235,146 in 2026. That figure comes from a substantial record of 99,450 sales logged over the past 31 years.
Prices have continued to climb over the last three years. Compared with 2023, when the typical sale came in around £210,864, that's a rise of roughly 11.5%.
Looking back five years, average prices are up about 14.1% since 2021, a gain of around £28,980 in cash terms.
Zoom out to the past decade for the fuller picture. Back in 2016, homes here averaged £160,963, so the typical sold price has climbed about 46.1% since then, roughly 3.9% a year. Stretch the view to fifteen years and that annual pace eases back to about 3.2%.
Frequently asked questions about Huddersfield
What is the average price for a property for sale in Huddersfield?
The average price for a property for sale in Huddersfield is £218,291. This amount is 1% lower than the average price in Kirklees. There are more than 10,000 property listings for sale in Huddersfield.
What locations have the most expensive properties for sale in Huddersfield?
The locations with the most expensive properties for sale in Huddersfield are Holme Valley South at an average of £565,000, Holme Valley North at an average of £483,999 and Kirkburton at an average of £323,279.
What locations have the most affordable properties for sale in Huddersfield?
The locations with the most affordable properties for sale in Huddersfield are Newsome at an average of £168,868, Crosland Moor And Netherton at an average of £172,548 and Greenhead at an average of £176,236.
Which train stations are available in or near Huddersfield?
Some of the train stations available in or near Huddersfield are Huddersfield, Lockwood and Berry Brow.
Property Price Paid in Huddersfield by Year
The average sold property price by year was:
| Year | Average Sold Price | Price Change |
Sold Properties
|
|---|---|---|---|
| 2026 | £235,146 | 3% |
160 Properties |
| 2025 | £228,433 | 6% |
2,408 Properties |
| 2024 | £215,404 | 2% |
2,656 Properties |
| 2023 | £210,864 | 2% |
2,619 Properties |
| 2022 | £206,703 | 0,3% |
3,036 Properties |
| 2021 | £206,166 | 9% |
3,791 Properties |
| 2020 | £188,464 | 4% |
2,862 Properties |
| 2019 | £180,098 | 3% |
3,224 Properties |
| 2018 | £175,567 | 5% |
3,348 Properties |
| 2017 | £167,390 | 4% |
3,281 Properties |
Property Price per Property Type in Huddersfield
Here you can find historic sold price data in order to help with your property search.
The average Property Paid Price for specific property types in the last three years are:
| Property Type | Average Sold Price | Sold Properties |
|---|---|---|
| Semi Detached House | £215,325.00 | 2,400 Semi Detached Houses |
| Terraced House | £155,671.00 | 3,471 Terraced Houses |
| Detached House | £399,590.00 | 1,498 Detached Houses |
| Flat | £118,895.00 | 474 Flats |
Transport in Huddersfield
Please see below transportation links in this area:
