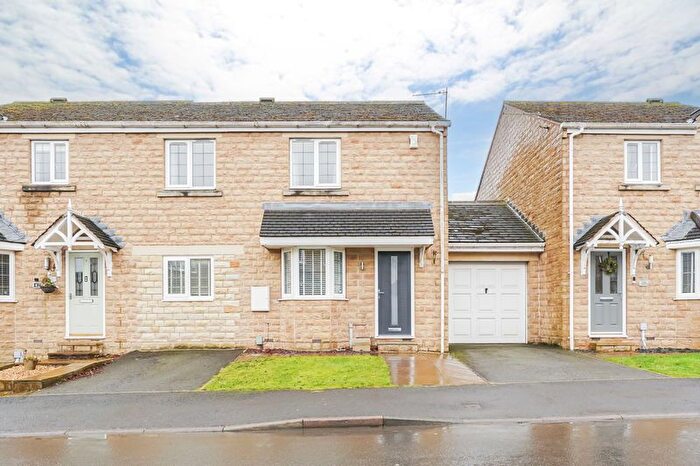
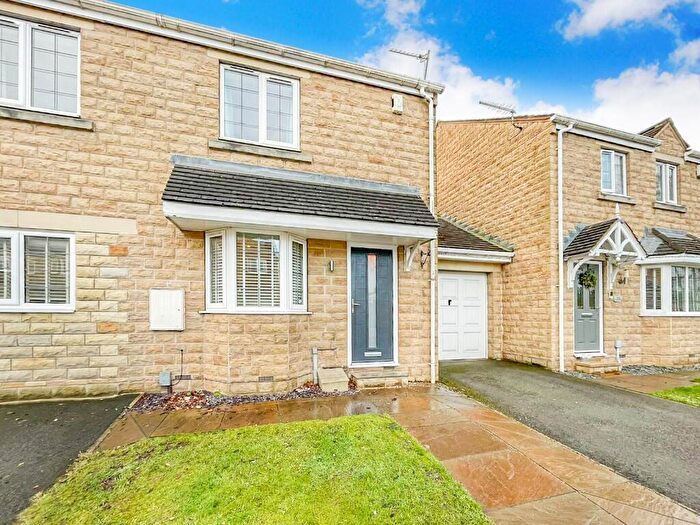
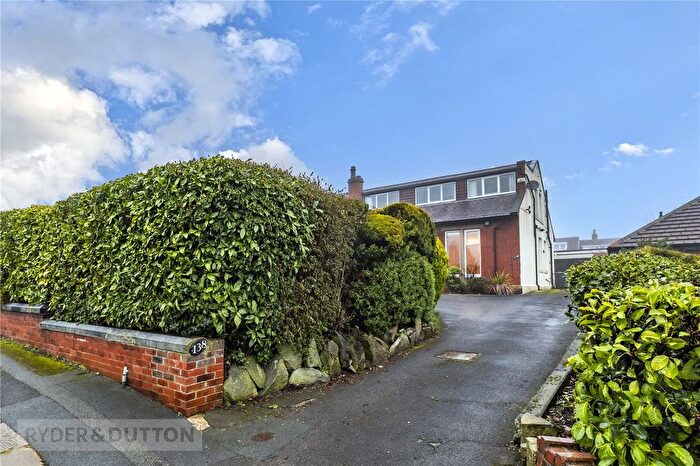
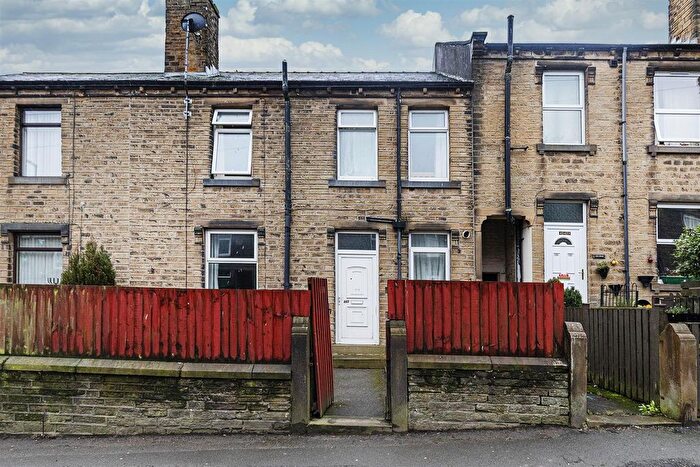
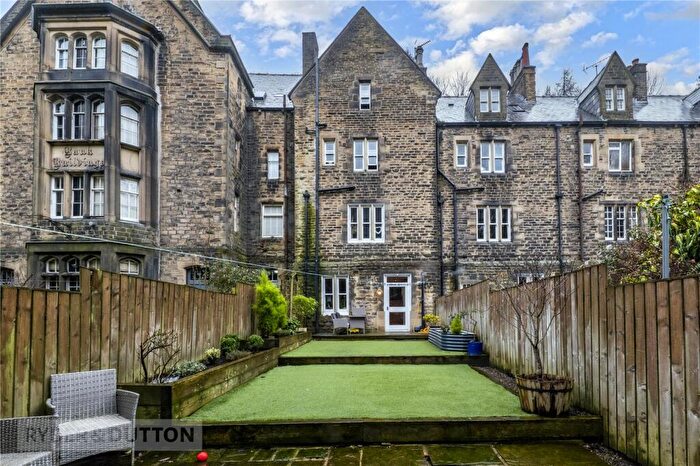
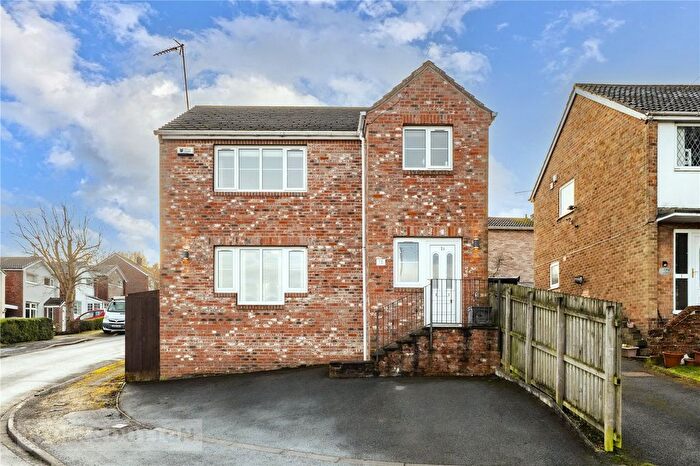
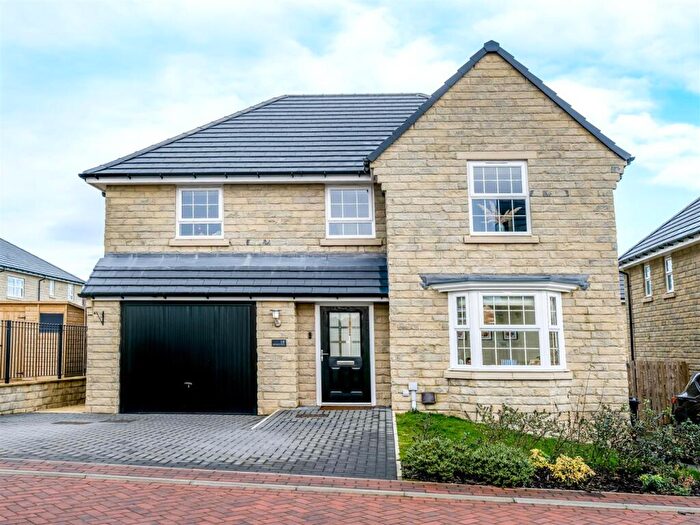
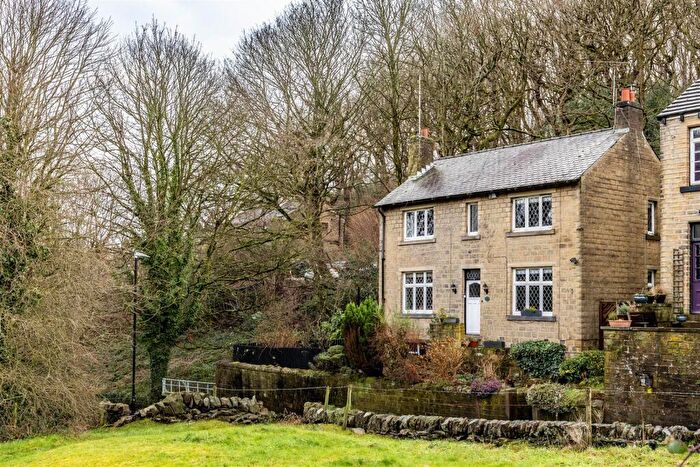
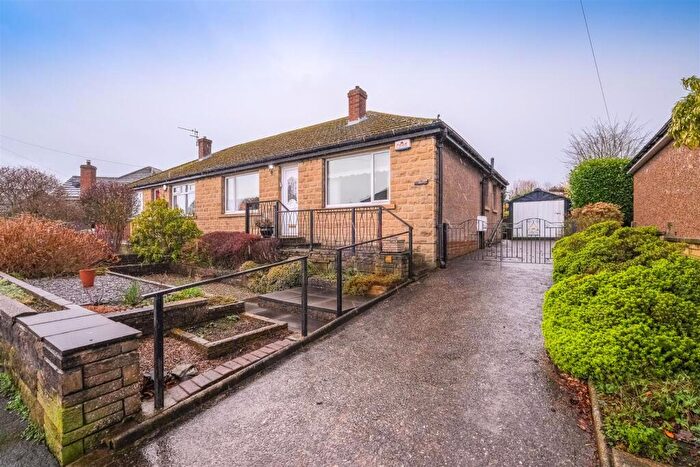
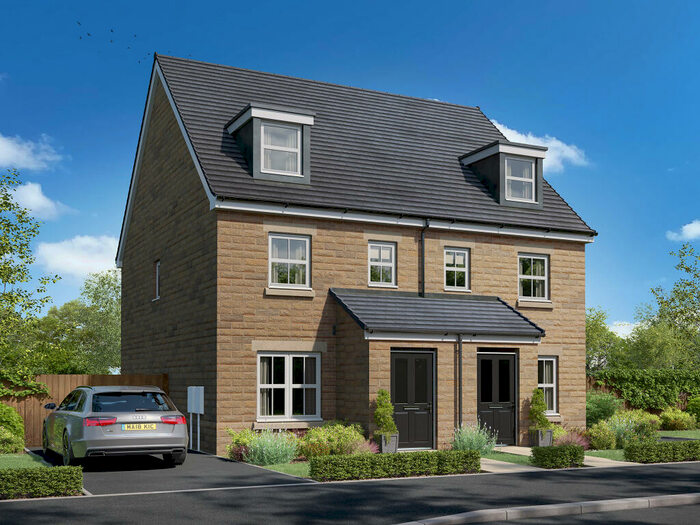
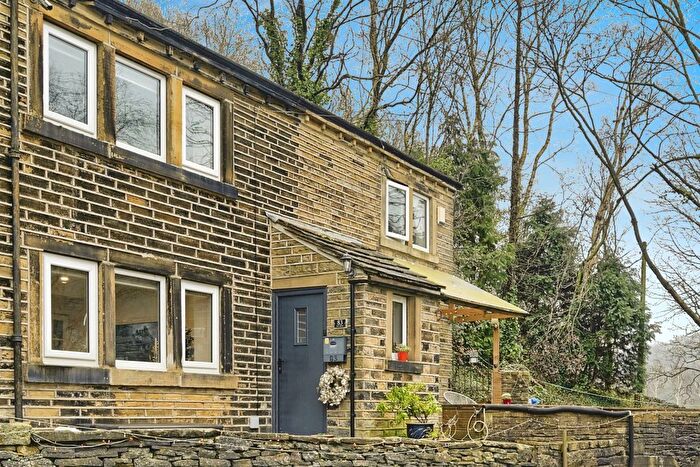
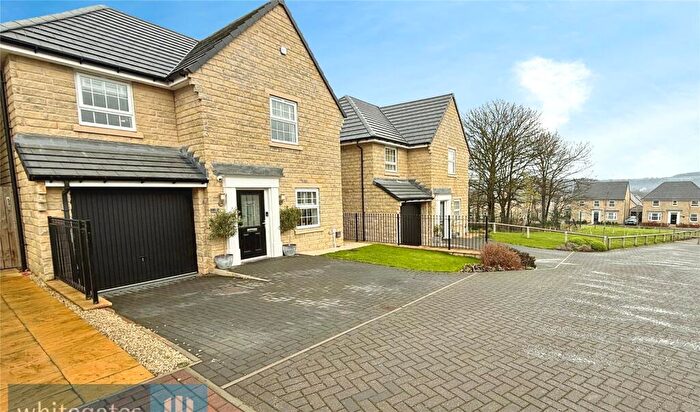
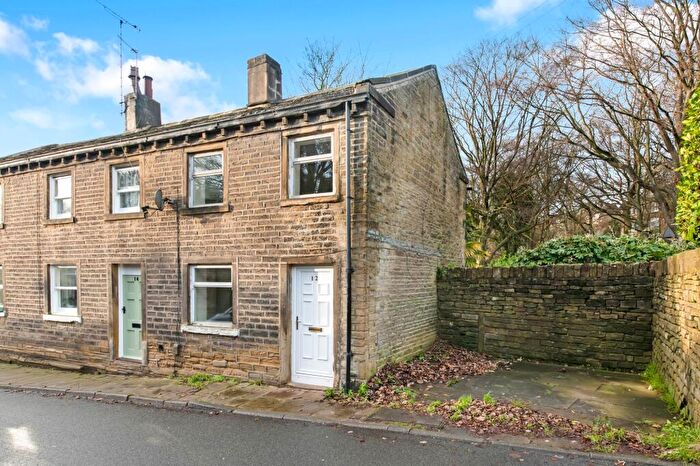
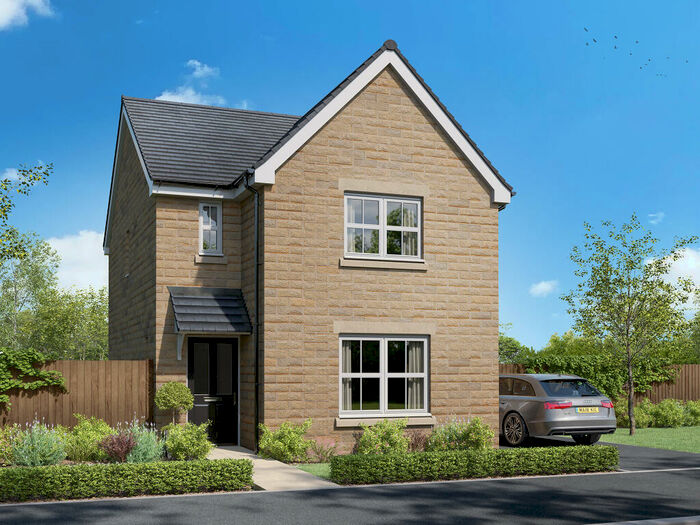
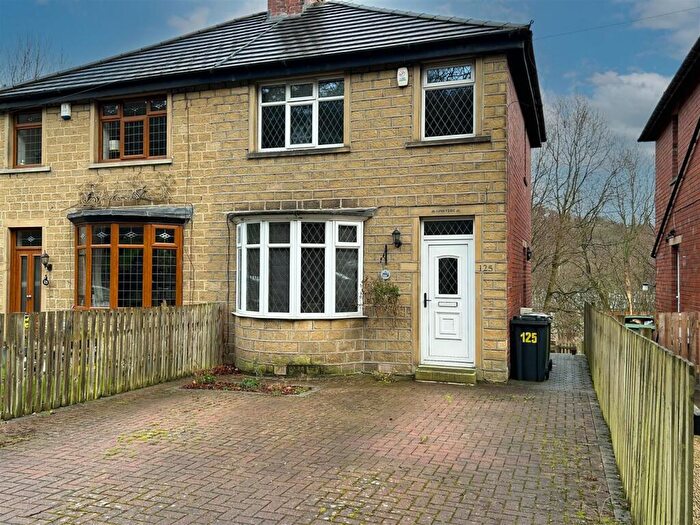
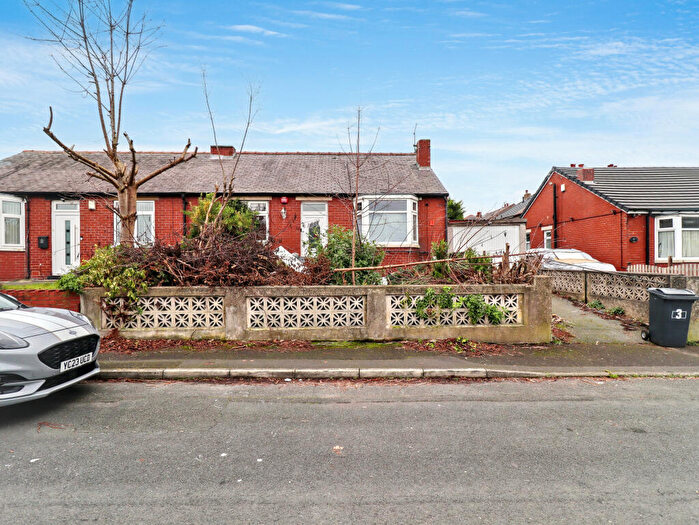
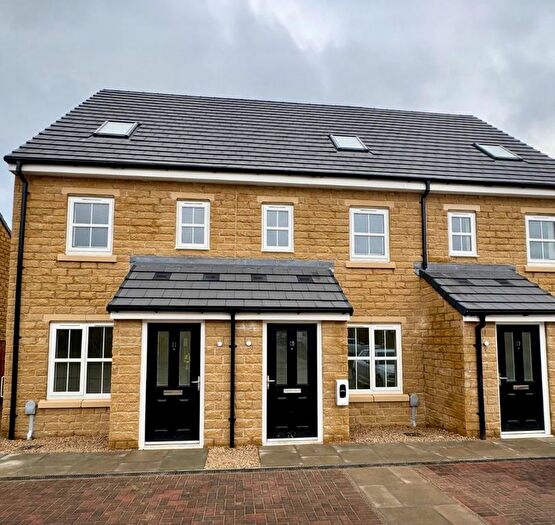
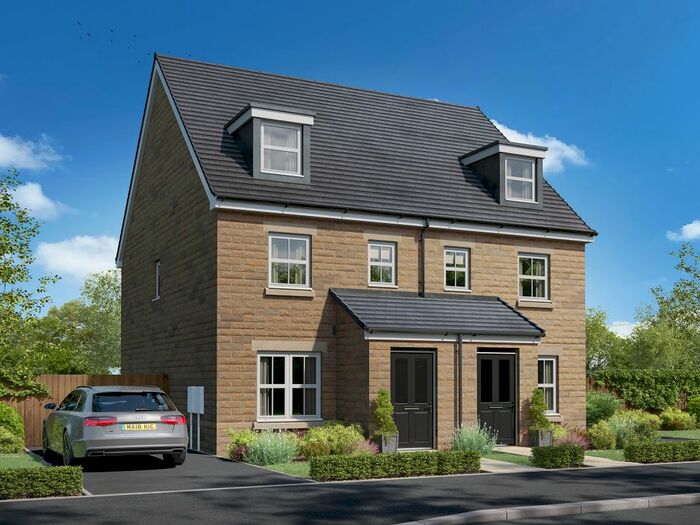
Houses for sale & to rent in Holme Valley North, Huddersfield
House Prices in Holme Valley North
Properties in Holme Valley North have an average house price of £483,999.00 and had 5 Property Transactions within the last 3 years¹.
Holme Valley North is an area in Huddersfield, Kirklees with 69 households², where the most expensive property was sold for £625,000.00.
Properties for sale in Holme Valley North
Roads and Postcodes in Holme Valley North
Navigate through our locations to find the location of your next house in Holme Valley North, Huddersfield for sale or to rent.
| Streets | Postcodes |
|---|---|
| Cocking Steps Lane | HD4 7BS HD4 7EA |
| Crosland Bank | HD4 7DF |
| Crosland Factory Lane | HD4 7DZ |
| Crosland Road Industrial Estate | HD4 7DQ |
| Fieldfare Close | HD4 7FA |
| Green Gate Lane | HD7 5LX |
| Healey Houses | HD4 7DG |
| Heron Close | HD4 7FE |
| Lea Lane | HD4 7DL |
| Moll Springs | HD4 7DN |
| Reservoir Side Road | HD7 5JW |
| Siskin Gardens | HD4 7FB |
| Wood Bottom Road | HD4 7DJ |
| Wrigley Court | HD4 7ED |
| HD4 6UP |
Transport near Holme Valley North
- FAQ
- Price Paid By Year
- Property Type Price
Frequently asked questions about Holme Valley North
What is the average price for a property for sale in Holme Valley North?
The average price for a property for sale in Holme Valley North is £483,999. This amount is 124% higher than the average price in Huddersfield. There are 1,296 property listings for sale in Holme Valley North.
What streets have the most expensive properties for sale in Holme Valley North?
The street with the most expensive properties for sale in Holme Valley North is Heron Close at an average of £625,000.
What streets have the most affordable properties for sale in Holme Valley North?
The street with the most affordable properties for sale in Holme Valley North is Siskin Gardens at an average of £446,999.
Which train stations are available in or near Holme Valley North?
Some of the train stations available in or near Holme Valley North are Berry Brow, Honley and Lockwood.
Property Price Paid in Holme Valley North by Year
The average sold property price by year was:
| Year | Average Sold Price | Price Change |
Sold Properties
|
|---|---|---|---|
| 2025 | £557,500 | 20% |
2 Properties |
| 2024 | £444,997 | 7% |
2 Properties |
| 2023 | £415,000 | -6% |
1 Property |
| 2022 | £440,000 | -44% |
1 Property |
| 2021 | £632,458 | 34% |
6 Properties |
| 2020 | £418,333 | 14% |
6 Properties |
| 2019 | £360,000 | -36% |
1 Property |
| 2018 | £490,000 | 21% |
1 Property |
| 2017 | £389,246 | -3% |
4 Properties |
| 2016 | £402,435 | -10% |
25 Properties |
| 2015 | £441,250 | -47% |
4 Properties |
| 2014 | £648,000 | 59% |
2 Properties |
| 2013 | £268,700 | -0,5% |
5 Properties |
| 2010 | £270,000 | -110% |
1 Property |
| 2009 | £567,500 | 56% |
2 Properties |
| 2008 | £249,500 | -112% |
1 Property |
| 2007 | £528,333 | -46% |
3 Properties |
| 2006 | £771,333 | 54% |
3 Properties |
| 2005 | £353,500 | 13% |
2 Properties |
| 2004 | £308,300 | -26% |
3 Properties |
| 2003 | £388,333 | 42% |
3 Properties |
| 2002 | £223,590 | 15% |
11 Properties |
| 2001 | £189,500 | 72% |
6 Properties |
| 1996 | £53,000 | - |
1 Property |
Property Price per Property Type in Holme Valley North
Here you can find historic sold price data in order to help with your property search.
The average Property Paid Price for specific property types in the last three years are:
| Property Type | Average Sold Price | Sold Properties |
|---|---|---|
| Detached House | £483,999.00 | 5 Detached Houses |

