
Houses for sale & to rent in L10 4XU, Sylvia Close, Cherryfield, Liverpool
House Prices in L10 4XU, Sylvia Close, Cherryfield
Properties in L10 4XU have no sales history available within the last 3 years. L10 4XU is a postcode in Sylvia Close located in Cherryfield, an area in Liverpool, Knowsley, with 2 households².
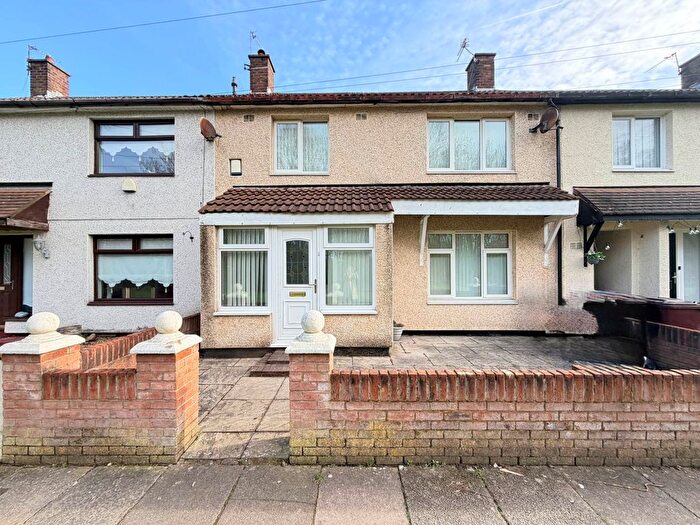
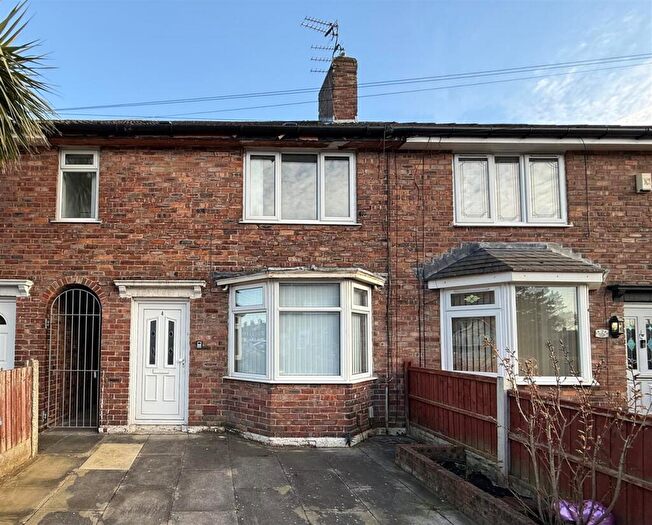
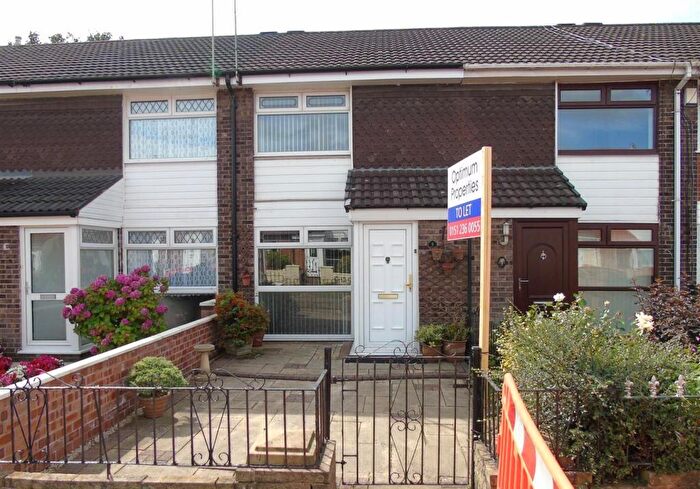
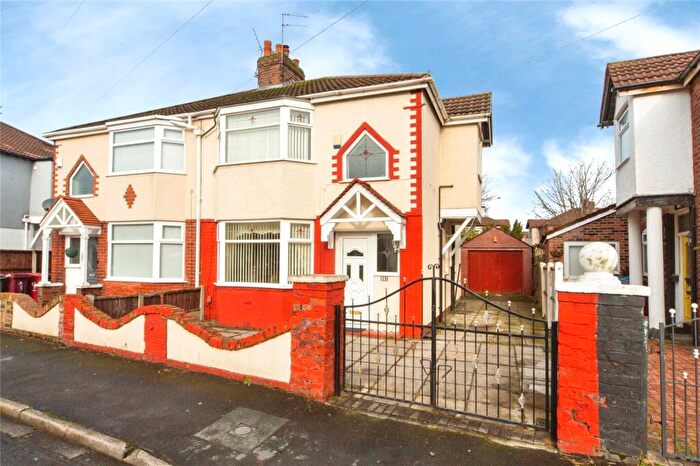
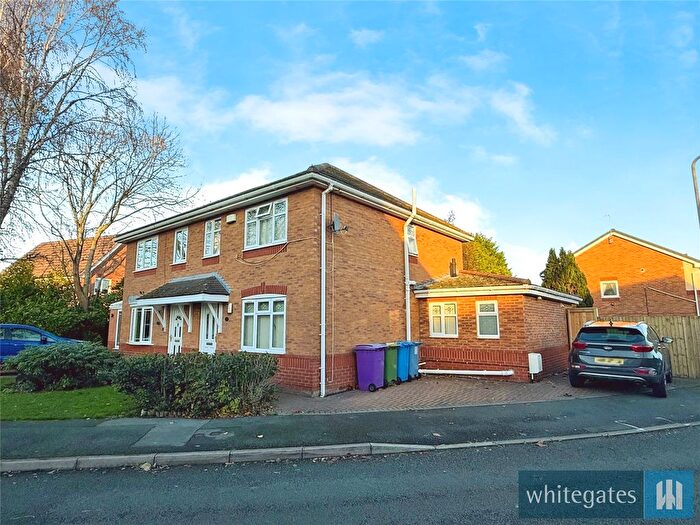
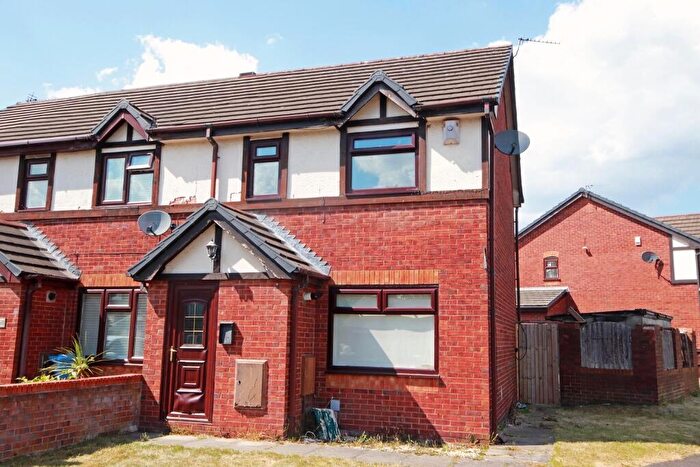
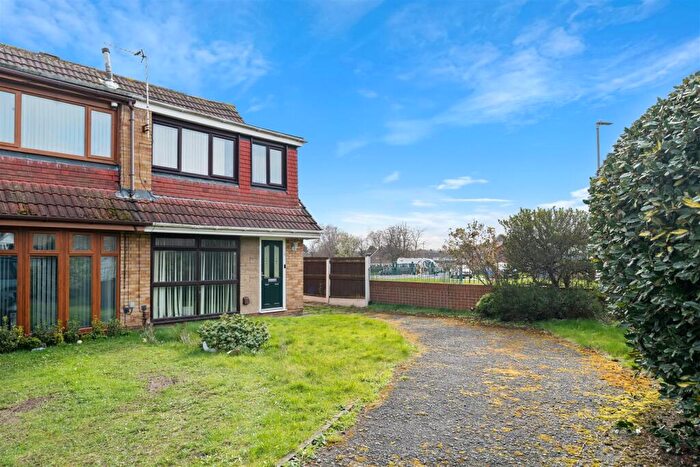
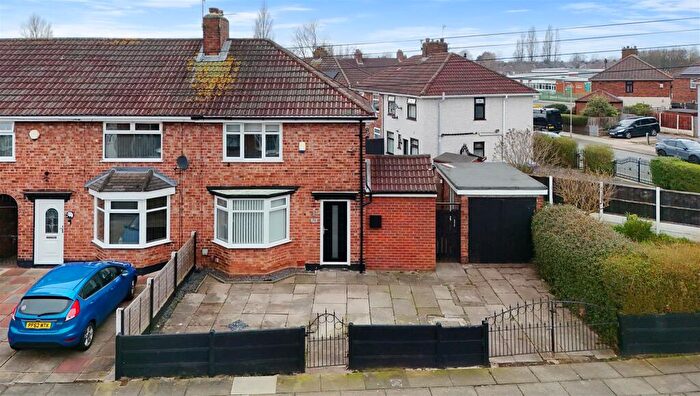
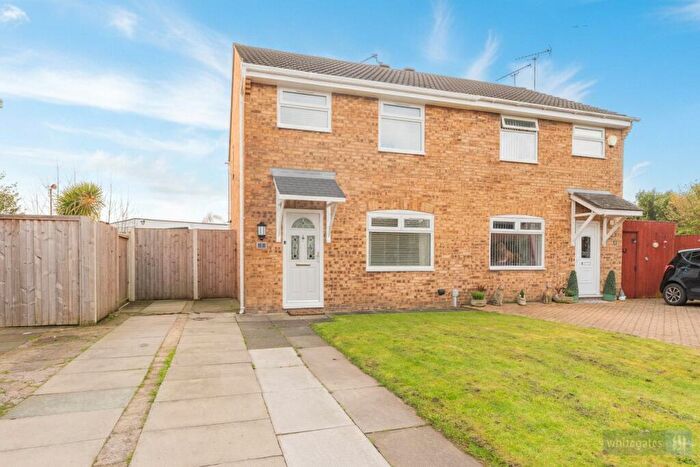
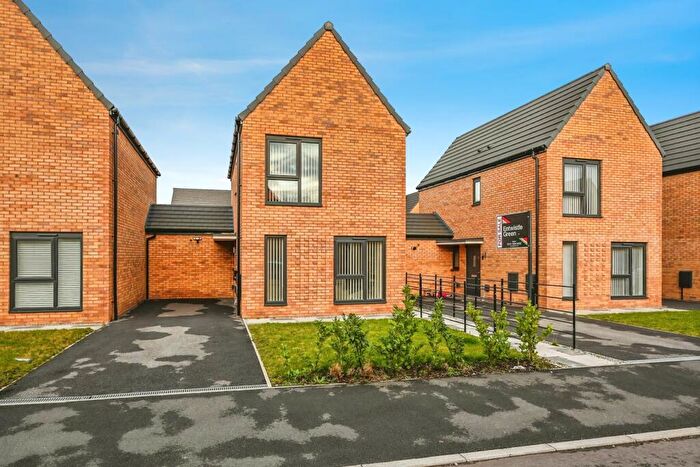
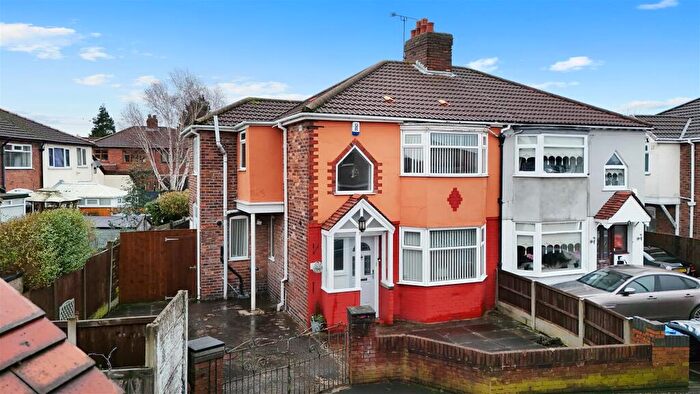
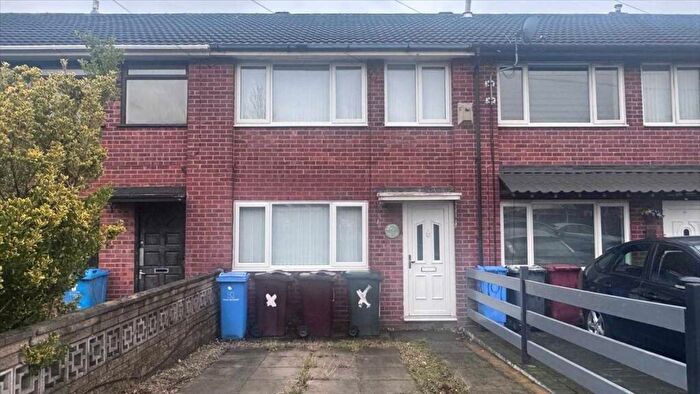
Properties for sale near L10 4XU, Sylvia Close
![]()
If you are looking to sell your house, let it out, or receive a property valuation, an expert can help you.
Click the button below to get started.
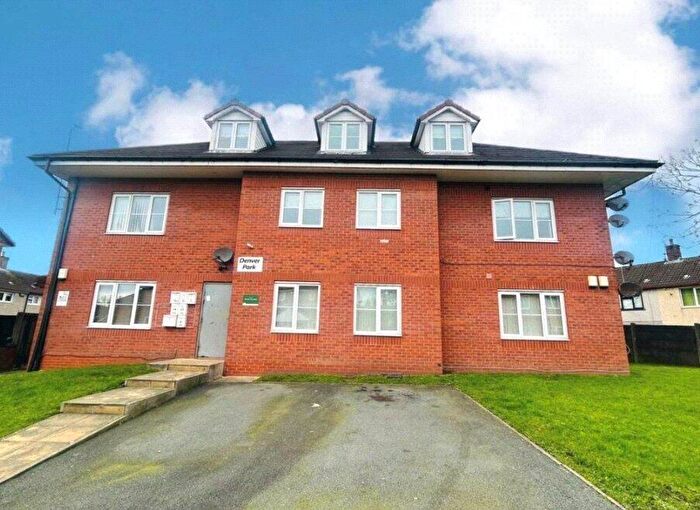
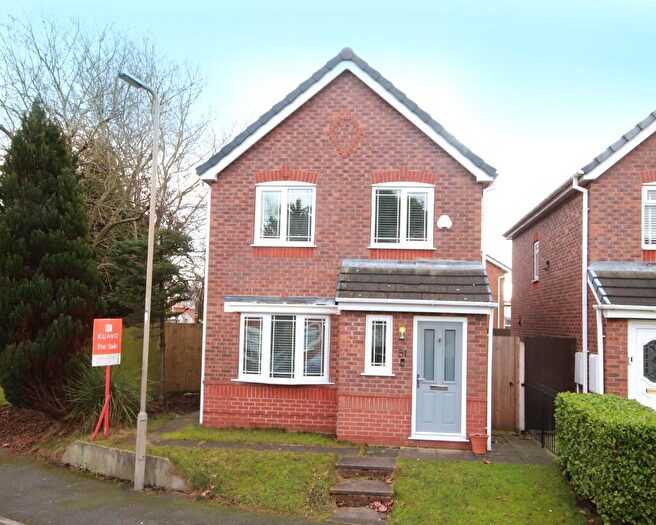
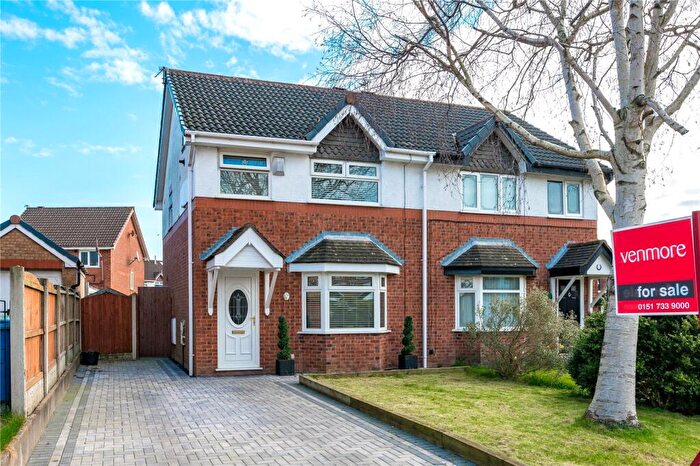
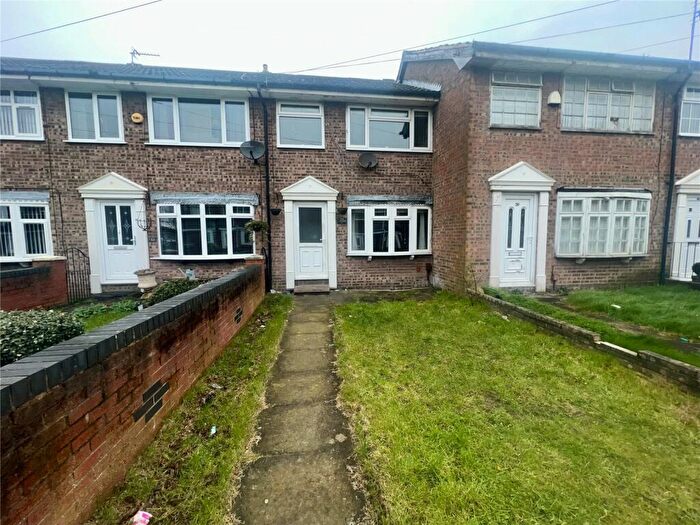
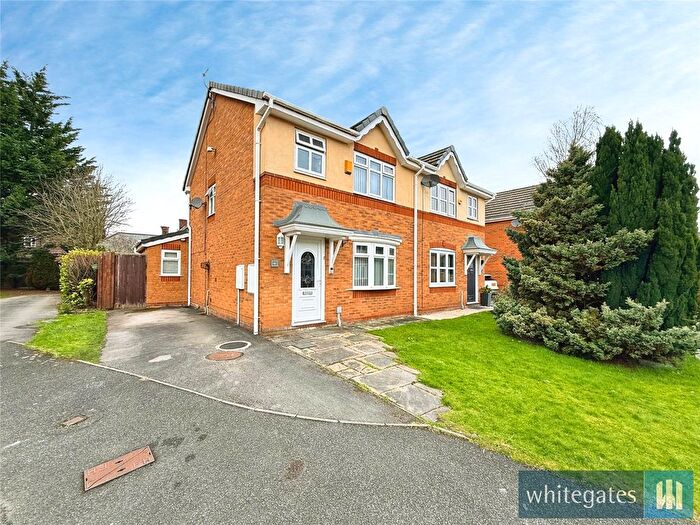
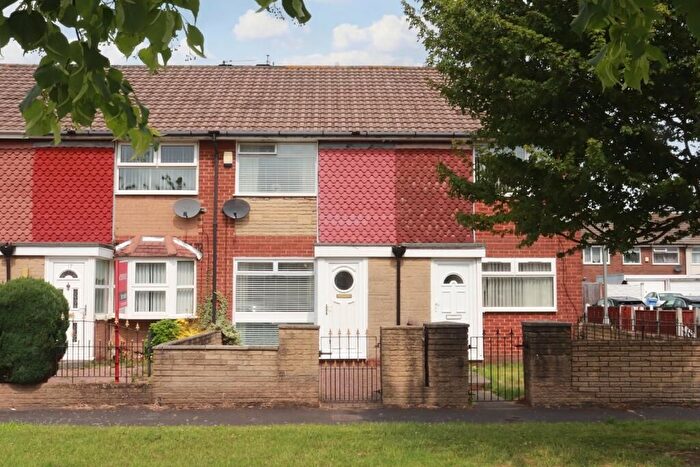
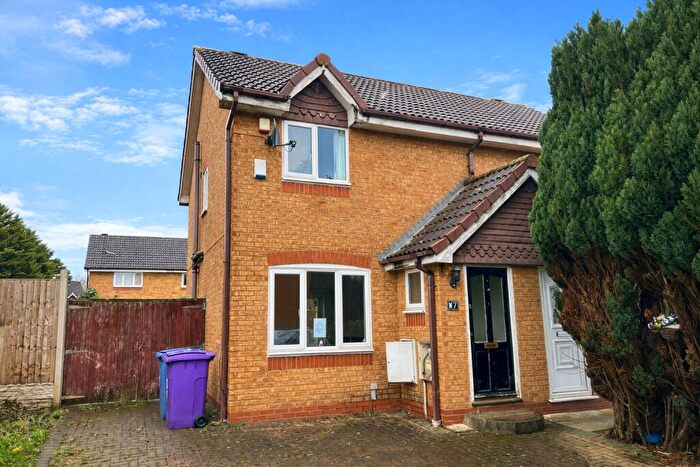
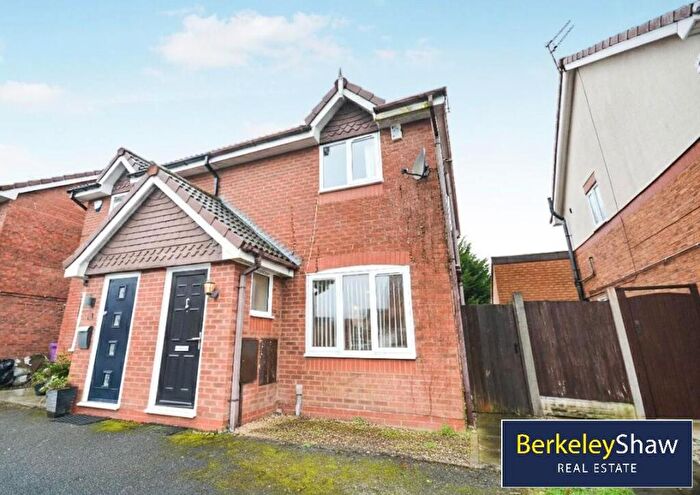
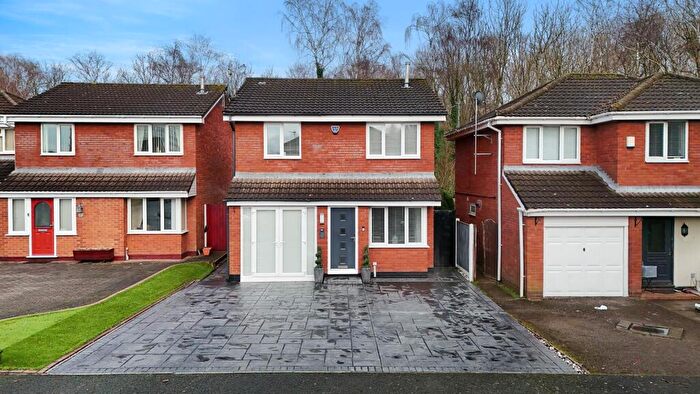
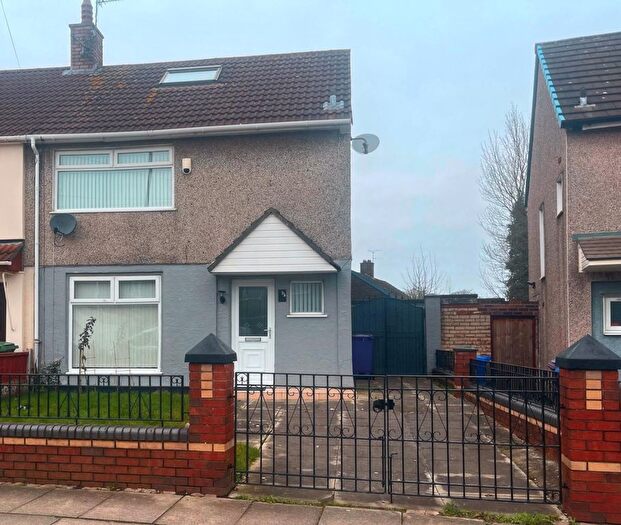
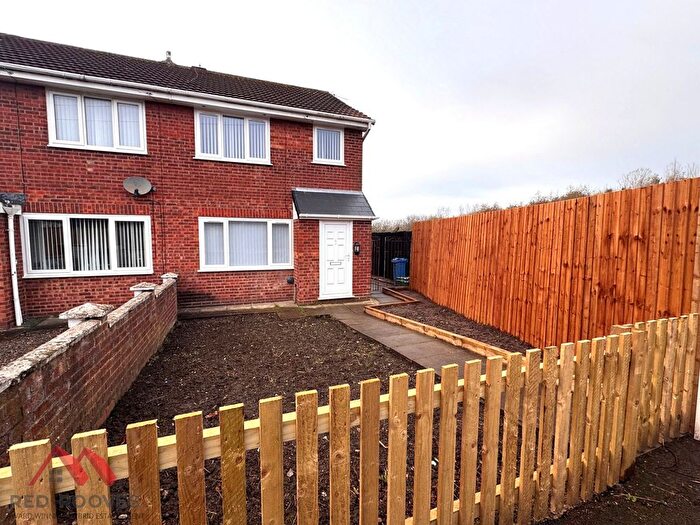
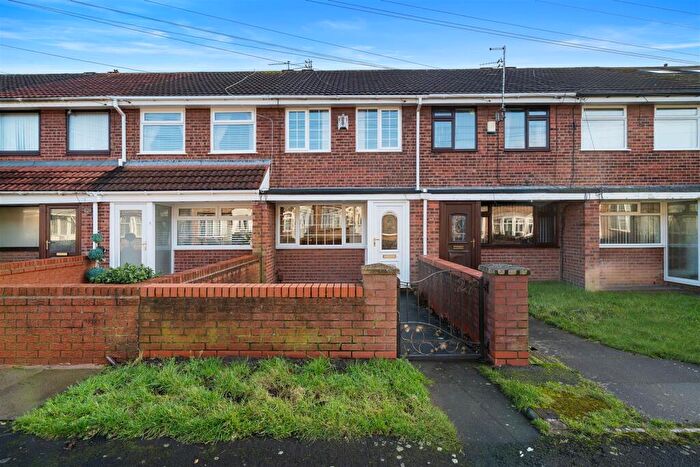
Previously listed properties near L10 4XU, Sylvia Close
![]()
If you are looking to sell your house, let it out, or receive a property valuation, an expert can help you.
Click the button below to get started.
Price Paid in Sylvia Close, L10 4XU, Cherryfield
3 Sylvia Close, L10 4XU, Cherryfield Liverpool
Property 3 has been sold 3 times. The last time it was sold was in 18/04/2017 and the sold price was £110,000.00.
This semi detached house, sold as a leasehold on 18/04/2017, is a 67 sqm semi-detached bungalow with an EPC rating of D.
| Date | Price | Property Type | Tenure | Classification |
|---|---|---|---|---|
| 18/04/2017 | £110,000.00 | Semi Detached House | leasehold | Established Building |
| 29/03/2012 | £94,000.00 | Semi Detached House | leasehold | Established Building |
| 12/02/2003 | £65,000.00 | Semi Detached House | leasehold | Established Building |
1 Sylvia Close, L10 4XU, Cherryfield Liverpool
Property 1 has been sold 2 times. The last time it was sold was in 10/10/1997 and the sold price was £39,500.00.
This is a Semi Detached House which was sold as a leasehold in 10/10/1997
| Date | Price | Property Type | Tenure | Classification |
|---|---|---|---|---|
| 10/10/1997 | £39,500.00 | Semi Detached House | leasehold | Established Building |
| 30/05/1997 | £43,000.00 | Semi Detached House | leasehold | Established Building |
Transport near L10 4XU, Sylvia Close
-
 Fazakerley Station
 -
Kirkby (Merseyside) Station
-
Aintree Station
-
Orrell Park Station
-
Rice Lane Station
-
Old Roan Station
-
Walton (Merseyside) Station
-
Maghull Station
House price paid reports for L10 4XU, Sylvia Close
Click on the buttons below to see price paid reports by year or property price:
- Price Paid By Year
Property Price Paid in L10 4XU, Sylvia Close by Year
The average sold property price by year was:
| Year | Average Sold Price | Price Change |
Sold Properties
|
|---|---|---|---|
| 2017 | £110,000 | 15% |
1 Property |
| 2012 | £94,000 | 31% |
1 Property |
| 2003 | £65,000 | 37% |
1 Property |
| 1997 | £41,250 | - |
2 Properties |