
Houses for sale & to rent in St Bartholomews, Liverpool
House Prices in St Bartholomews
Properties in St Bartholomews have an average house price of £172k and had 214 Property Transactions within the last 3 years¹.
St Bartholomews is an area in Liverpool, Knowsley with 2,782 households², where the most expensive property was sold for £560k.
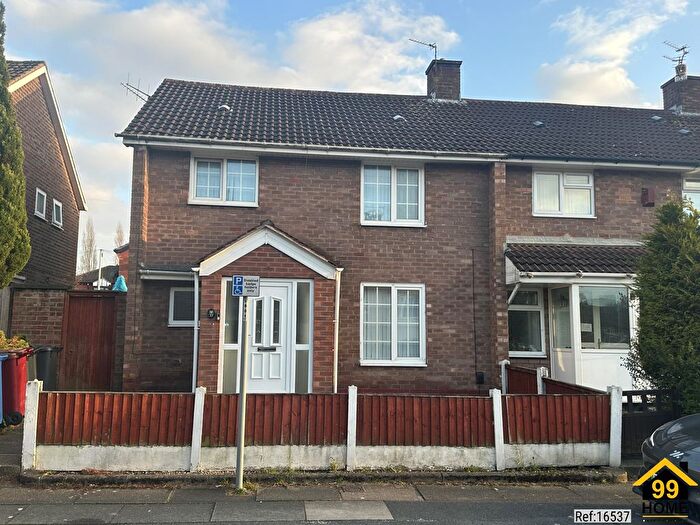
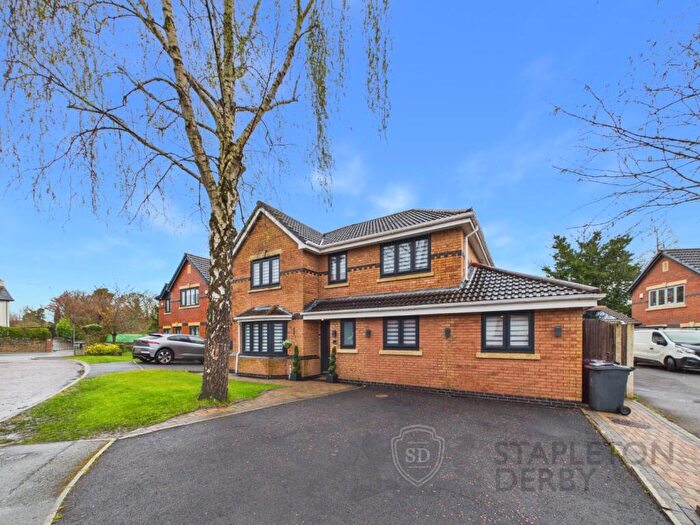
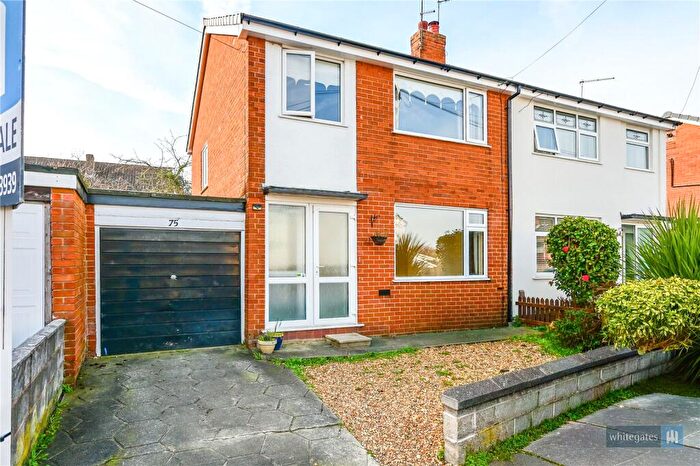
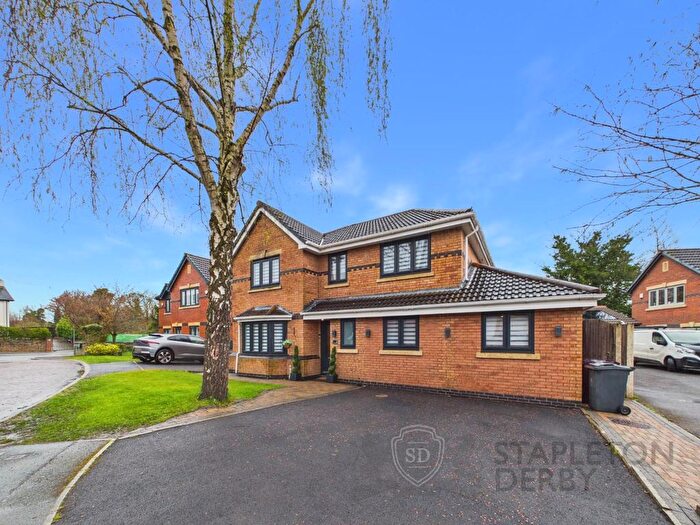
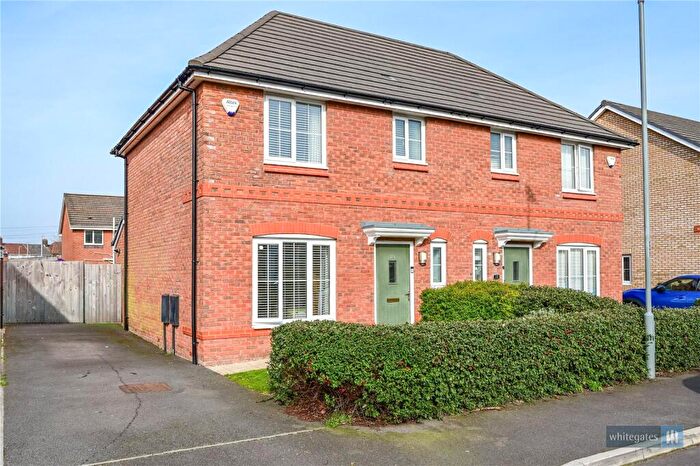
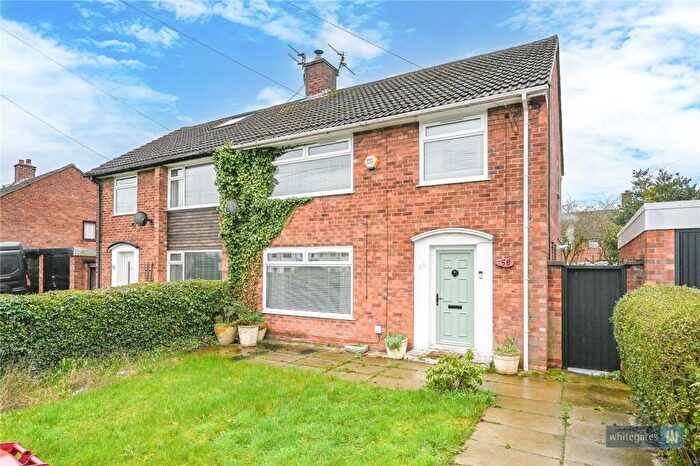
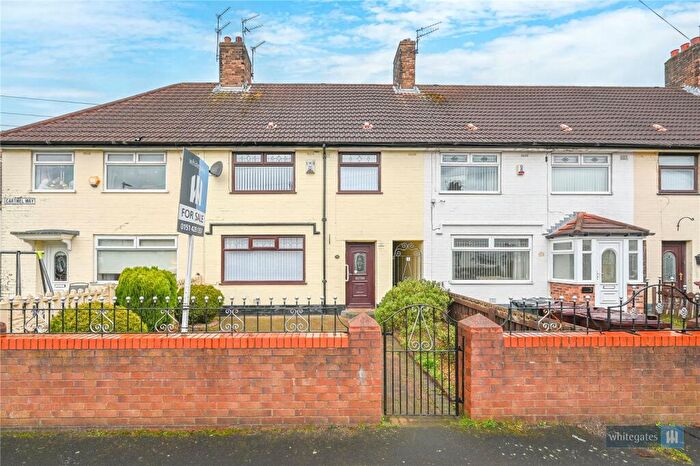
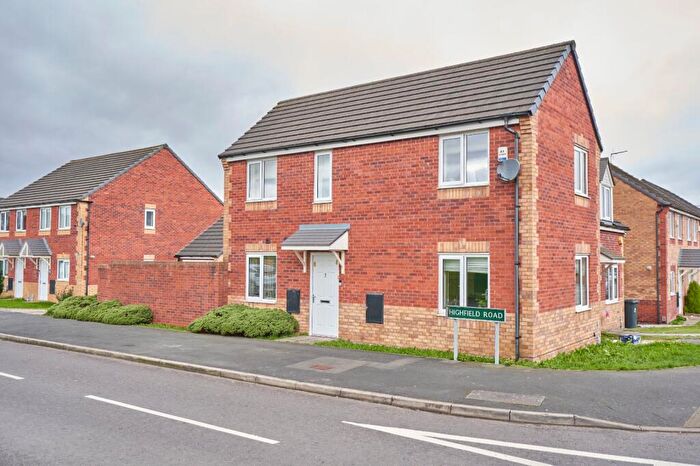
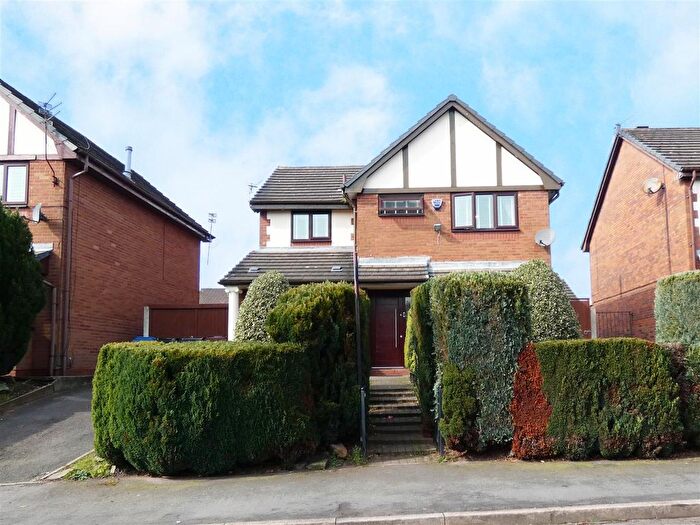
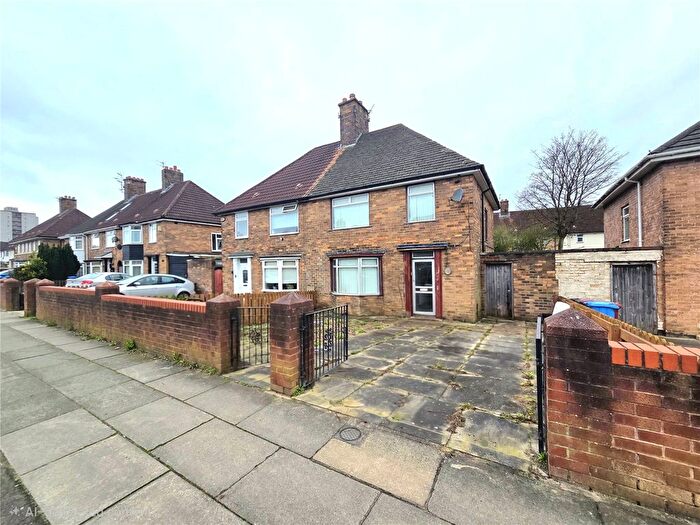
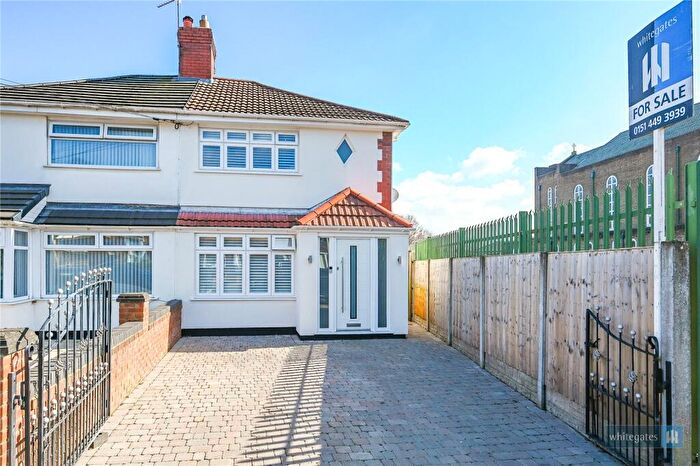
Properties for sale in St Bartholomews
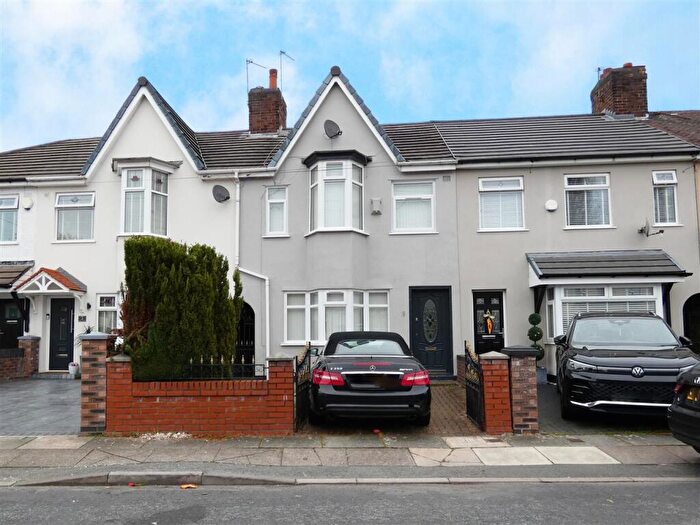

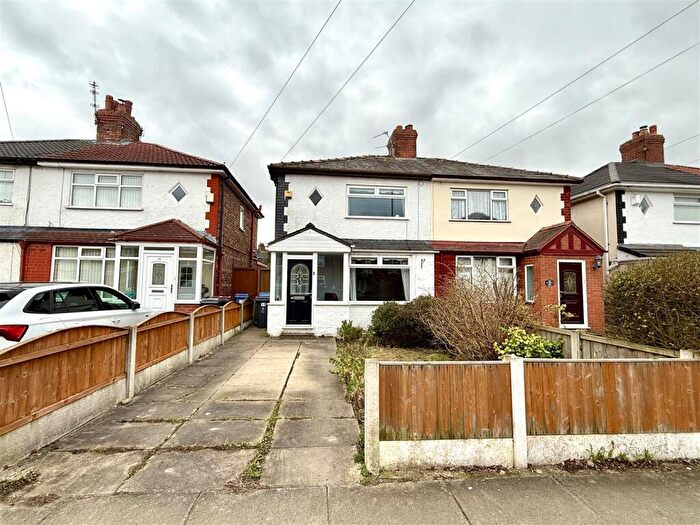
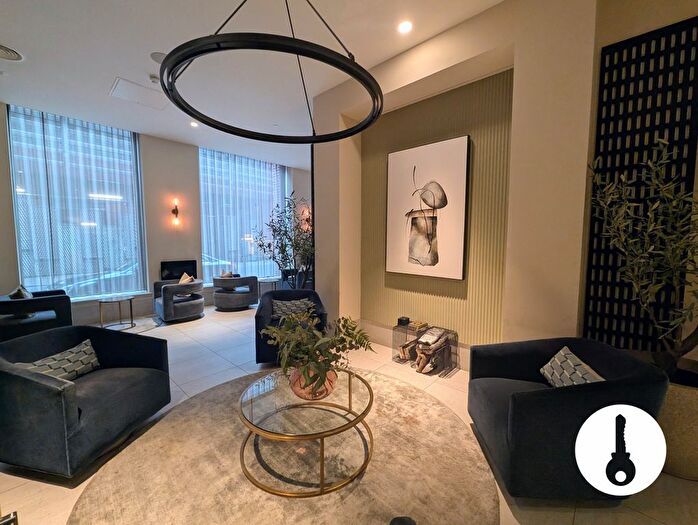
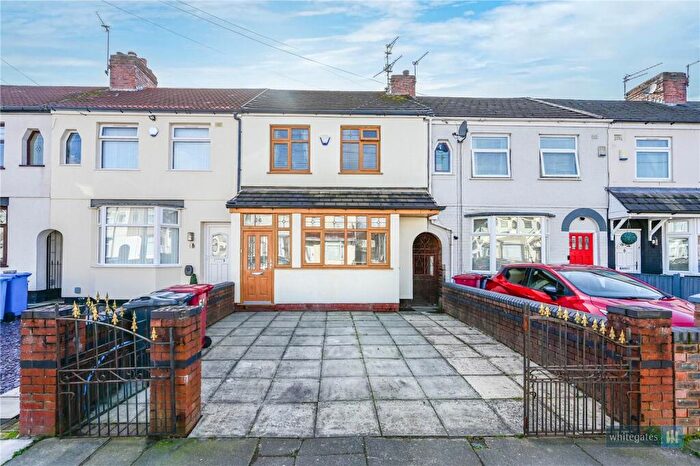
![]()
If you are looking to sell your house, let it out, or receive a property valuation, an expert can help you.
Click the button below to get started.

Roads and Postcodes in St Bartholomews
Navigate through our locations to find the location of your next house in St Bartholomews, Liverpool for sale or to rent.
| Streets | Postcodes |
|---|---|
| Archway Road | L36 9XB L36 9XD L36 9XE |
| Arnside Road | L36 4PL |
| Ashbourne Crescent | L36 4JH L36 4JJ L36 4JN L36 4JW |
| Beechburn Crescent | L36 4JX L36 4JZ |
| Beldon Crescent | L36 4LR |
| Birch Grove | L36 9XH |
| Blue Bell Lane | L36 7TN L36 7TW |
| Briar Drive | L36 9XG L36 9XQ |
| Cassino Road | L36 7UX |
| Church Road | L36 9TJ L36 9TL L36 9TP L36 9TR L36 9TW |
| Coral Avenue | L36 2PY L36 2PZ |
| Craigwood Way | L36 4PN |
| Crosswood Crescent | L36 2QE L36 2QF L36 2QG L36 2QQ |
| Crownway | L36 2PX |
| Cuper Crescent | L36 3RP |
| Derby Terrace | L36 9XJ |
| Fernbank Avenue | L36 9UD |
| Forest Drive | L36 4PQ |
| Gentwood Parade | L36 2QB |
| Gentwood Road | L36 2QH L36 2QJ L36 2QL L36 2QN L36 2QP L36 2QW |
| Gort Road | L36 7XA |
| Grinton Crescent | L36 9UA |
| Hawthorn Road | L36 9TS L36 9TT |
| Hey Park | L36 6HR L36 6HS |
| Hey Road | L36 5SW |
| Huyton Church Road | L36 5SH L36 5SJ |
| Huyton Hey Road | L36 5SE |
| Huyton Lane | L36 7XD L36 7XG |
| Jacqueline Court | L36 9TU |
| Jeffereys Crescent | L36 4JR L36 4JS L36 4JT L36 4JU |
| Kingsway | L36 2PJ L36 2PL L36 2PN L36 2PP L36 2PR L36 2PS L36 2PW L36 9UE L36 9UF |
| Kingsway Parade | L36 2QA |
| Kingswood | L36 2JY |
| Larch Road | L36 9TY L36 9TZ |
| Liverpool Road | L36 3RN |
| Maple Crescent | L36 9UB |
| Merton Close | L36 4JD |
| Merton Crescent | L36 4LD L36 4LE L36 4LF |
| Molyneux Close | L36 6DL |
| Normandy Road | L36 7UU |
| Olive Grove | L36 9TX |
| Pilch Lane East | L36 4HZ |
| Pine Close | L36 3RR |
| Plumbers Way | L36 5YL |
| Priory Court | L36 9GE |
| Runnymede | L36 2QU |
| Rupert Road | L36 9TA L36 9TB L36 9TD L36 9TF L36 9TG L36 9TH L36 9TQ |
| Salerno Drive | L36 7TR |
| Seel Road | L36 6DH L36 6DJ |
| Sergrim Road | L36 2QD |
| Spinney Way | L36 4PG |
| Stanhope Drive | L36 4LN |
| Stanley Road | L36 9BB L36 9XL L36 9XN L36 9XW |
| Twig Lane | L36 2LE L36 2LG |
| Victoria Road | L36 5SA L36 5SD |
| Wentworth Grove | L36 4LB |
| Western Avenue | L36 4LT L36 4LX |
| Whitelodge Avenue | L36 2PT L36 2PU |
| Windsor Road | L36 4NG L36 4NJ |
| Woodfield Road | L36 4PJ |
| Woodlands Road | L36 4LG L36 4PH |
Transport near St Bartholomews

- FAQ
- Price Paid By Year
- Property Type Price
Frequently asked questions about St Bartholomews
What is the average price for a property for sale in St Bartholomews?
The average price for a property for sale in St Bartholomews is £171,939. This amount is 5% lower than the average price in Liverpool. There are 1,181 property listings for sale in St Bartholomews.
What streets have the most expensive properties for sale in St Bartholomews?
The streets with the most expensive properties for sale in St Bartholomews are Archway Road at an average of £340,000, Church Road at an average of £277,833 and Larch Road at an average of £252,000.
What streets have the most affordable properties for sale in St Bartholomews?
The streets with the most affordable properties for sale in St Bartholomews are Kingsway Parade at an average of £60,000, Hey Park at an average of £96,020 and Priory Court at an average of £108,700.
Which train stations are available in or near St Bartholomews?
Some of the train stations available in or near St Bartholomews are Roby, Huyton and Broad Green.
Property Price Paid in St Bartholomews by Year
The average sold property price by year was:
| Year | Average Sold Price | Price Change |
Sold Properties
|
|---|---|---|---|
| 2025 | £176,373 | -2% |
81 Properties |
| 2024 | £179,400 | 10% |
60 Properties |
| 2023 | £160,889 | -13% |
73 Properties |
| 2022 | £181,281 | 9% |
99 Properties |
| 2021 | £165,750 | 18% |
137 Properties |
| 2020 | £135,313 | 7% |
103 Properties |
| 2019 | £125,585 | -2% |
98 Properties |
| 2018 | £127,997 | 7% |
96 Properties |
| 2017 | £119,443 | 3% |
91 Properties |
| 2016 | £115,935 | 2% |
93 Properties |
| 2015 | £113,740 | 5% |
73 Properties |
| 2014 | £107,937 | 10% |
88 Properties |
| 2013 | £97,139 | -7% |
73 Properties |
| 2012 | £103,967 | -7% |
47 Properties |
| 2011 | £111,014 | 12% |
45 Properties |
| 2010 | £98,048 | -14% |
32 Properties |
| 2009 | £111,930 | -14% |
31 Properties |
| 2008 | £128,033 | 4% |
63 Properties |
| 2007 | £123,238 | 7% |
126 Properties |
| 2006 | £114,617 | 8% |
107 Properties |
| 2005 | £106,015 | -4% |
105 Properties |
| 2004 | £109,999 | 33% |
125 Properties |
| 2003 | £73,208 | 20% |
99 Properties |
| 2002 | £58,213 | 8% |
120 Properties |
| 2001 | £53,460 | -2% |
98 Properties |
| 2000 | £54,711 | 8% |
114 Properties |
| 1999 | £50,387 | 14% |
104 Properties |
| 1998 | £43,398 | 3% |
100 Properties |
| 1997 | £42,162 | 1% |
113 Properties |
| 1996 | £41,774 | 6% |
87 Properties |
| 1995 | £39,339 | - |
60 Properties |
Property Price per Property Type in St Bartholomews
Here you can find historic sold price data in order to help with your property search.
The average Property Paid Price for specific property types in the last three years are:
| Property Type | Average Sold Price | Sold Properties |
|---|---|---|
| Semi Detached House | £209,695.00 | 97 Semi Detached Houses |
| Detached House | £292,750.00 | 4 Detached Houses |
| Terraced House | £144,990.00 | 91 Terraced Houses |
| Flat | £94,975.00 | 22 Flats |