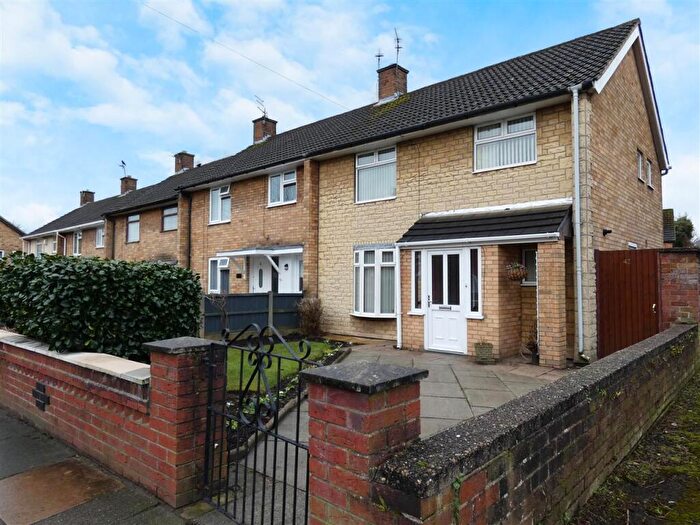
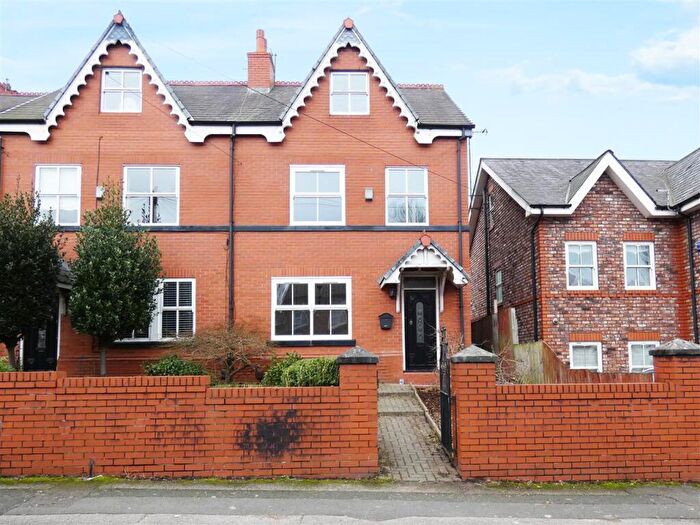
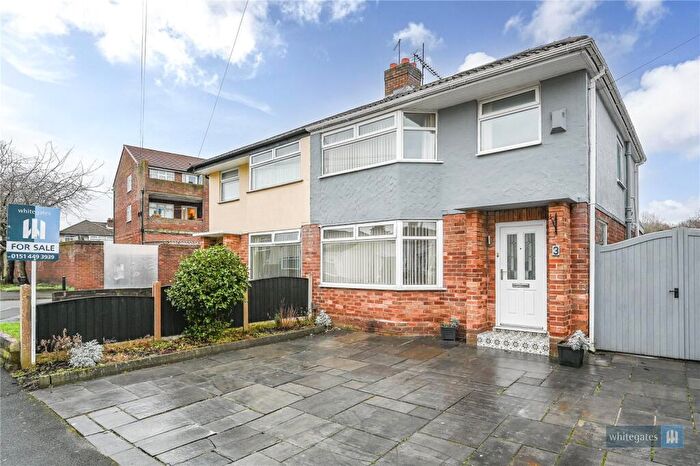
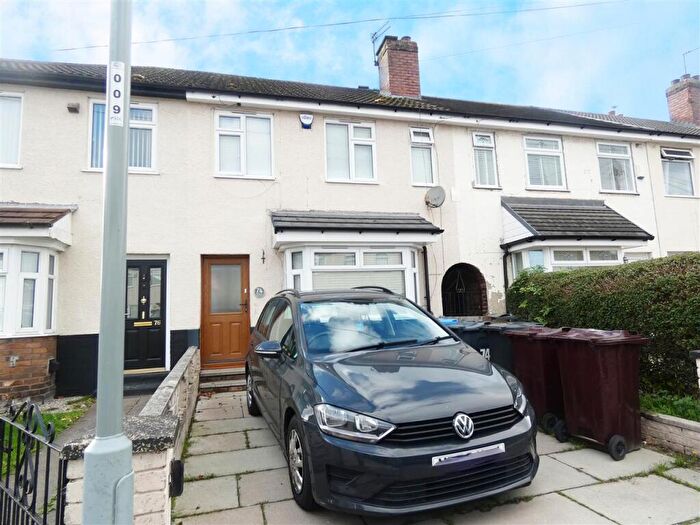
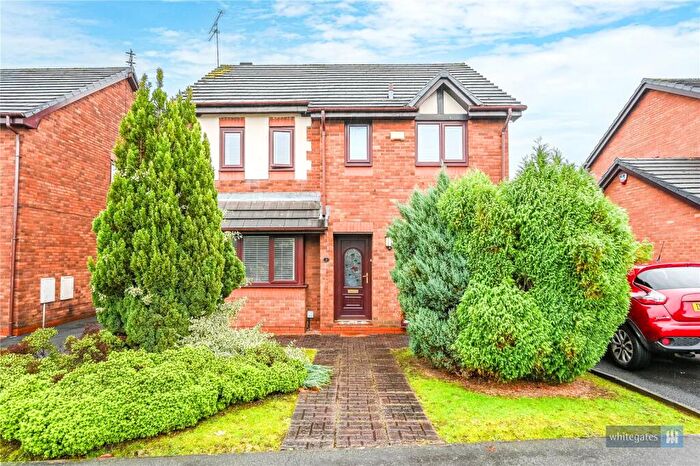
Houses for sale & to rent in Roby, Liverpool
House Prices in Roby
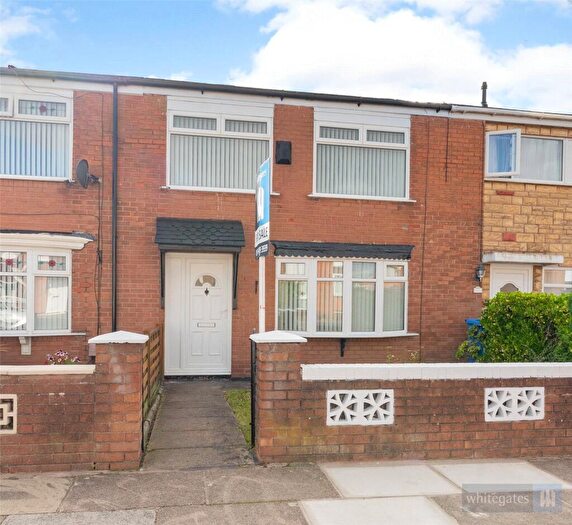
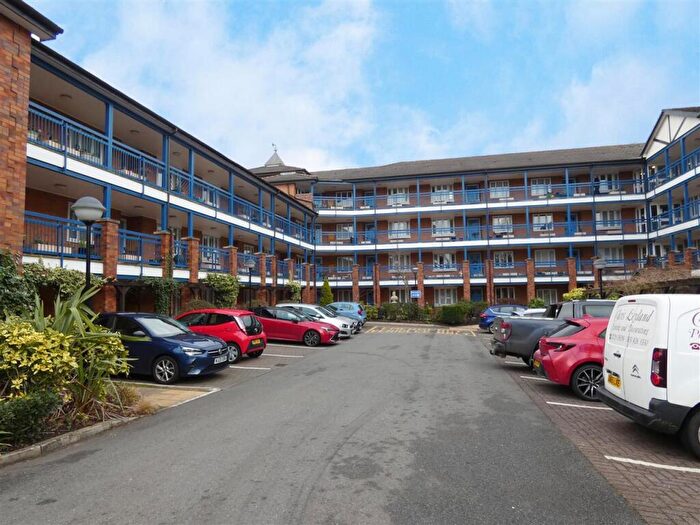
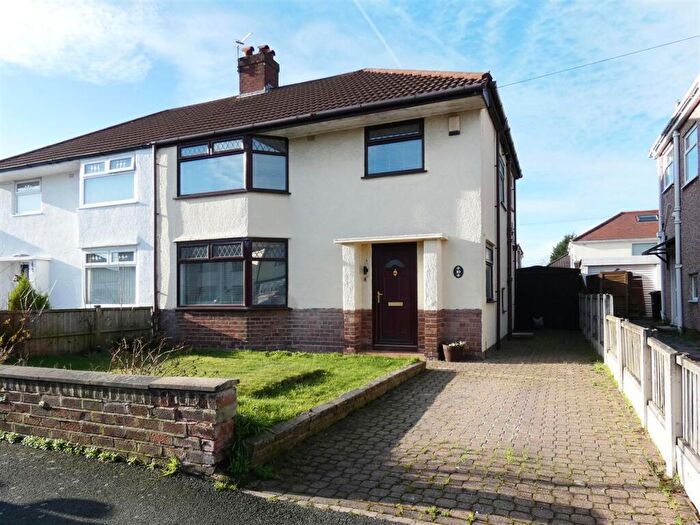
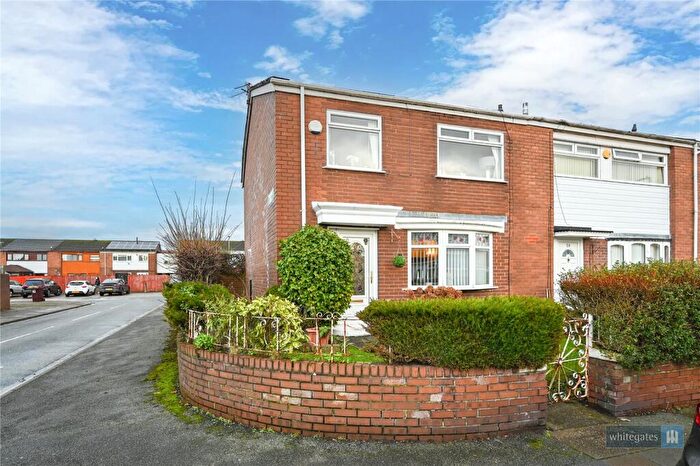
Properties in Roby have an average house price of £280,086.00 and had 270 Property Transactions within the last 3 years¹.
Roby is an area in Liverpool, Knowsley with 2,924 households², where the most expensive property was sold for £725,000.00.
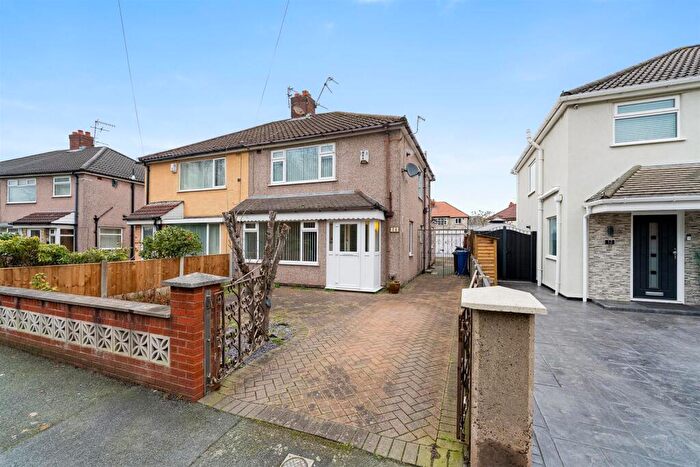
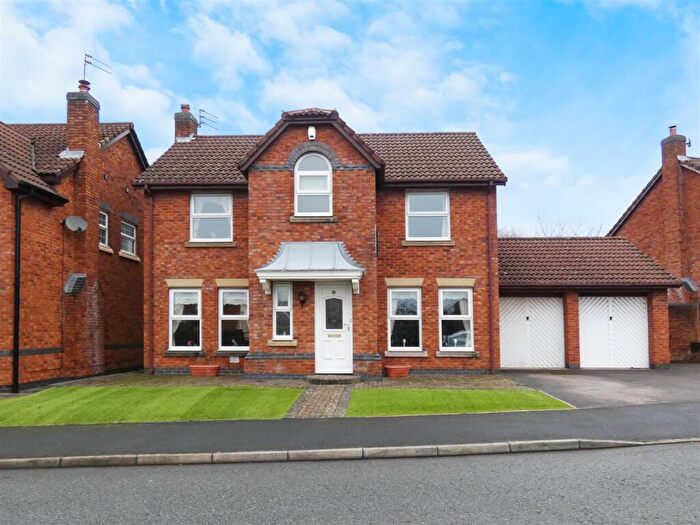
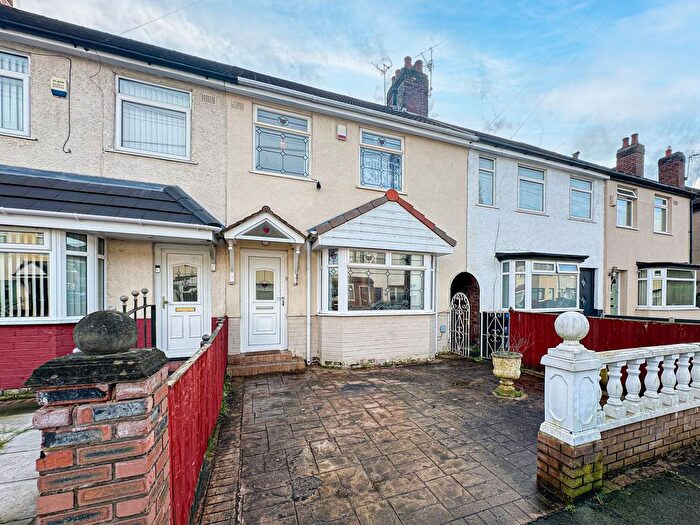
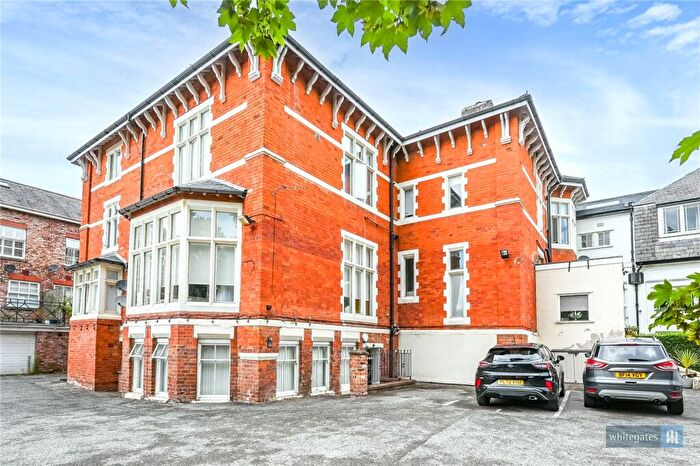
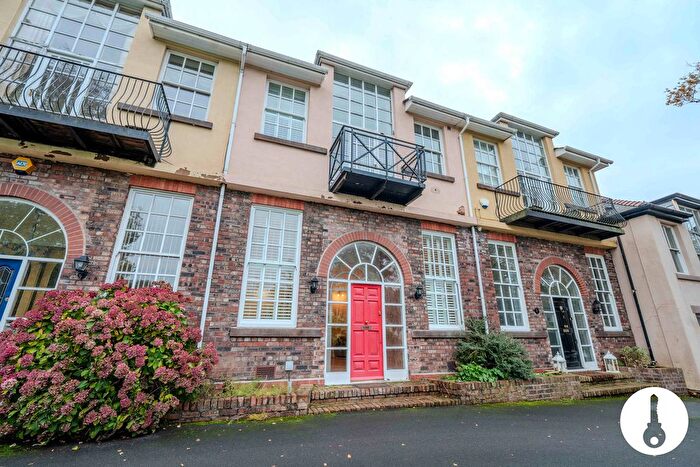
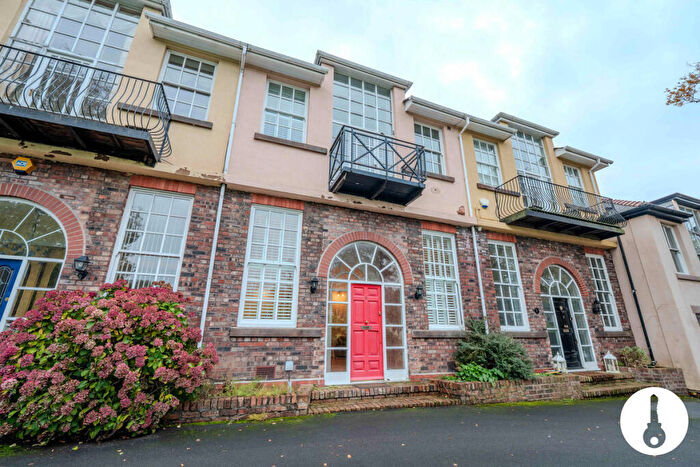
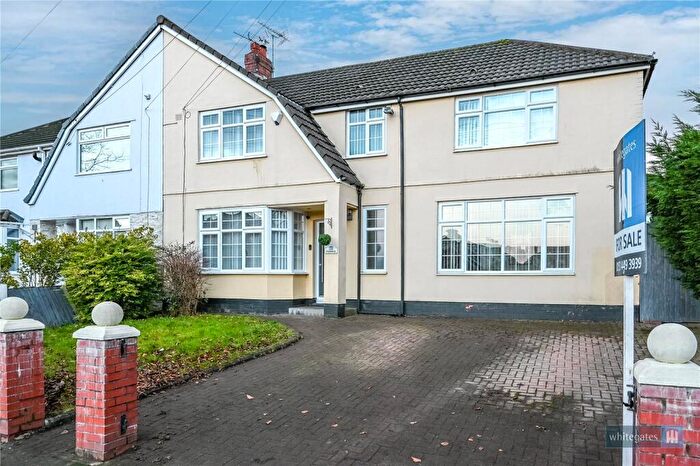
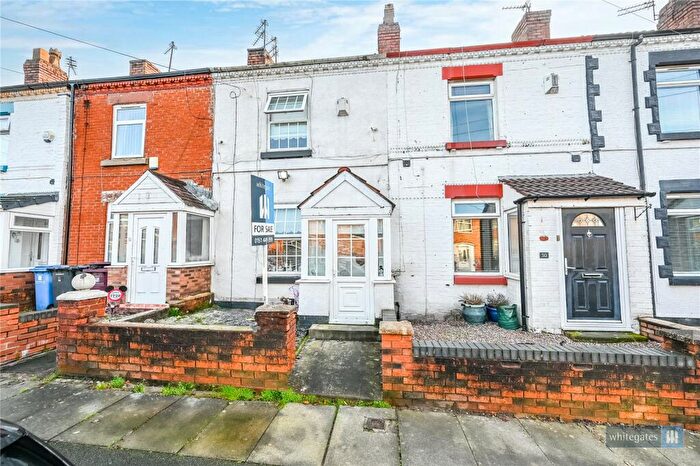
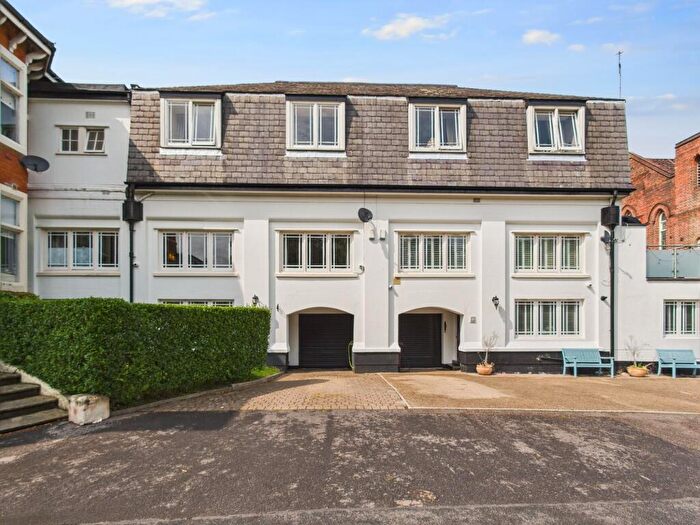
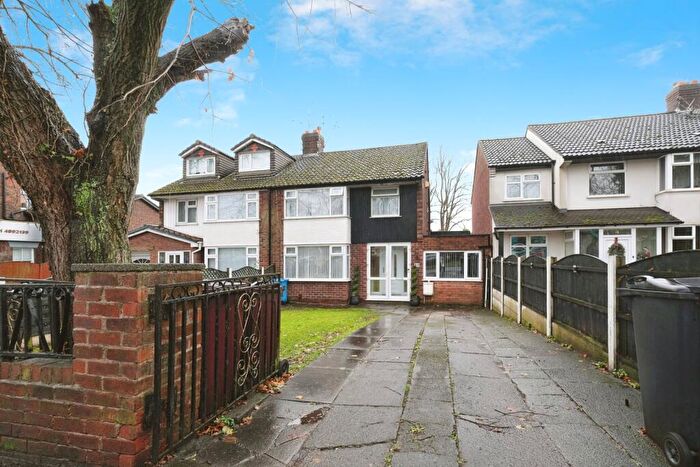
Properties for sale in Roby
Roads and Postcodes in Roby
Navigate through our locations to find the location of your next house in Roby, Liverpool for sale or to rent.
| Streets | Postcodes |
|---|---|
| Acacia Avenue | L36 5TL L36 5TN L36 5TP L36 5TW |
| Anderton Terrace | L36 4HS |
| Archway Road | L36 9XA L36 9SA L36 9UX L36 9XF |
| Ash Crescent | L36 5TX |
| Ashdale | L36 4QS |
| Atwood Grove | L36 9AE |
| Beecham Close | L36 5XD |
| Belfield Crescent | L36 5TR |
| Birkdale Close | L36 4QW |
| Blacklow Brow | L36 5XE L36 5XF L36 5XG |
| Bolton Hey | L36 4AA |
| Bowring Park Avenue | L16 2LE L16 2LF L16 2NH L16 2NJ |
| Boxwood Close | L36 4QZ |
| Bridge Road | L36 4HX |
| Buttermere Road | L16 2NL L16 2NN |
| Carr Lane | L36 4HT L36 4AU |
| Cedar Crescent | L36 5UP |
| Cedarwood Court | L36 5YY |
| Charlwood Avenue | L36 5UH |
| Cheltenham Crescent | L36 4QD |
| Cherry Tree Road | L36 5TY L36 5TZ |
| Chestnut Avenue | L36 5XP L36 5XR |
| Civic Way | L36 9GD |
| Colin Close | L36 4PS |
| College Fields | L36 5RY |
| College View | L36 5RS |
| Court Hey Avenue | L36 4JB |
| Court Hey Drive | L16 2NB L16 2ND |
| Court Hey Park | L16 3NA |
| Court Hey Road | L16 2LY L16 2LZ |
| Cypress Grove | L16 2AB |
| Cypress Road | L36 5UN L36 5UW |
| Dam House Crescent | L36 9WD L36 9WE |
| Derby Road | L36 9UJ L36 9UL L36 9UP |
| Donnington Close | L36 4QU |
| Earle Avenue | L36 4JP |
| Eaton Close | L36 4HR |
| Edenhurst Avenue | L16 2LA L16 2AG |
| Edgbaston Close | L36 4QR |
| Ellison Grove | L36 9GA |
| Ewanville | L36 5YS |
| Ewart Road | L16 2LH |
| Fields End | L36 5YQ |
| Gladstone Avenue | L16 2LG L16 2LQ |
| Glynne Grove | L16 2LJ |
| Goodwood Close | L36 4QL |
| Grange Close | L36 9UT |
| Grangewood | L16 3GB |
| Greenhill Place | L36 5RU |
| Griffith's Road | L36 6NA |
| Harrison Hey | L36 5YR |
| Headingley Close | L36 4QA |
| High Beeches | L16 3GA |
| High Carrs | L36 4RW |
| Holly Grove | L36 4JA |
| Huyton Hall Crescent | L36 5RL |
| Kempton Close | L36 4QJ |
| Kerrington Road | L36 7AA |
| Keswick Villas | L16 2NR |
| Keswick Way | L16 2NP |
| Laburnum Avenue | L36 5UE L36 5UF |
| Laurel Grove | L36 5UD |
| Lawton Road | L36 4HL L36 4HN L36 4HW |
| Lilac Grove | L36 5XS L36 5XT |
| Linden Drive | L36 5TT |
| Lingfield Close | L36 4QH |
| Lucas Avenue | L16 2AA |
| Maple Way | L16 2AD |
| Marina Crescent | L36 5XL |
| Muirfield Road | L36 4QN |
| Newbury Close | L36 4QE |
| Nottingham Road | L36 4QB |
| Oak Place | L16 2AF |
| Oak Road | L36 5RP L36 5XY L36 5XZ |
| Old Dover Road | L36 4PZ |
| Oran Way | L36 7UT |
| Oulton Lane | L36 4QX |
| Pear Tree Road | L36 5UB |
| Pilch Lane East | L36 4HY |
| Pinetree Road | L36 5YA |
| Pinnington Place | L36 5XA |
| Poplar Bank | L36 9US |
| Rimmer Avenue | L16 2NE L16 2NF L16 2NG L16 2NQ |
| Roby Mount Avenue | L36 4HP |
| Roby Nook | L36 4AD |
| Roby Road | L14 3NU L36 4HA L36 4HD L36 4HE L36 4HF L36 4HG L36 4HH L36 4HQ |
| Rowan Grove | L36 5XU L36 5XX |
| Rupert Road | L36 9TE |
| Ruskin Way | L36 5UJ L36 5UL |
| Salerno Drive | L36 7TP |
| Sandfield | L36 9XR |
| Sheppard Avenue | L16 2LB L16 2LD |
| Silverdale Close | L36 5YJ |
| Silverstone Drive | L36 4QT |
| Springwell Avenue | L36 9AB L36 9AD |
| St Catherines Close | L36 5RX |
| St Michaels Court | L36 7YR |
| Station Road | L36 4HU |
| Stoneleigh Road | L36 9WB |
| Sunningdale Close | L36 4QF |
| Sycamore Road | L36 5TU |
| Sycamore Way | L16 2AE |
| Talbot Court | L36 5YW |
| Tarbock Road | L36 5TD L36 5TH L36 5TJ L36 5TQ L36 5XN L36 5XW L36 5YB |
| The Brooklands | L36 5YD |
| The Orchard | L36 5UY L36 5UZ |
| The Park | L36 5SU |
| The Rooley | L36 5XH L36 5XJ |
| Turnberry Close | L36 4QQ |
| Twickenham Drive | L36 4NA L36 4QG |
| Wantage View | L36 4QP |
| Warbrook Road | L36 9AA |
| Waterside Park | L36 4RN |
| Wellington Grove | L36 9UW |
| Westmorland Road | L36 6AA L36 6GA L36 9GL |
| Whitfield Close | L36 4AB |
| Willow Avenue | L36 5UA |
| Wilton Road | L36 5XB |
| Wokingham Grove | L36 5YX |
| Wynwood Park | L36 4QY |
| Yew Tree Road | L36 5UG L36 5UQ |
| L36 0WW L36 4WB L36 4WY L36 4YU L36 4YX L36 5PL L36 6LY L36 9FA L36 9FB L36 9RX L36 9RY L36 9RZ L36 9SB L36 9SD L36 9SE L36 9SF L36 9SG L36 9SH L36 9SJ L36 9SL L36 9SN L36 9SP L36 9SQ L36 9SR L36 9SS L36 9ST L36 9SU L36 9SW L36 9SX L36 9SY L36 9SZ L36 9YX L36 9YZ |
Transport near Roby
- FAQ
- Price Paid By Year
- Property Type Price
Frequently asked questions about Roby
What is the average price for a property for sale in Roby?
The average price for a property for sale in Roby is £280,086. This amount is 55% higher than the average price in Liverpool. There are 890 property listings for sale in Roby.
What streets have the most expensive properties for sale in Roby?
The streets with the most expensive properties for sale in Roby are Huyton Hall Crescent at an average of £607,500, Ewanville at an average of £467,500 and Bolton Hey at an average of £420,625.
What streets have the most affordable properties for sale in Roby?
The streets with the most affordable properties for sale in Roby are Twickenham Drive at an average of £86,790, Ashdale at an average of £102,428 and Anderton Terrace at an average of £143,500.
Which train stations are available in or near Roby?
Some of the train stations available in or near Roby are Roby, Huyton and Broad Green.
Property Price Paid in Roby by Year
The average sold property price by year was:
| Year | Average Sold Price | Price Change |
Sold Properties
|
|---|---|---|---|
| 2025 | £286,471 | 5% |
63 Properties |
| 2024 | £273,357 | -3% |
98 Properties |
| 2023 | £282,445 | 5% |
109 Properties |
| 2022 | £267,235 | 11% |
139 Properties |
| 2021 | £238,054 | 1% |
161 Properties |
| 2020 | £235,400 | 4% |
164 Properties |
| 2019 | £226,217 | 16% |
154 Properties |
| 2018 | £190,542 | -16% |
135 Properties |
| 2017 | £220,130 | 16% |
199 Properties |
| 2016 | £185,632 | 9% |
159 Properties |
| 2015 | £169,741 | -0,1% |
118 Properties |
| 2014 | £169,876 | 1% |
87 Properties |
| 2013 | £167,984 | -5% |
91 Properties |
| 2012 | £176,622 | 1% |
84 Properties |
| 2011 | £174,596 | 15% |
60 Properties |
| 2010 | £148,373 | -16% |
45 Properties |
| 2009 | £172,798 | -15% |
40 Properties |
| 2008 | £198,128 | -1% |
40 Properties |
| 2007 | £199,383 | 14% |
109 Properties |
| 2006 | £172,306 | -8% |
101 Properties |
| 2005 | £186,645 | 16% |
80 Properties |
| 2004 | £157,152 | 14% |
103 Properties |
| 2003 | £134,386 | 22% |
102 Properties |
| 2002 | £104,945 | 17% |
123 Properties |
| 2001 | £86,964 | 16% |
117 Properties |
| 2000 | £73,272 | -6% |
103 Properties |
| 1999 | £77,676 | -2% |
128 Properties |
| 1998 | £79,068 | 10% |
129 Properties |
| 1997 | £71,401 | 8% |
124 Properties |
| 1996 | £65,597 | -1% |
137 Properties |
| 1995 | £66,130 | - |
119 Properties |
Property Price per Property Type in Roby
Here you can find historic sold price data in order to help with your property search.
The average Property Paid Price for specific property types in the last three years are:
| Property Type | Average Sold Price | Sold Properties |
|---|---|---|
| Flat | £124,144.00 | 17 Flats |
| Semi Detached House | £262,334.00 | 131 Semi Detached Houses |
| Detached House | £357,029.00 | 86 Detached Houses |
| Terraced House | £234,513.00 | 36 Terraced Houses |

