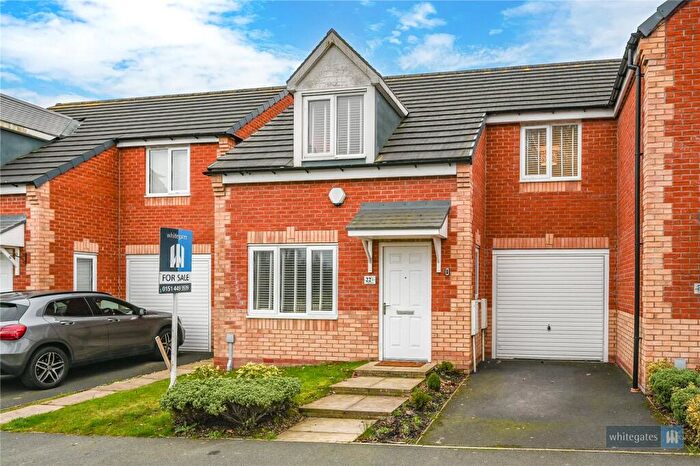
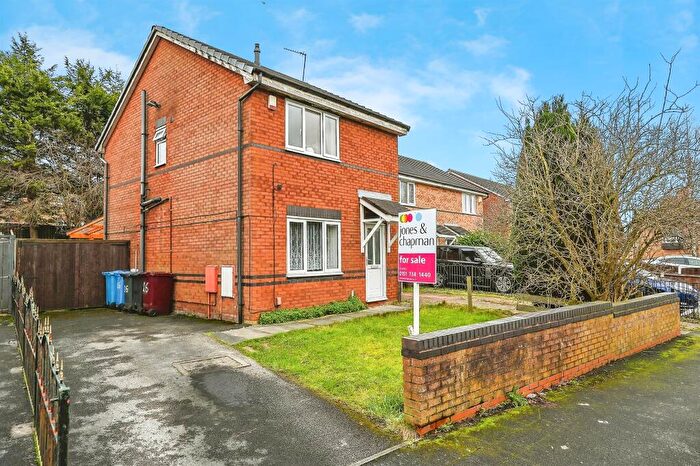
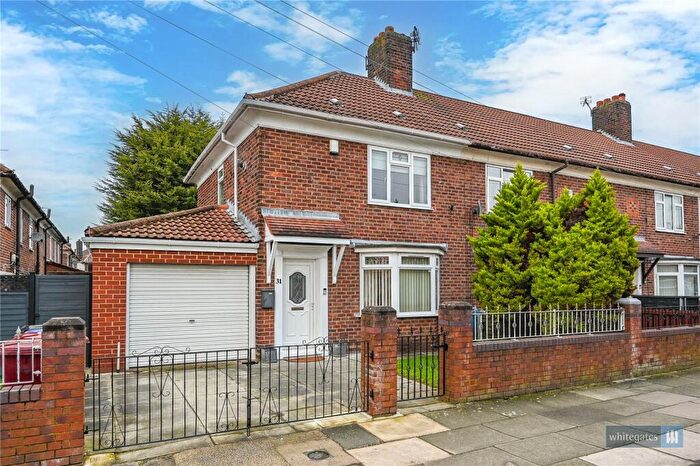
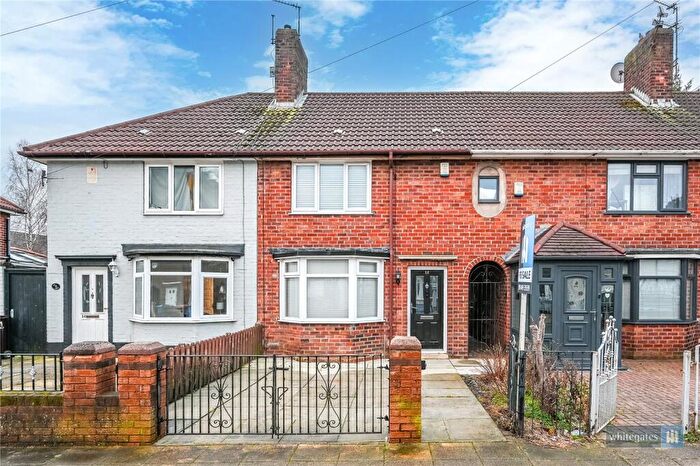
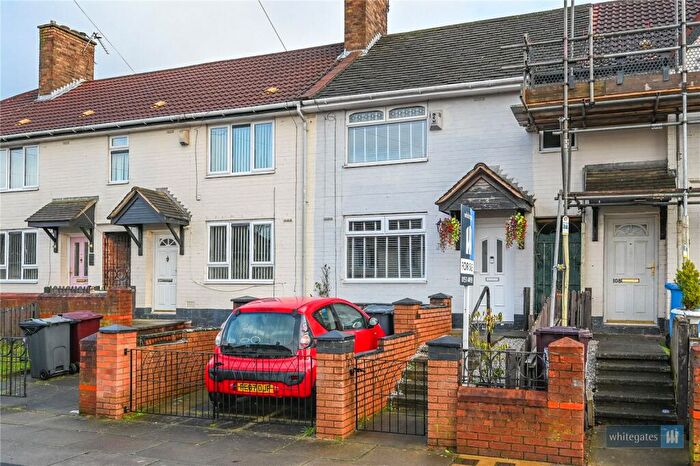
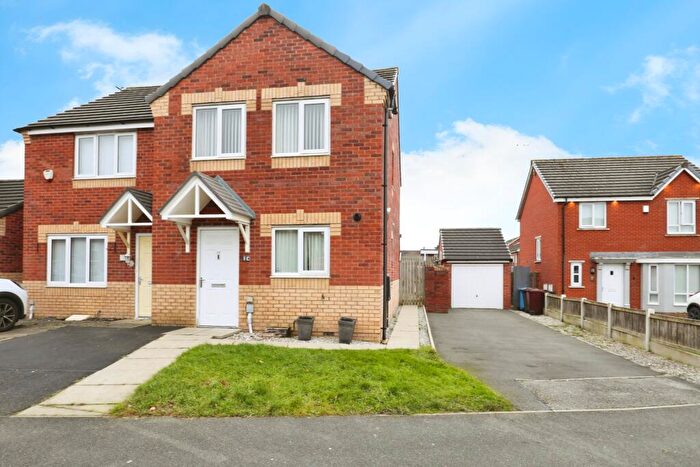
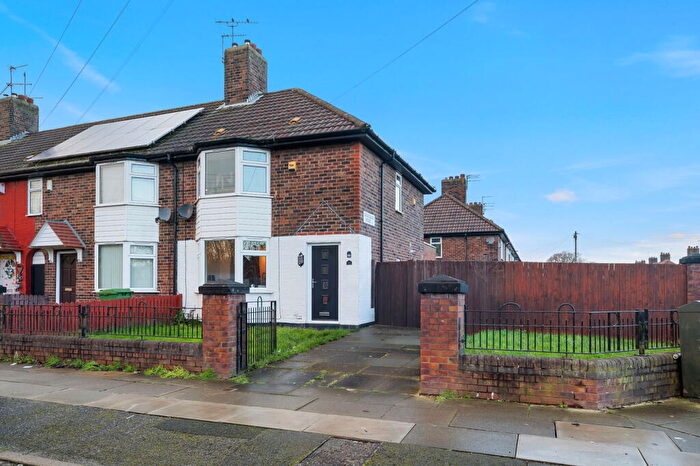
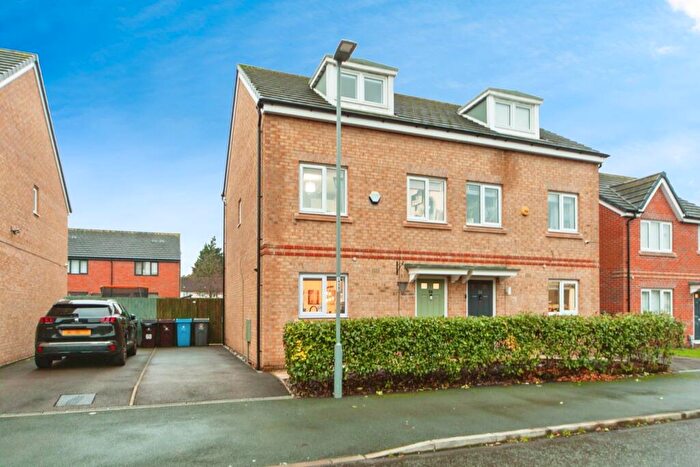
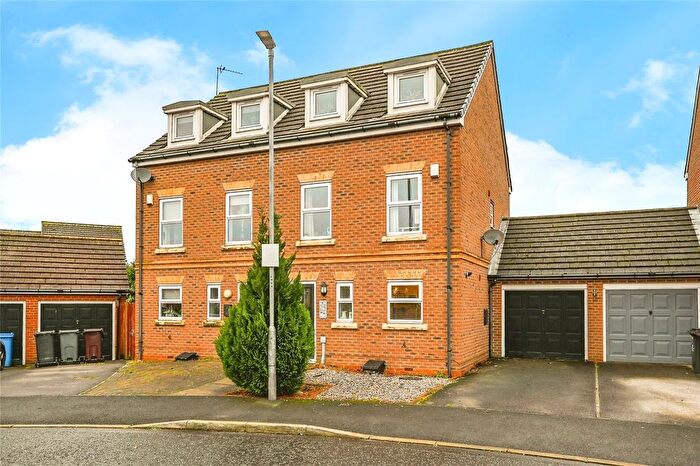
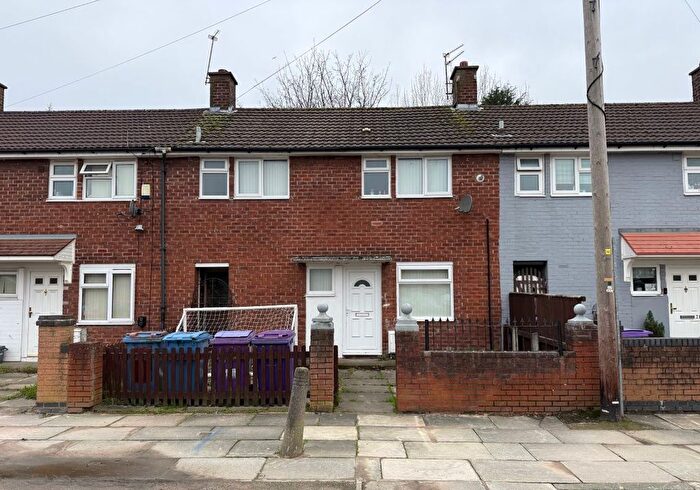
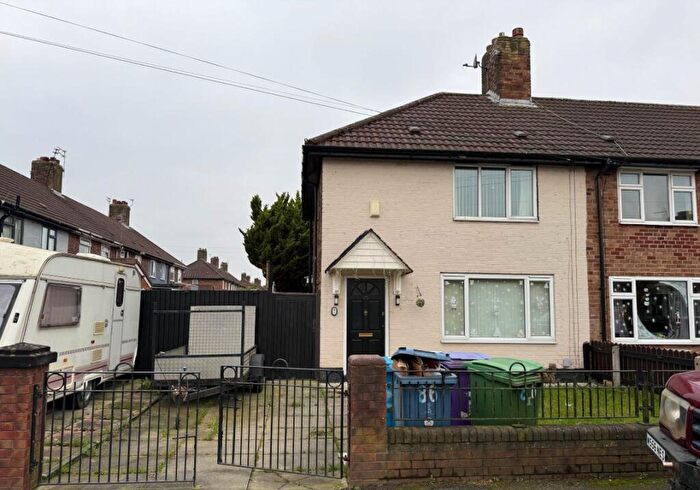
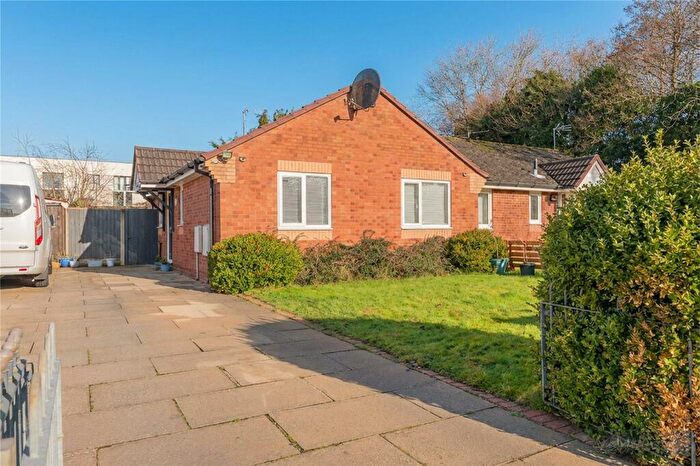
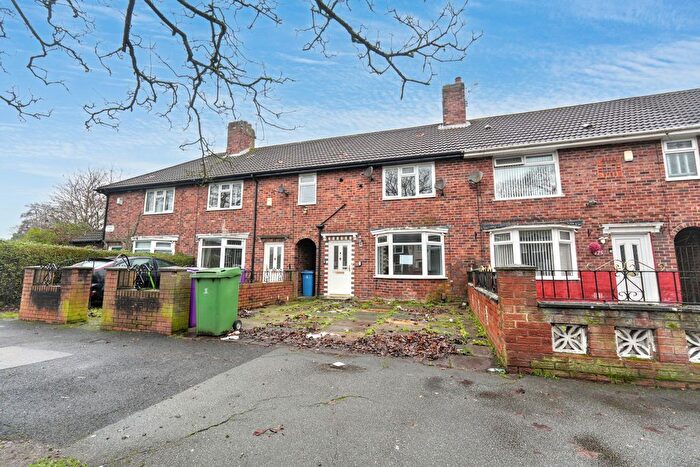
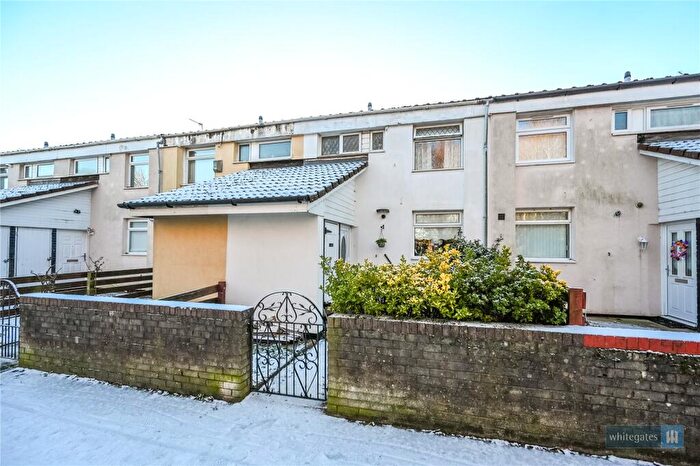
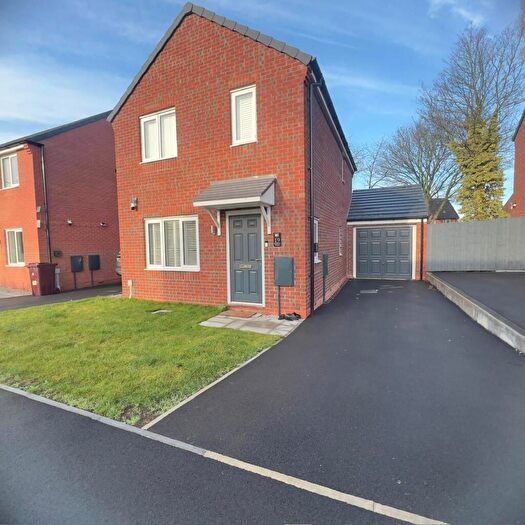
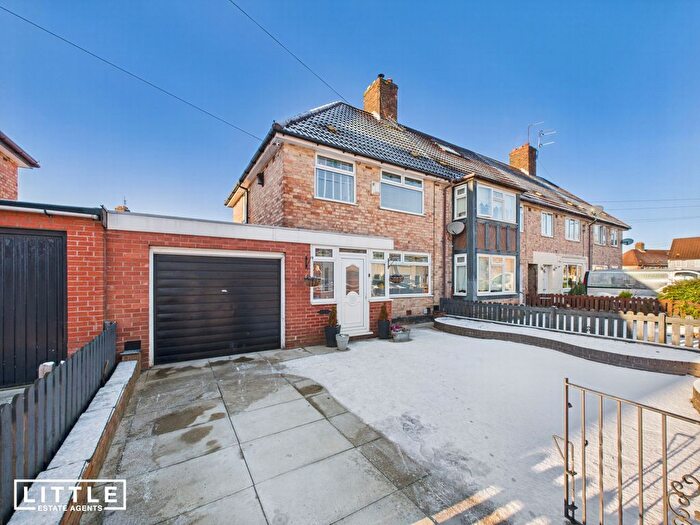
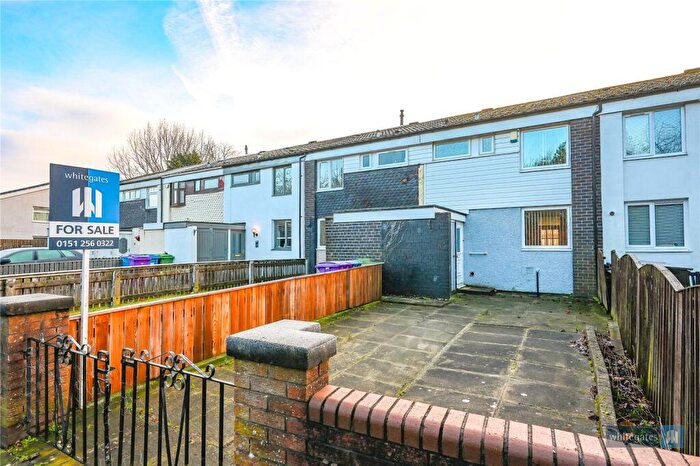
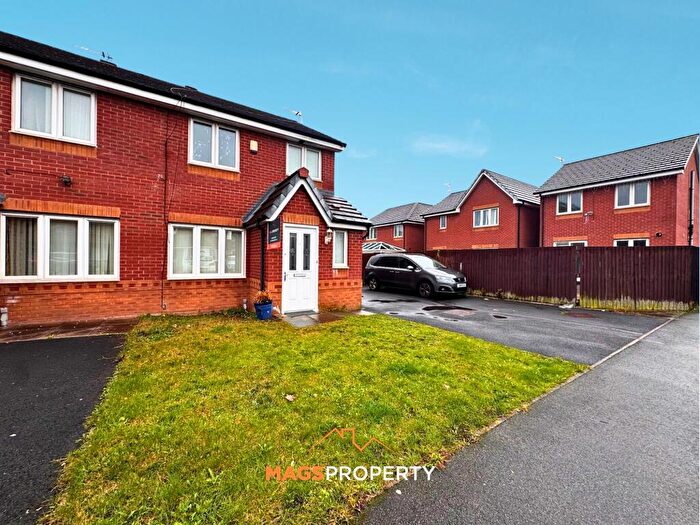
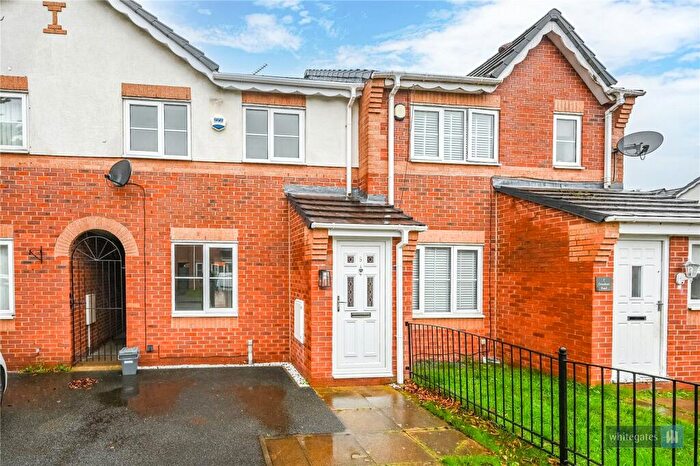
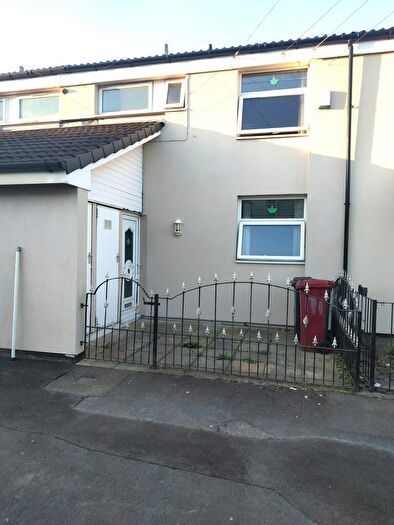
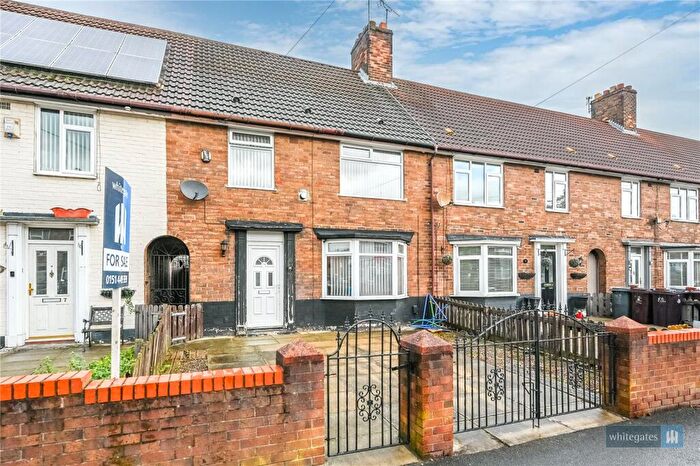
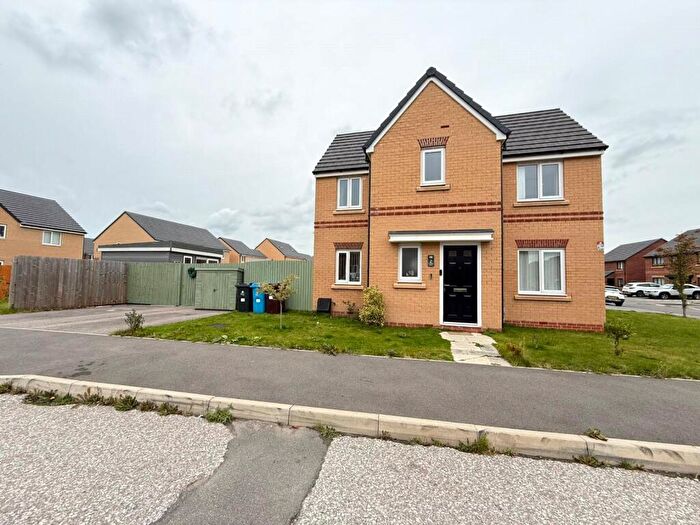
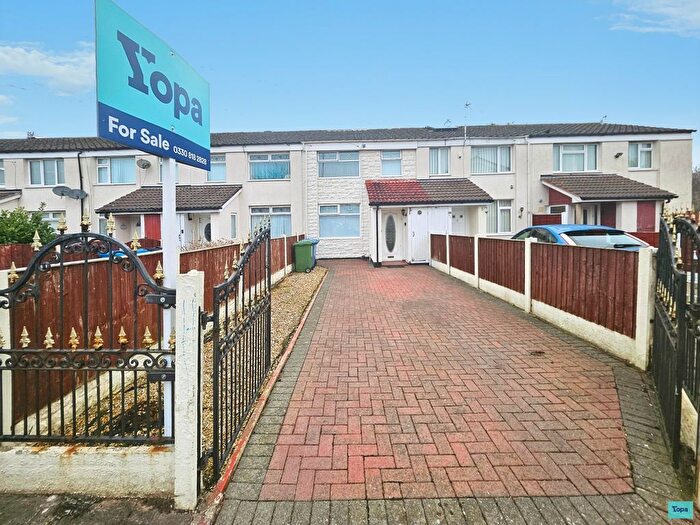
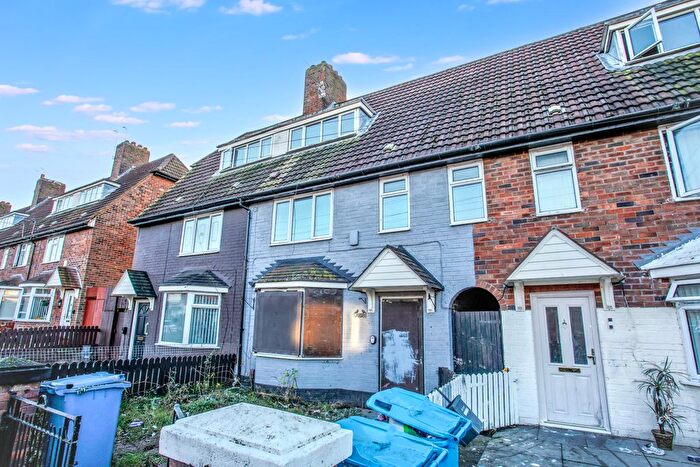
Houses for sale & to rent in Stockbridge, Liverpool
House Prices in Stockbridge
Properties in Stockbridge have an average house price of £164,732.00 and had 152 Property Transactions within the last 3 years¹.
Stockbridge is an area in Liverpool, Knowsley with 2,983 households², where the most expensive property was sold for £377,995.00.
Properties for sale in Stockbridge
Previously listed properties in Stockbridge
Roads and Postcodes in Stockbridge
Navigate through our locations to find the location of your next house in Stockbridge, Liverpool for sale or to rent.
| Streets | Postcodes |
|---|---|
| Aiden Long Grove | L34 4AP |
| Apple Tree Close | L28 7RH |
| Ashbury Road | L14 8UX L14 8UY L14 8UZ L14 8XA |
| Ashton Way | L36 8AG |
| Astley Road | L36 8DB |
| Blackthorn Crescent | L28 1NT |
| Boode Croft | L28 4EF L28 4EG L28 4EH L28 4EL L28 4EN L28 4EQ L28 4EW L28 4EJ |
| Boydell Close | L28 6YA |
| Brandearth Hey | L28 1SA L28 1SB L28 1SD |
| Brushwood Road | L36 8FQ |
| Buckthorn Close | L28 1NU |
| Burrowdale Road | L28 1RR |
| Camdale Close | L28 3QD |
| Chalfont Way | L28 3QB |
| Cremorne Hey | L28 7RA L28 7RB L28 7RD |
| Custley Hey | L28 1RN L28 1RP L28 1RW |
| Dannette Hey | L28 6YE |
| Denes Way | L28 1NN |
| Earls Row | L36 8AQ |
| Forest Grove | L34 4AY |
| George Hale Avenue | L34 4AJ |
| Greenvalley Road | L28 3QG |
| Haleforest Grove | L28 3QH |
| Haswell Drive | L28 1RX L28 5RY |
| Hayfield Place | L28 3QL |
| Haywood Road | L28 4EX |
| Hillside Avenue | L36 8DT L36 8DY |
| Hollow Croft | L28 4EA L28 4EB L28 4ED L28 4EE |
| Juniper Close | L28 5RX |
| Little Moss Hey | L28 5RH L28 5RJ L28 5RL |
| Littlewood Avenue | L28 3QJ |
| Lordens Road | L14 8UA L14 8UB L14 8UD |
| Lyme Cross Road | L36 8EZ |
| Maple Leaf Drive | L36 8AW L36 8AX L36 8AY |
| Marled Hey | L28 0QL L28 0QR L28 0QT |
| Melbury Road | L14 8UR |
| Millbrook Way | L28 3QF |
| Norton Way | L36 8FR |
| Ontario Way | L36 8AT L36 8AU |
| Orange Tree Close | L28 7RJ |
| Parbrook Close | L36 3XH |
| Plum Tree Close | L28 7RL |
| Pool Hey | L28 4EP L28 4ER |
| Princess Drive | L14 9NA |
| Quickthorn Crescent | L28 1NY |
| Rosewood Close | L28 5RU |
| Roswell Court | L28 3QE |
| Round Hey | L28 1RB L28 1RF L28 1RG L28 1RQ |
| Ryding Road | L36 8AP |
| Saxby Road | L14 9NS |
| Sedgeley Walk | L36 8EP |
| Southdean Road | L14 8UW |
| Spruce Grove | L28 1NS L28 1SY |
| St Judes Place | L28 1AE |
| Stockbridge Lane | L36 3SB L36 3SD |
| Terret Croft | L28 6YB L28 6YD L28 6YN L28 6YW |
| The Birches | L28 7RQ |
| The Close | L28 6YH |
| The Court | L28 6YF |
| The Croft | L28 1NR |
| The Grove | L28 6YQ |
| The Mews | L28 6YL |
| The Spinney | L28 7RF L28 7RG |
| The Walk | L28 6YJ |
| The Withens | L28 1AB L28 1AA L28 1AD |
| Unsworth Road | L36 8AN |
| Vicarage Row | L28 1AF |
| Waterpark Drive | L28 3QA L28 6AA L28 7RE |
| Whitethorn Drive | L28 1NX |
| Wimborne Close | L14 8UH |
| Wimborne Road | L14 8UE |
| Woodfarm Hey | L28 1RH L28 1RJ L28 1RL |
| L28 1NW L28 1SZ L28 4ET L28 5RD L28 5RE L28 5RF L28 5RG L28 5RN L28 5RP L28 5RR L28 5RS L28 5RT L28 5RW L34 4AU L34 4AX |
Transport near Stockbridge
- FAQ
- Price Paid By Year
- Property Type Price
Frequently asked questions about Stockbridge
What is the average price for a property for sale in Stockbridge?
The average price for a property for sale in Stockbridge is £164,732. This amount is 9% lower than the average price in Liverpool. There are 981 property listings for sale in Stockbridge.
What streets have the most expensive properties for sale in Stockbridge?
The streets with the most expensive properties for sale in Stockbridge are Forest Grove at an average of £330,746, Hillside Avenue at an average of £221,720 and Ashton Way at an average of £185,000.
What streets have the most affordable properties for sale in Stockbridge?
The streets with the most affordable properties for sale in Stockbridge are Chalfont Way at an average of £74,250, Saxby Road at an average of £75,000 and Wimborne Close at an average of £93,000.
Which train stations are available in or near Stockbridge?
Some of the train stations available in or near Stockbridge are Roby, Huyton and Broad Green.
Property Price Paid in Stockbridge by Year
The average sold property price by year was:
| Year | Average Sold Price | Price Change |
Sold Properties
|
|---|---|---|---|
| 2025 | £136,348 | -8% |
27 Properties |
| 2024 | £147,641 | -26% |
50 Properties |
| 2023 | £186,344 | 22% |
75 Properties |
| 2022 | £145,303 | -13% |
63 Properties |
| 2021 | £163,987 | 13% |
96 Properties |
| 2020 | £142,461 | 11% |
61 Properties |
| 2019 | £126,759 | 18% |
98 Properties |
| 2018 | £103,742 | 4% |
48 Properties |
| 2017 | £99,611 | -2% |
45 Properties |
| 2016 | £101,931 | 12% |
74 Properties |
| 2015 | £89,203 | 16% |
47 Properties |
| 2014 | £74,741 | 12% |
61 Properties |
| 2013 | £66,102 | 2% |
22 Properties |
| 2012 | £64,722 | 5% |
9 Properties |
| 2011 | £61,642 | -5% |
7 Properties |
| 2010 | £64,714 | -11% |
7 Properties |
| 2009 | £71,749 | -32% |
6 Properties |
| 2008 | £94,650 | 10% |
34 Properties |
| 2007 | £84,809 | 8% |
58 Properties |
| 2006 | £77,850 | 14% |
30 Properties |
| 2005 | £67,053 | 10% |
26 Properties |
| 2004 | £60,336 | 31% |
50 Properties |
| 2003 | £41,929 | 27% |
40 Properties |
| 2002 | £30,690 | -4% |
31 Properties |
| 2001 | £32,057 | 12% |
19 Properties |
| 2000 | £28,187 | -4% |
24 Properties |
| 1999 | £29,359 | 1% |
23 Properties |
| 1998 | £29,079 | 21% |
22 Properties |
| 1997 | £23,008 | -29% |
24 Properties |
| 1996 | £29,700 | 1% |
21 Properties |
| 1995 | £29,282 | - |
16 Properties |
Property Price per Property Type in Stockbridge
Here you can find historic sold price data in order to help with your property search.
The average Property Paid Price for specific property types in the last three years are:
| Property Type | Average Sold Price | Sold Properties |
|---|---|---|
| Semi Detached House | £146,662.00 | 26 Semi Detached Houses |
| Detached House | £276,771.00 | 44 Detached Houses |
| Terraced House | £111,841.00 | 78 Terraced Houses |
| Flat | £81,125.00 | 4 Flats |

