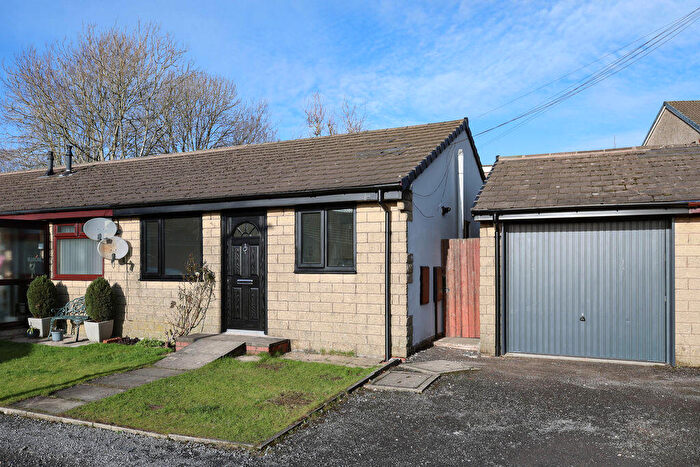
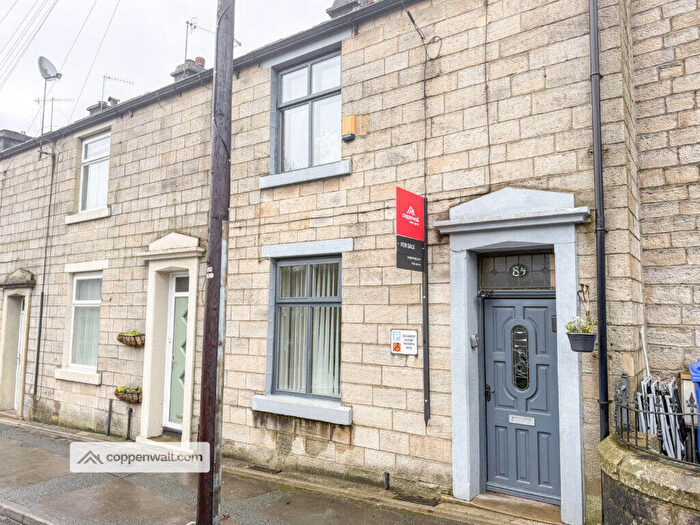
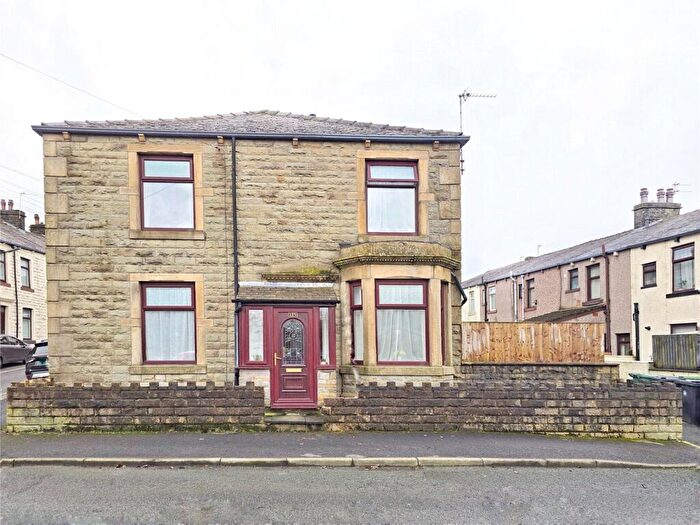
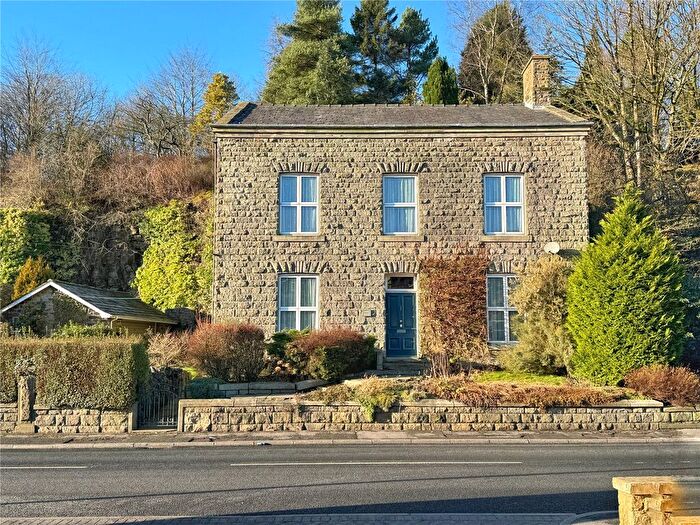
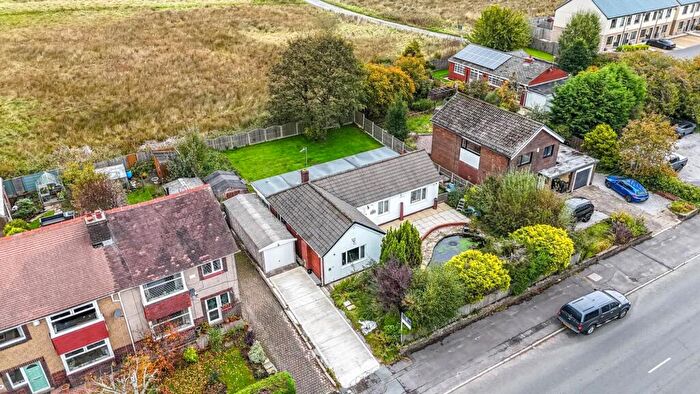
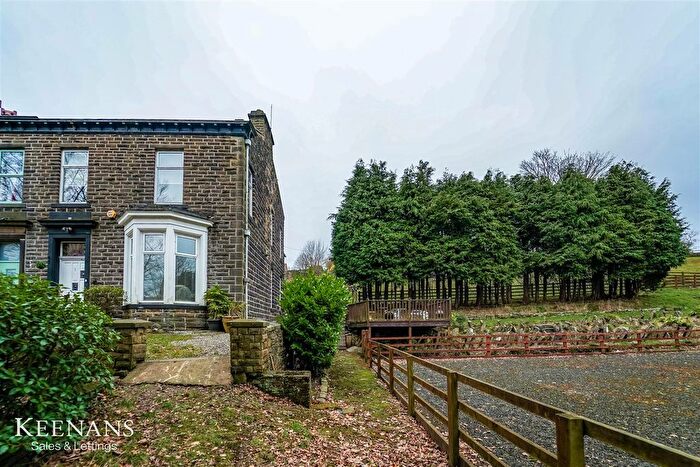
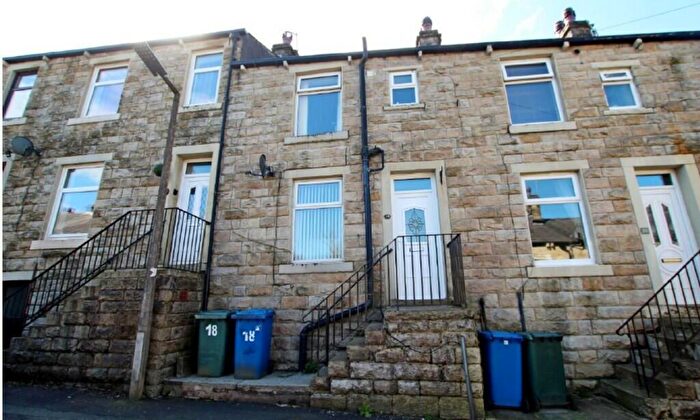
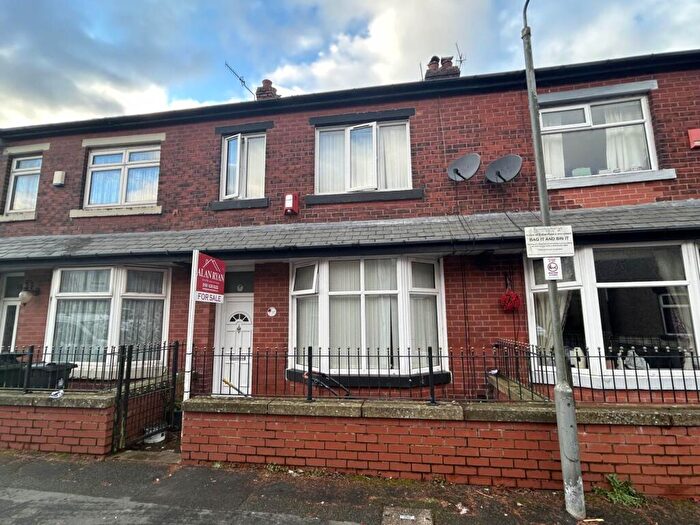
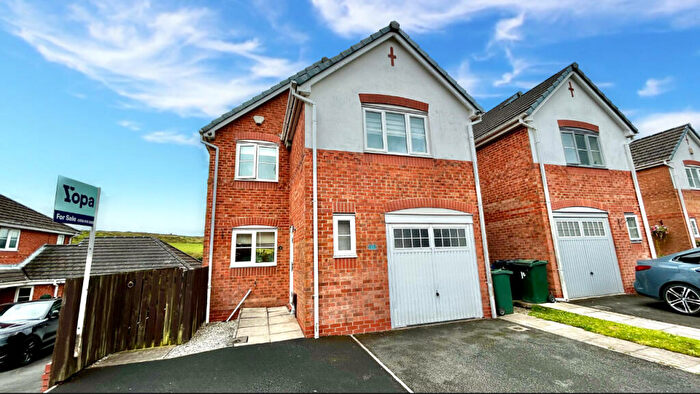
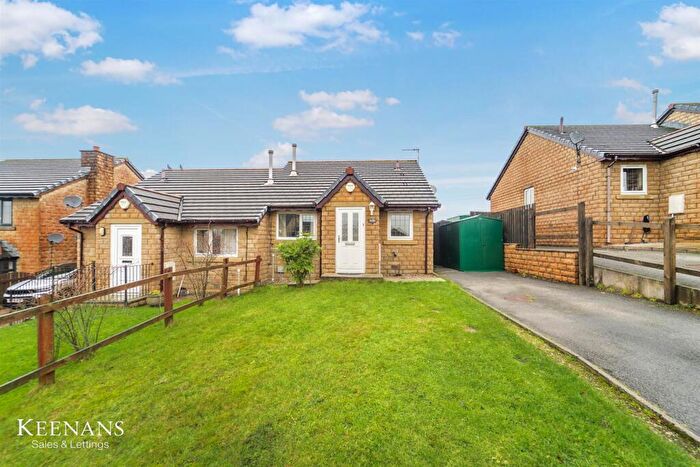
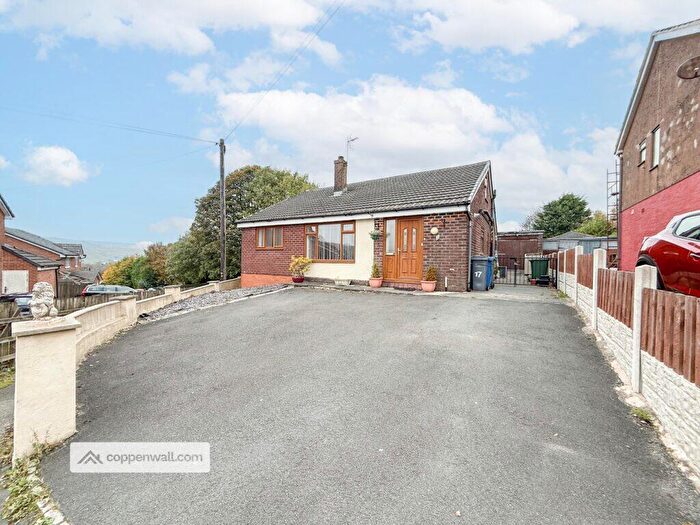
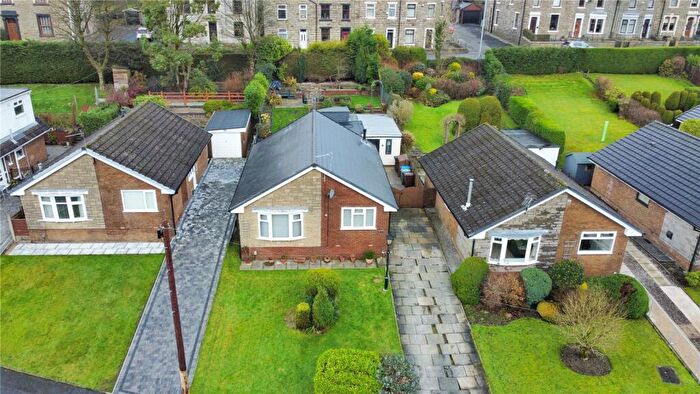
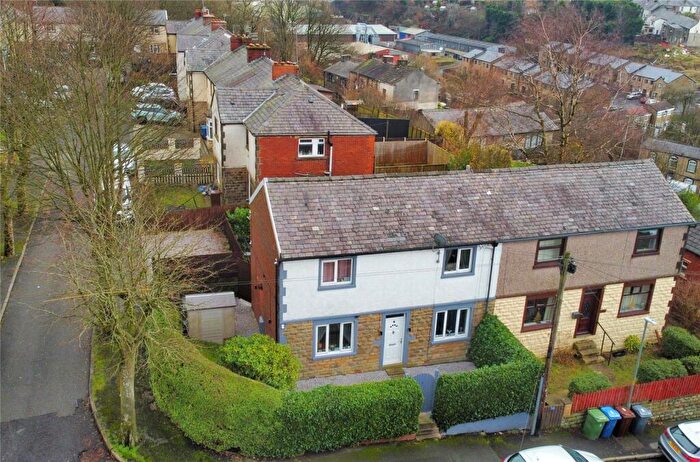
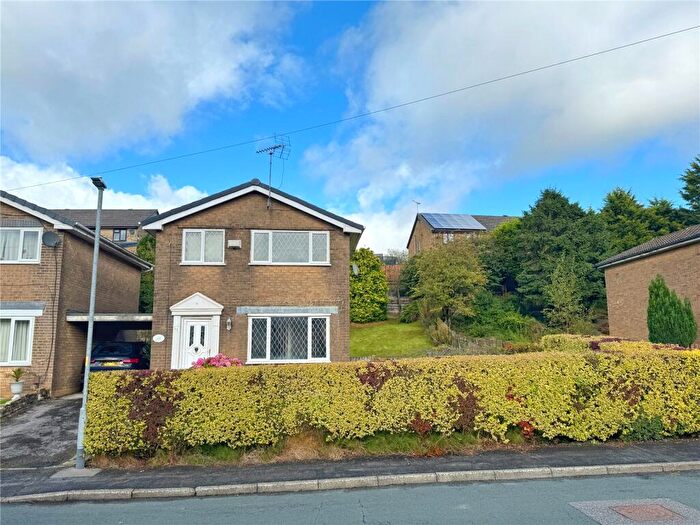
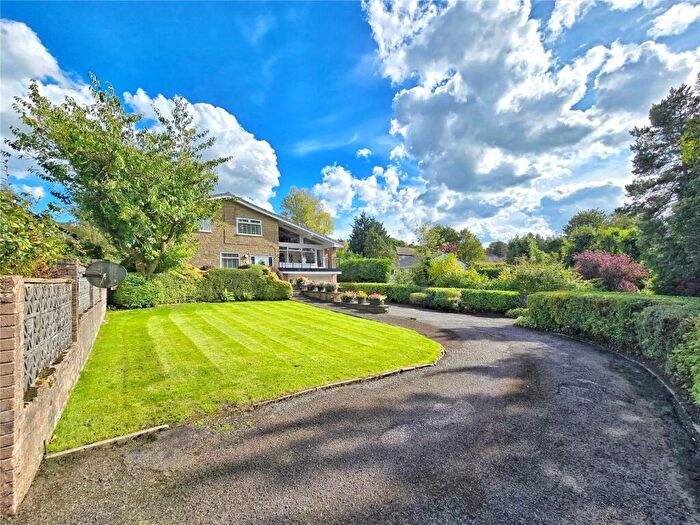
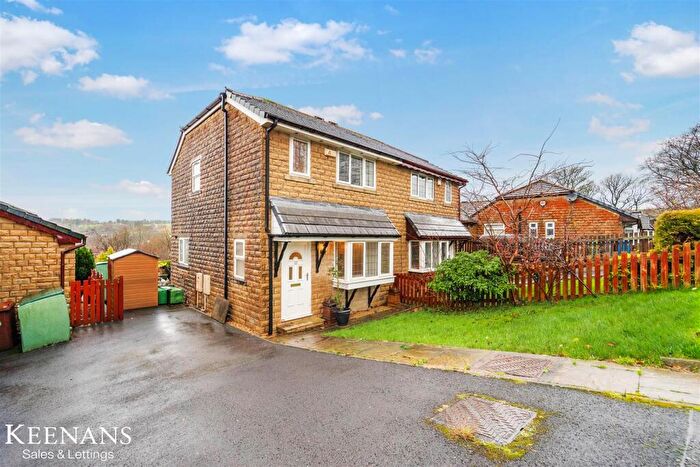
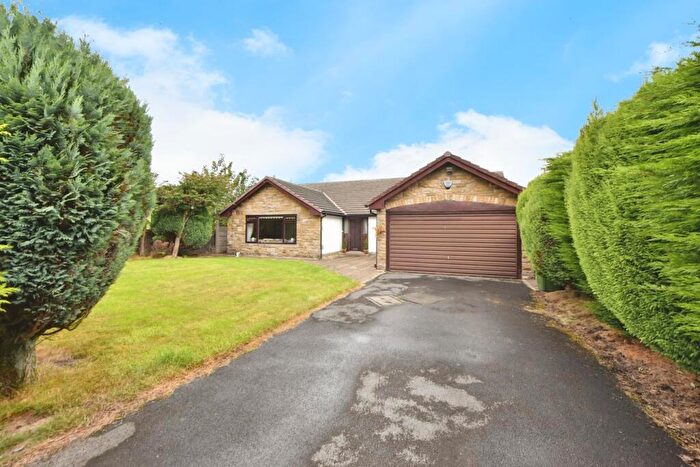
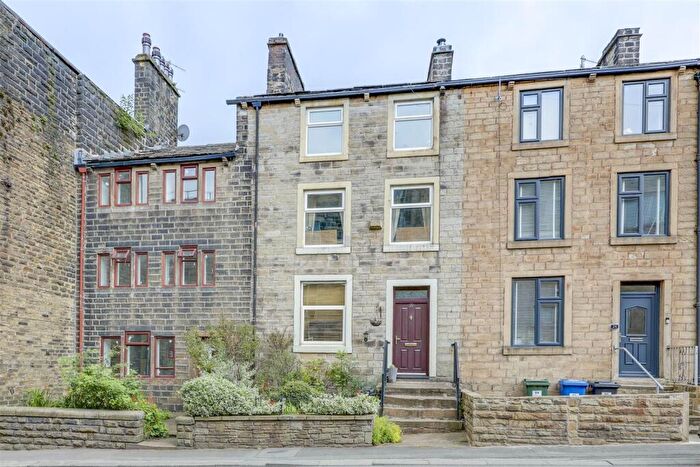
Houses for sale & to rent in Irwell, Bacup
House Prices in Irwell
Properties in Irwell have an average house price of £183,303.00 and had 234 Property Transactions within the last 3 years¹.
Irwell is an area in Bacup, Lancashire with 2,329 households², where the most expensive property was sold for £540,000.00.
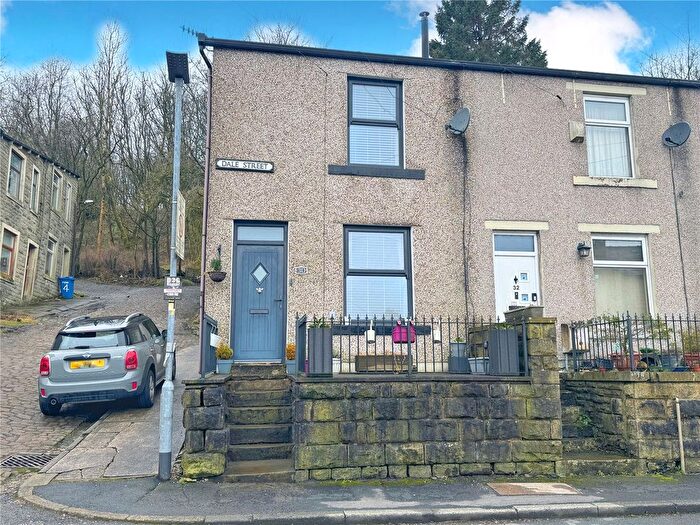
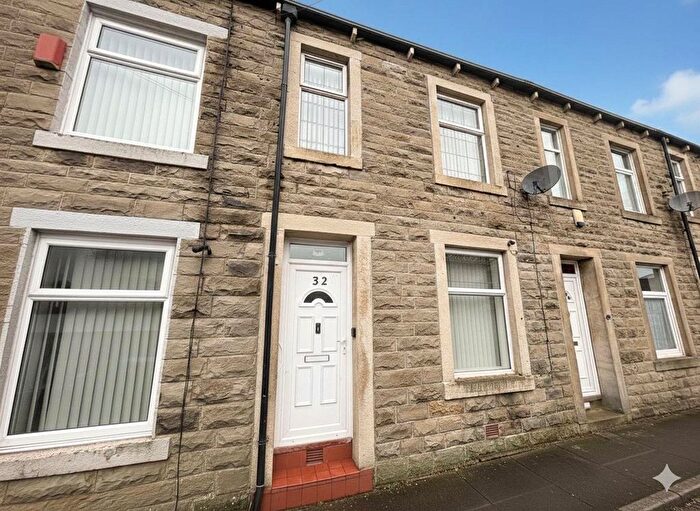
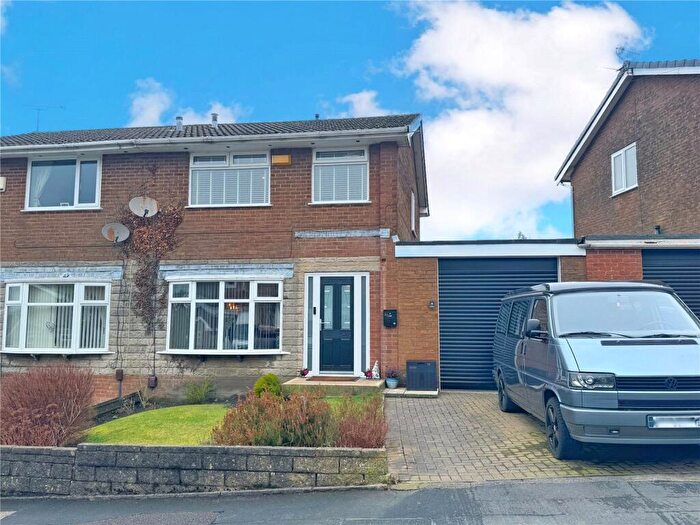
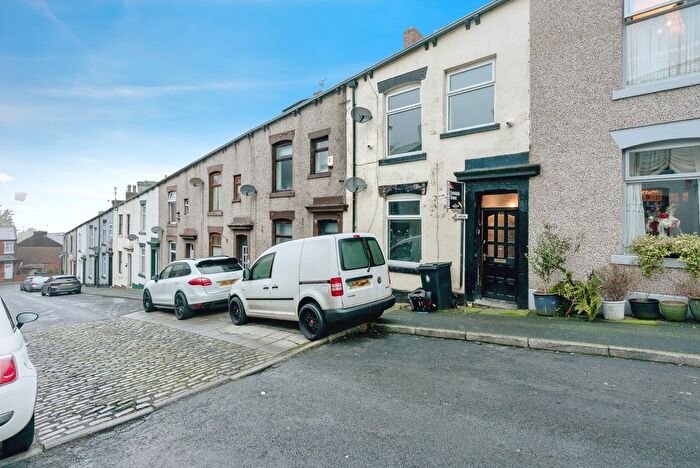
Properties for sale in Irwell
Roads and Postcodes in Irwell
Navigate through our locations to find the location of your next house in Irwell, Bacup for sale or to rent.
| Streets | Postcodes |
|---|---|
| Albion Street | OL13 9EQ |
| Alma Street | OL13 9JA |
| Arbour Street | OL13 9ED |
| Arthur Street | OL13 9EU |
| Ashworth Street | OL13 9LS |
| Back Yorkshire Street | OL13 9AG |
| Barker Court | OL13 9NT |
| Beaumont Close | OL13 9TJ |
| Beaver Terrace | OL13 9EN |
| Beech Industrial Estate | OL13 9EL |
| Bobbin Close | OL13 9BE |
| Brambling Drive | OL13 9QJ |
| Britannia Avenue | OL13 9JS |
| Callow Close | OL13 9SJ |
| Castletown Drive | OL13 9PW |
| Central View | OL13 9JX |
| Churchtown Crescent | OL13 9PL |
| Clough Road | OL13 9LP |
| Co Operation Street | OL13 9JH |
| Coal Pit Lane | OL13 9HA OL13 9EZ |
| Cobden Street | OL13 9TN |
| Cockerell Drive | OL13 9SG |
| Cotman Close | OL13 9TT |
| Cottonmill Court | OL13 9AY |
| Cowgill Street | OL13 9LX |
| Crabtree Avenue | OL13 9PF |
| Crimea Street | OL13 9JF |
| Crown Meadows | OL13 9QW |
| Darley Bank | OL13 9SP |
| Deansgreave Terrace | OL13 9SB |
| Douglas Road | OL13 9PR |
| Edge Lane | OL13 9SS |
| Edward Street | OL13 9EW |
| Ernest Street | OL13 9TB |
| Fairview Crescent | OL13 9LL |
| Farrington Road | OL13 9TE |
| Fieldfare Way | OL13 9PP |
| Foxdale Close | OL13 9PN |
| Gladstone Crescent | OL13 9JL |
| Gladstone Street | OL13 9JN OL13 9JY OL13 9NF |
| Goldcrest Avenue | OL13 9PA |
| Greave Close | OL13 9HR |
| Greave Clough Close | OL13 9HS |
| Greave Clough Drive | OL13 9HP |
| Greave Crescent | OL13 9HH |
| Greave Fold | OL13 9EY |
| Greave Road | OL13 9HQ |
| Greave Terrace | OL13 9HL |
| Green End Close | OL13 9HW |
| Grove Street | OL13 9EE |
| Hammerton Green | OL13 9BD |
| Hannah Street | OL13 9LR |
| Hawfinch Close | OL13 9PT |
| Hawthorn Road | OL13 9LQ |
| Hazel Grove | OL13 9XT |
| Height Barn Lane | OL13 0DB |
| Hoghton Avenue | OL13 9RD |
| Industrial Street | OL13 9JJ |
| Inkerman Street | OL13 9JD |
| Irwell Terrace | OL13 9AW |
| Lane End Road | OL13 9RG |
| Lee View | OL13 9RF |
| Lees Street | OL13 9SU |
| Mersey Street | OL13 9RQ |
| Mill Lane | OL13 9JB |
| Myrtle Cottages | OL13 9JU |
| Nelson Street | OL13 9TG |
| New Line | OL13 9RN OL13 9RU OL13 9RX OL13 9RY |
| New Line Industrial Estate | OL13 9RW |
| Nuttall Street | OL13 9EX |
| Oaken Close | OL13 9HB |
| Oakenclough Road | OL13 9ET OL13 9DJ |
| Onchan Drive | OL13 9PX |
| Peel Drive | OL13 9PU |
| Pendle Close | OL13 9JT |
| Pennine Road | OL13 9JP OL13 9JW OL13 9PH OL13 9PQ OL13 9PZ |
| Pickup Street | OL13 9AZ |
| Railgate | OL13 9WU |
| Ramsey Avenue | OL13 9PG OL13 9PJ |
| Regent Street | OL13 9JE |
| Repton Close | OL13 9TF |
| Ribble Street | OL13 9RH |
| Rochdale Road | OL13 9NR OL13 9RA OL13 9SD OL13 9SE OL13 9TH OL13 9TW OL13 9NZ OL13 9TS |
| Rockcliffe Lane | OL13 9NB |
| Ronaldsway Close | OL13 9PY |
| Rosendale Close | OL13 9LW |
| Rosendale Crescent | OL13 9LN |
| Sandby Close | OL13 9TP |
| Sandfield Road | OL13 9PB OL13 9PD |
| Sandstone Row | OL13 9AU |
| Siskin Avenue | OL13 9BH |
| South Street | OL13 9AP OL13 9AX OL13 9HU OL13 9NE OL13 9NG |
| Springfield Avenue | OL13 9HE |
| St James Square | OL13 9AH |
| Station Court | OL13 9PS |
| Stone Road | OL13 0DQ |
| Stonechat Close | OL13 9BJ |
| Sutcliffe Street | OL13 9TA |
| The Ferns | OL13 9RP |
| Thorn Bank | OL13 9LD |
| Thorn Crescent | OL13 9LB |
| Thorn Drive | OL13 9LF |
| Thorn Gardens | OL13 9LE |
| Thorn Street | OL13 9JG |
| Todmorden Road | OL13 9EG OL13 9EF |
| Tong Lane | OL13 9LH OL13 9XA OL13 9XB OL13 9XD OL13 9BB OL13 9HN OL13 9JQ OL13 9LJ OL13 9SW |
| Vale Street | OL13 9EP OL13 9EJ |
| Varley Close | OL13 9SH |
| Venture Street | OL13 9LZ |
| Walton Close | OL13 9RE |
| Warcock Lane | OL13 9ES |
| Warkworth Terrace | OL13 9LY |
| Warren Drive | OL13 9SZ |
| William Street | OL13 9TD |
| Woodlark Close | OL13 9AT |
| Yorkshire Street | OL13 9AE |
| Zion Street | OL13 9LT |
| OL13 9HT OL13 9RS OL13 9RZ OL13 9TL |
Transport near Irwell
-
Walsden Station
-
Todmorden Station
-
Littleborough Station
-
Smithy Bridge Station
-
Rochdale Station
-
Burnley Manchester Road Station
-
Burnley Central Station
-
Burnley Barracks Station
-
Rose Grove Station
-
Castleton Station
- FAQ
- Price Paid By Year
- Property Type Price
Frequently asked questions about Irwell
What is the average price for a property for sale in Irwell?
The average price for a property for sale in Irwell is £183,303. This amount is 9% higher than the average price in Bacup. There are 774 property listings for sale in Irwell.
What streets have the most expensive properties for sale in Irwell?
The streets with the most expensive properties for sale in Irwell are Coal Pit Lane at an average of £467,500, Hazel Grove at an average of £388,500 and Mill Lane at an average of £385,000.
What streets have the most affordable properties for sale in Irwell?
The streets with the most affordable properties for sale in Irwell are Alma Street at an average of £58,293, Warkworth Terrace at an average of £63,500 and Thorn Crescent at an average of £67,500.
Which train stations are available in or near Irwell?
Some of the train stations available in or near Irwell are Walsden, Todmorden and Littleborough.
Property Price Paid in Irwell by Year
The average sold property price by year was:
| Year | Average Sold Price | Price Change |
Sold Properties
|
|---|---|---|---|
| 2025 | £202,246 | 9% |
75 Properties |
| 2024 | £184,006 | 11% |
82 Properties |
| 2023 | £164,102 | -9% |
77 Properties |
| 2022 | £178,484 | 10% |
115 Properties |
| 2021 | £160,083 | 8% |
103 Properties |
| 2020 | £147,514 | 11% |
105 Properties |
| 2019 | £131,964 | 2% |
112 Properties |
| 2018 | £129,725 | -10% |
93 Properties |
| 2017 | £142,997 | 10% |
138 Properties |
| 2016 | £128,276 | 17% |
123 Properties |
| 2015 | £106,122 | -19% |
91 Properties |
| 2014 | £125,833 | -2% |
103 Properties |
| 2013 | £128,037 | 2% |
59 Properties |
| 2012 | £124,947 | 7% |
45 Properties |
| 2011 | £116,262 | -2% |
69 Properties |
| 2010 | £118,664 | -9% |
65 Properties |
| 2009 | £129,416 | -7% |
64 Properties |
| 2008 | £138,326 | -2% |
93 Properties |
| 2007 | £141,406 | 20% |
172 Properties |
| 2006 | £113,589 | 8% |
162 Properties |
| 2005 | £104,138 | 29% |
101 Properties |
| 2004 | £74,269 | 13% |
136 Properties |
| 2003 | £64,879 | 25% |
125 Properties |
| 2002 | £48,421 | 12% |
122 Properties |
| 2001 | £42,498 | -1% |
88 Properties |
| 2000 | £43,016 | 13% |
90 Properties |
| 1999 | £37,295 | -10% |
59 Properties |
| 1998 | £41,057 | 3% |
79 Properties |
| 1997 | £39,947 | 16% |
61 Properties |
| 1996 | £33,421 | -3% |
43 Properties |
| 1995 | £34,474 | - |
44 Properties |
Property Price per Property Type in Irwell
Here you can find historic sold price data in order to help with your property search.
The average Property Paid Price for specific property types in the last three years are:
| Property Type | Average Sold Price | Sold Properties |
|---|---|---|
| Semi Detached House | £171,054.00 | 52 Semi Detached Houses |
| Detached House | £293,636.00 | 71 Detached Houses |
| Terraced House | £118,467.00 | 111 Terraced Houses |

