
Houses for sale & to rent in OL13 9TB, Ernest Street, Irwell, Bacup
House Prices in OL13 9TB, Ernest Street, Irwell
Properties in OL13 9TB have an average house price of £80k and had 1 Property Transaction within the last 3 years.¹ OL13 9TB is a postcode in Ernest Street located in Irwell, an area in Bacup, Lancashire, with 5 households², where the most expensive property was sold for £80k.
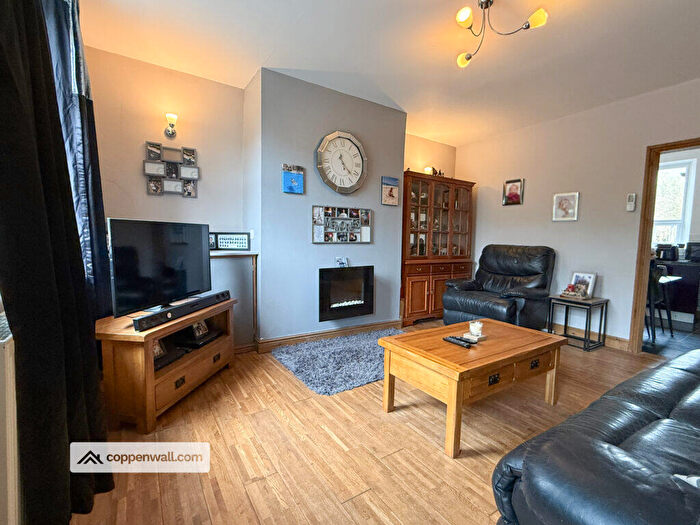
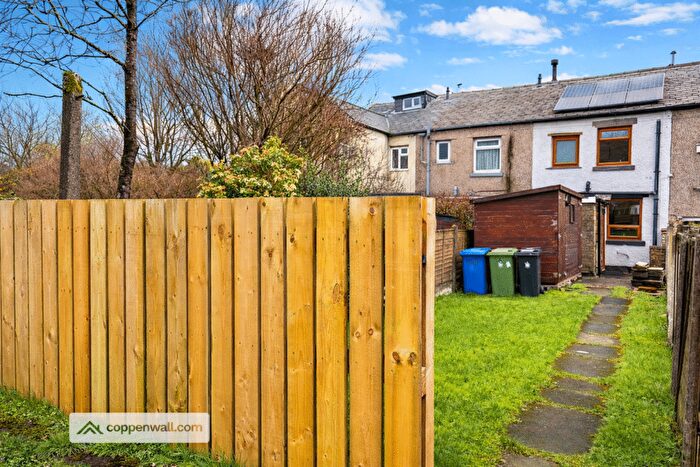
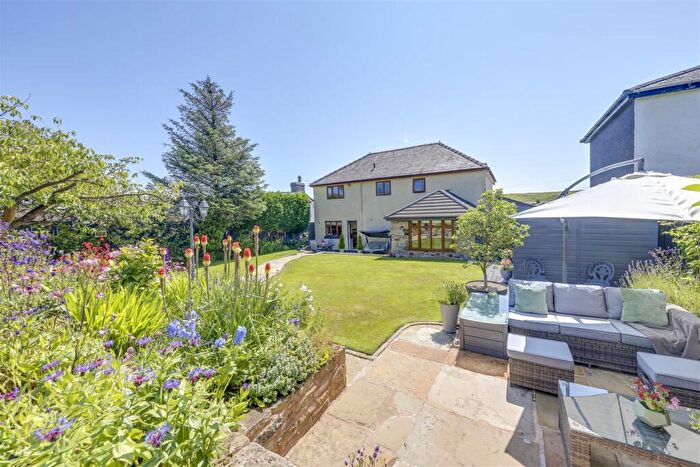
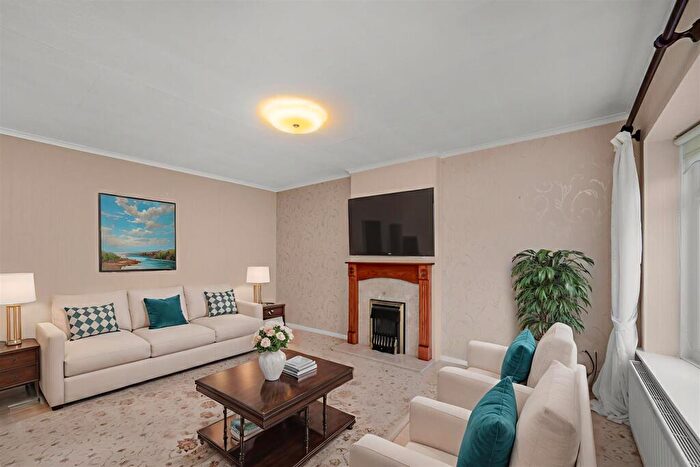
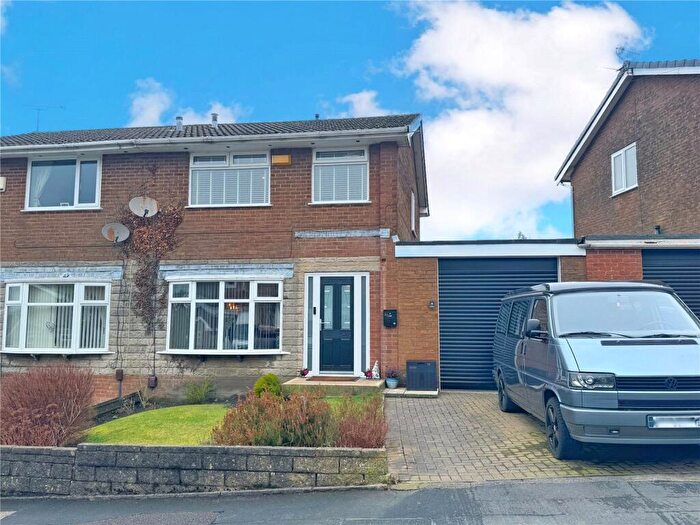
Properties for sale near OL13 9TB, Ernest Street
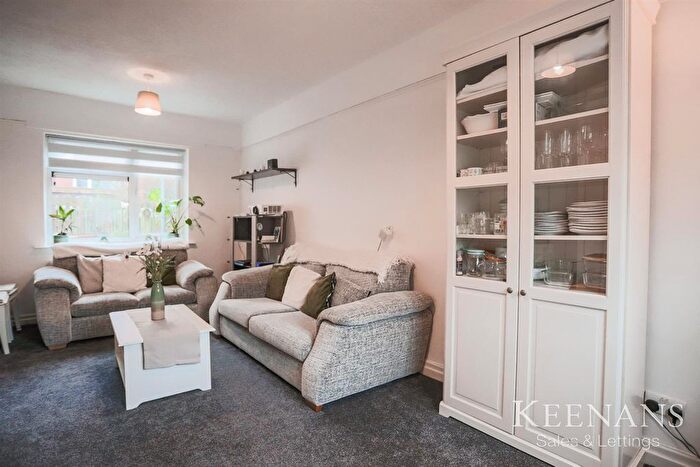
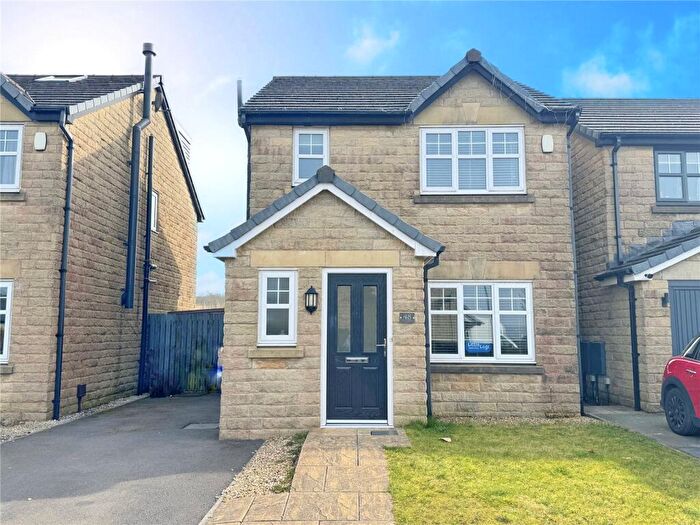
![]()
If you are looking to sell your house, let it out, or receive a property valuation, an expert can help you.
Click the button below to get started.
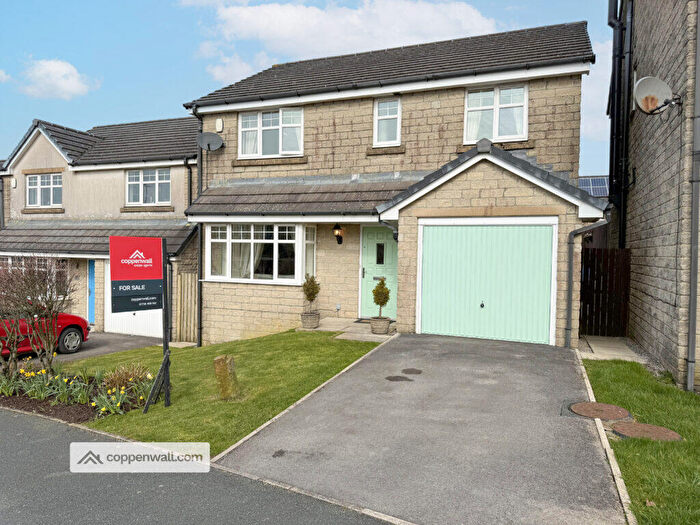
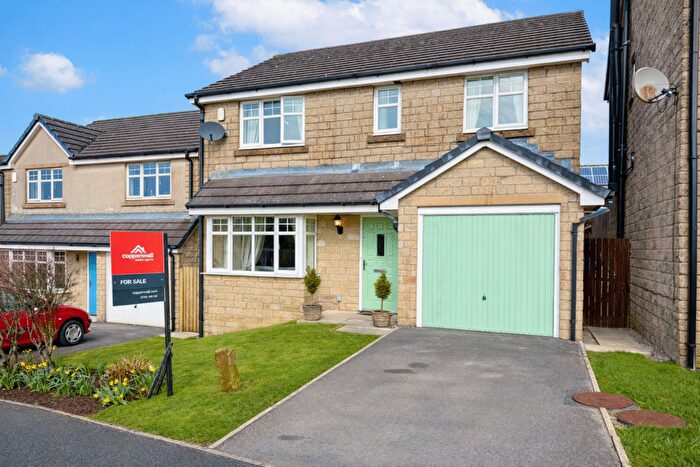
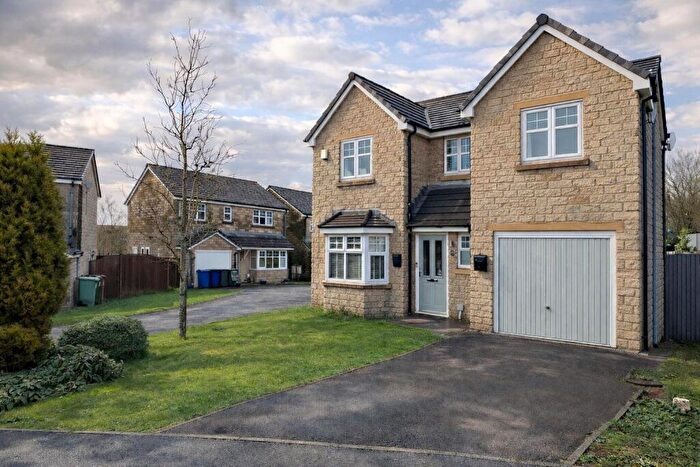
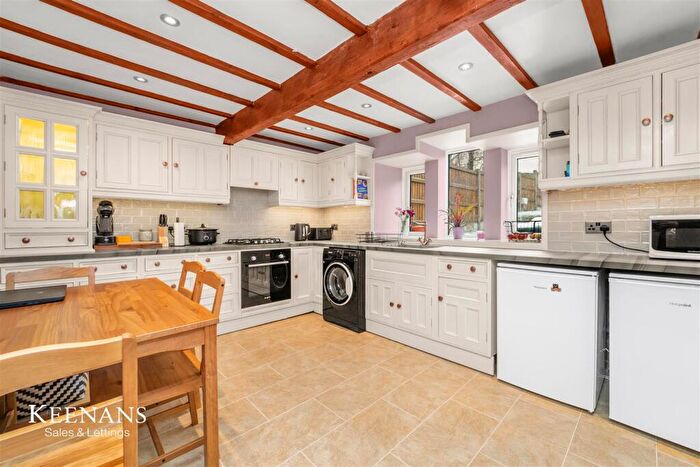
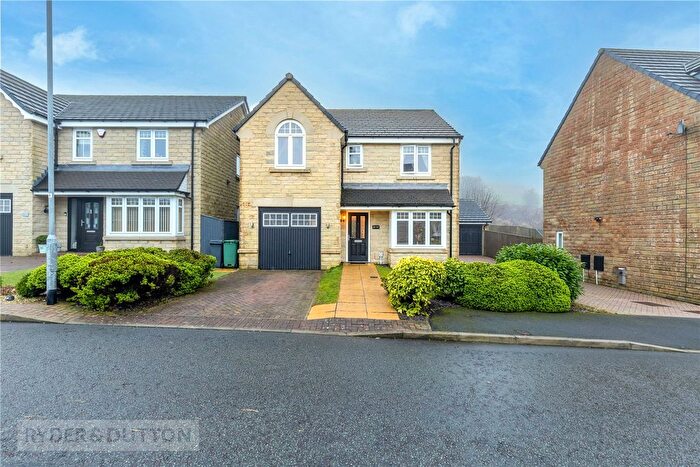
Previously listed properties near OL13 9TB, Ernest Street
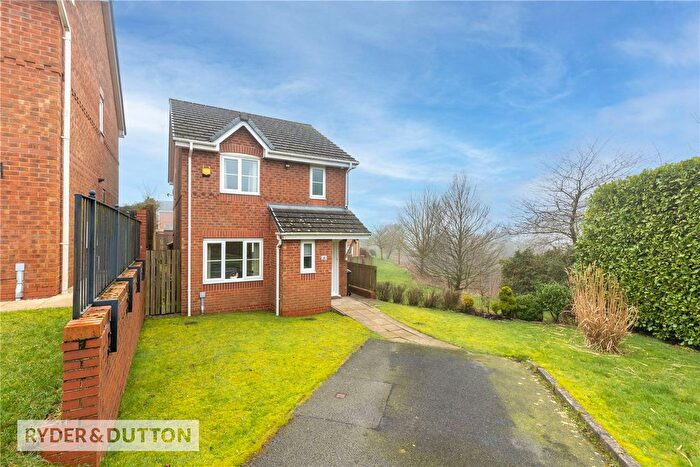
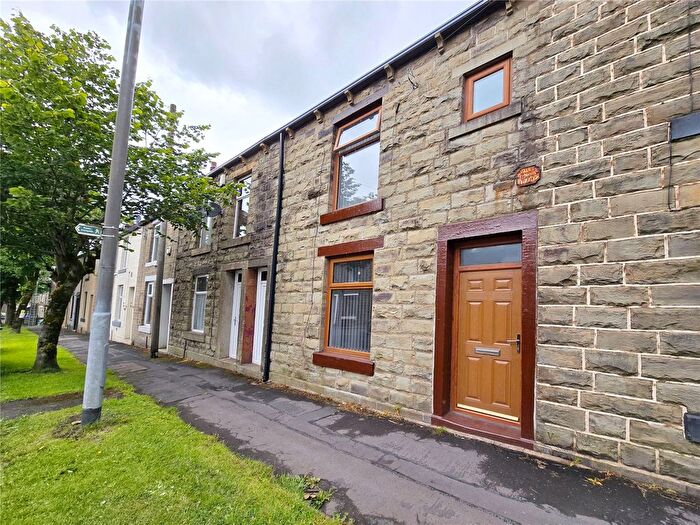
![]()
If you are looking to sell your house, let it out, or receive a property valuation, an expert can help you.
Click the button below to get started.
Price Paid in Ernest Street, OL13 9TB, Irwell
22 Ernest Street, OL13 9TB, Irwell Bacup
Property 22 has been sold 1 time. The last time it was sold was in 31/01/2025 and the sold price was £80,000.00.
This terraced house, sold as a freehold on 31/01/2025, is a 130 sqm mid-terrace house with an EPC rating of D.
| Date | Price | Property Type | Tenure | Classification |
|---|---|---|---|---|
| 31/01/2025 | £80,000.00 | Terraced House | freehold | Established Building |
16 Ernest Street, OL13 9TB, Irwell Bacup
Property 16 has been sold 4 times. The last time it was sold was in 28/08/2020 and the sold price was £110,000.00.
This terraced house, sold as a leasehold on 28/08/2020, is a 176 sqm end-terrace house with an EPC rating of D.
| Date | Price | Property Type | Tenure | Classification |
|---|---|---|---|---|
| 28/08/2020 | £110,000.00 | Terraced House | leasehold | Established Building |
| 28/10/2002 | £95,000.00 | Terraced House | leasehold | Established Building |
| 14/12/2001 | £41,500.00 | Terraced House | leasehold | Established Building |
| 10/07/2000 | £40,000.00 | Terraced House | leasehold | Established Building |
24 Ernest Street, OL13 9TB, Irwell Bacup
Property 24 has been sold 1 time. The last time it was sold was in 29/05/1998 and the sold price was £40,000.00.
This is a Terraced House which was sold as a leasehold in 29/05/1998
| Date | Price | Property Type | Tenure | Classification |
|---|---|---|---|---|
| 29/05/1998 | £40,000.00 | Terraced House | leasehold | Established Building |
20 Ernest Street, OL13 9TB, Irwell Bacup
Property 20 has been sold 1 time. The last time it was sold was in 09/04/1998 and the sold price was £36,750.00.
This is a Terraced House which was sold as a leasehold in 09/04/1998
| Date | Price | Property Type | Tenure | Classification |
|---|---|---|---|---|
| 09/04/1998 | £36,750.00 | Terraced House | leasehold | Established Building |
Transport near OL13 9TB, Ernest Street

House price paid reports for OL13 9TB, Ernest Street
Click on the buttons below to see price paid reports by year or property price:
- Price Paid By Year
- Property Type Price
Property Price Paid in OL13 9TB, Ernest Street by Year
The average sold property price by year was:
| Year | Average Sold Price | Price Change |
Sold Properties
|
|---|---|---|---|
| 2025 | £80,000 | -38% |
1 Property |
| 2020 | £110,000 | 14% |
1 Property |
| 2002 | £95,000 | 56% |
1 Property |
| 2001 | £41,500 | 4% |
1 Property |
| 2000 | £40,000 | 4% |
1 Property |
| 1998 | £38,375 | - |
2 Properties |
Property Price per Property Type in OL13 9TB, Ernest Street
Here you can find historic sold price data in order to help with your property search.
The average Property Paid Price for specific property types in the last three years are:
| Property Type | Average Sold Price | Sold Properties |
|---|---|---|
| Terraced House | £80,000.00 | 1 Terraced House |