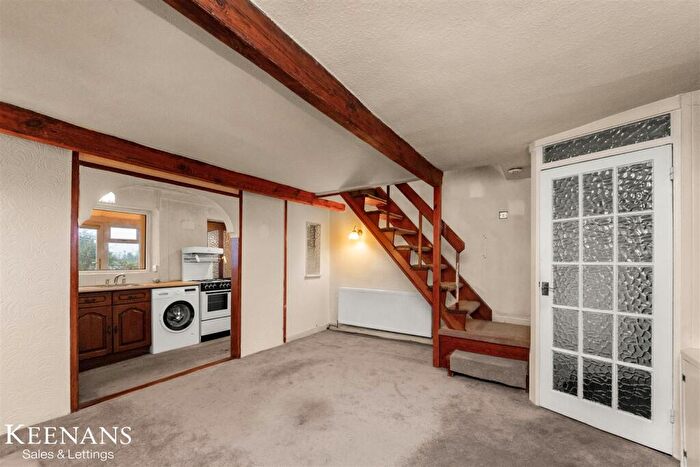
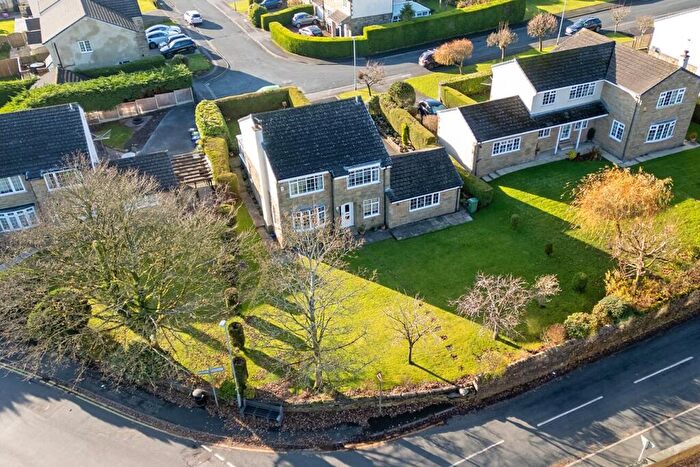
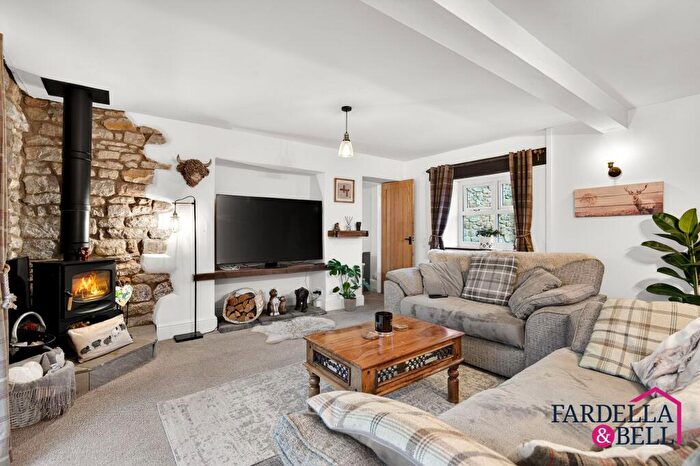
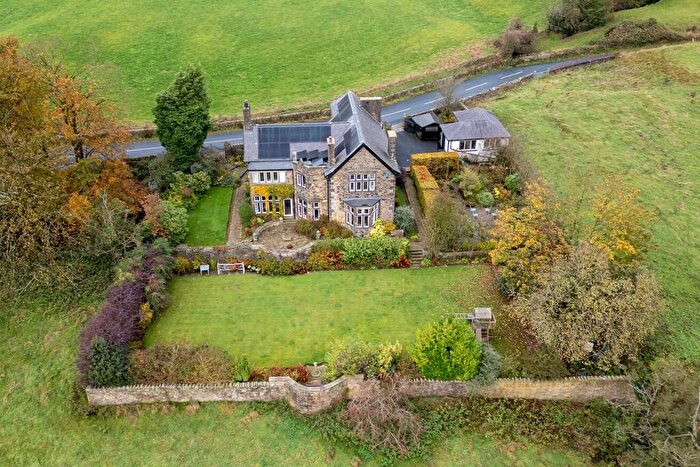
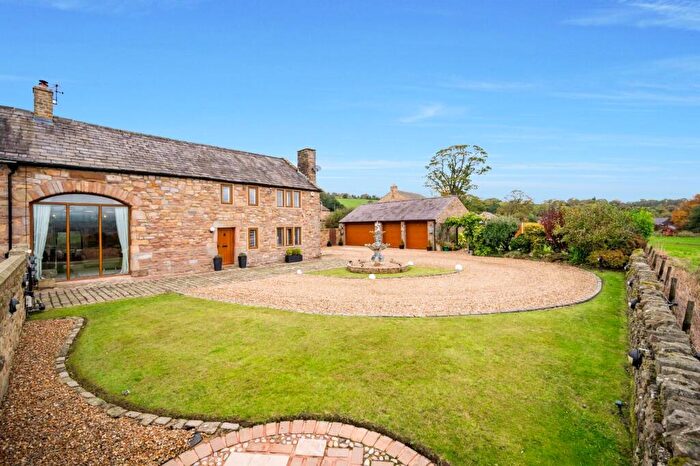
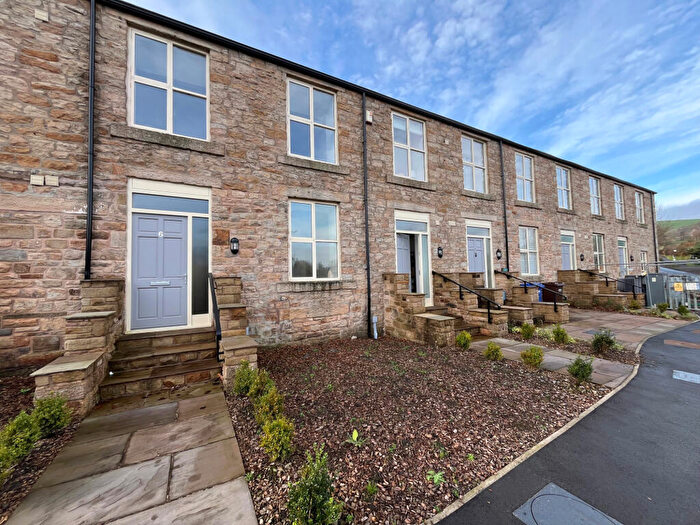
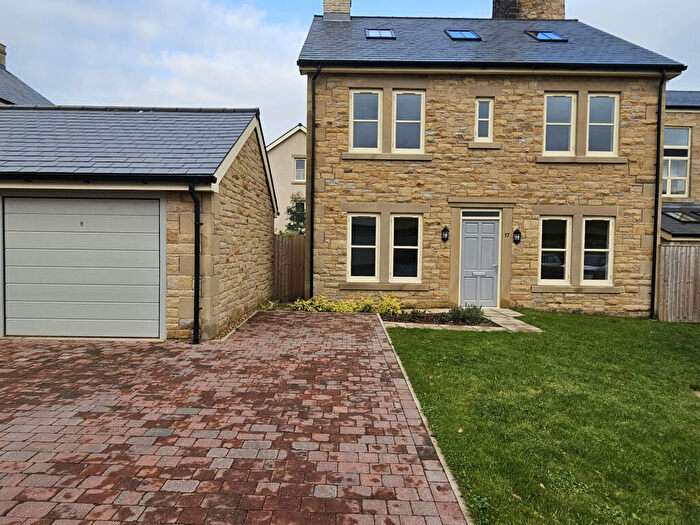
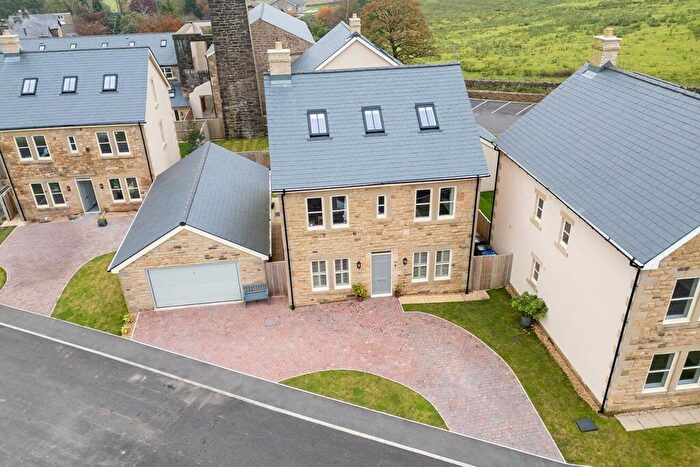
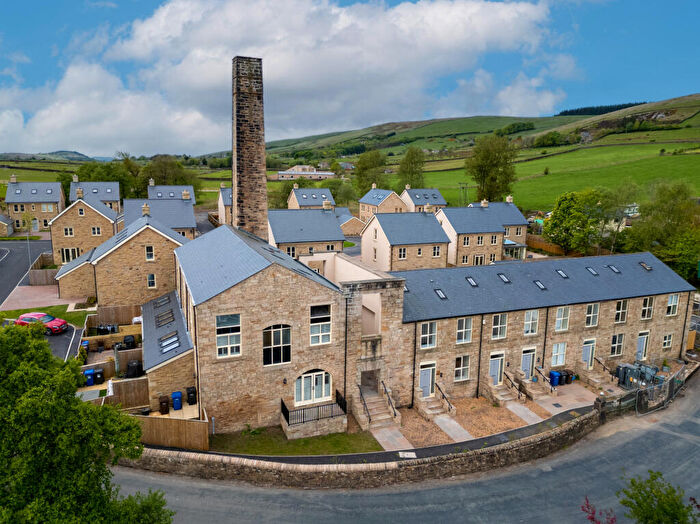
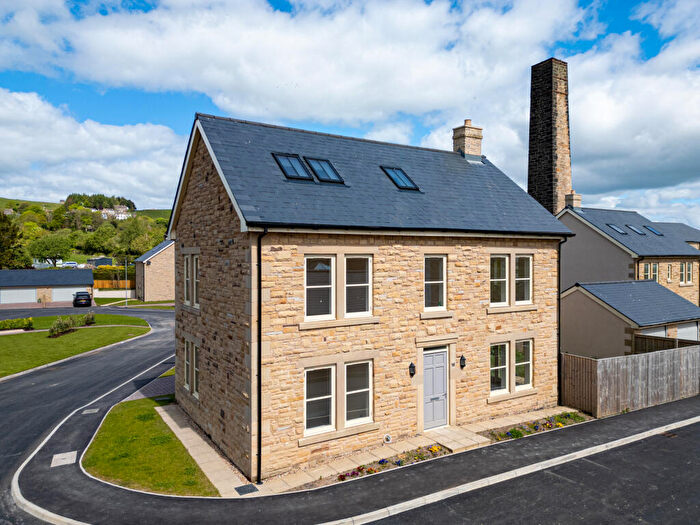
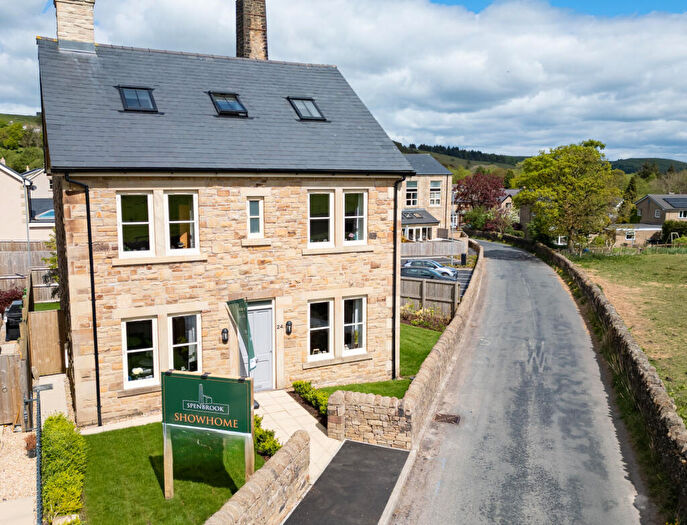
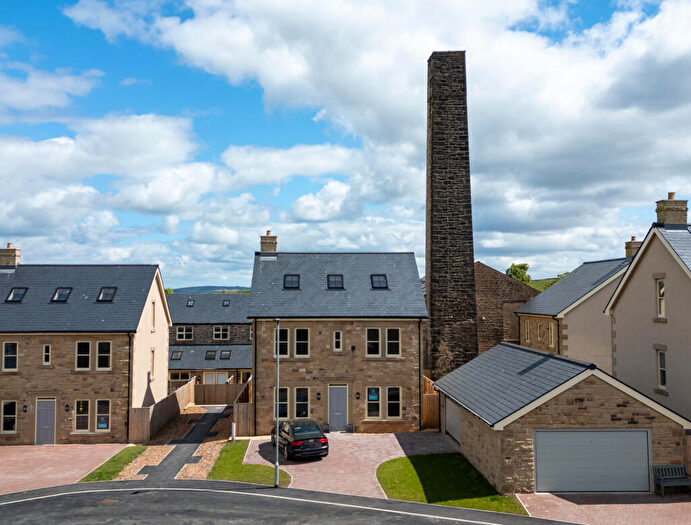
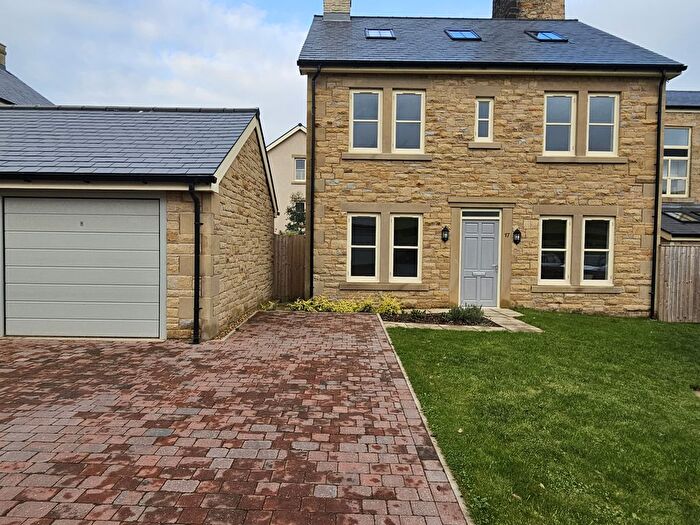
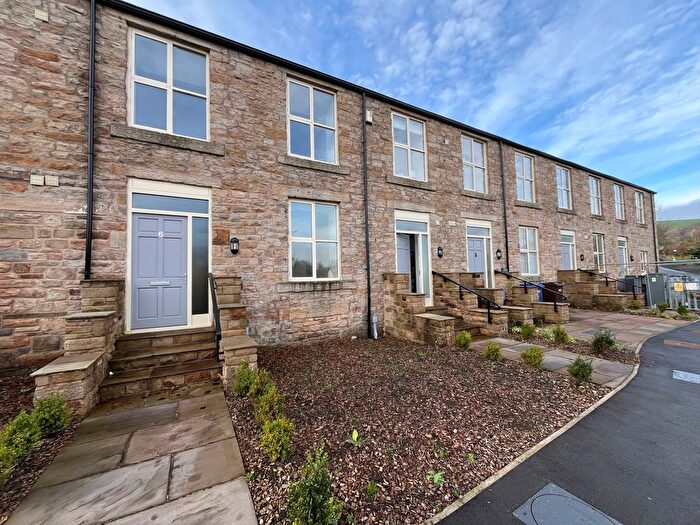
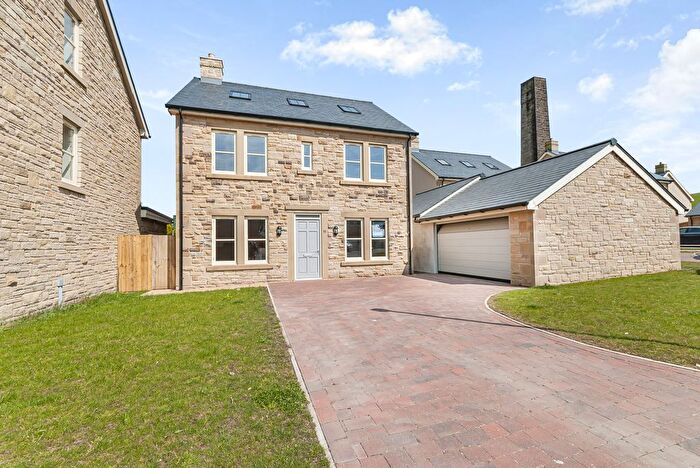
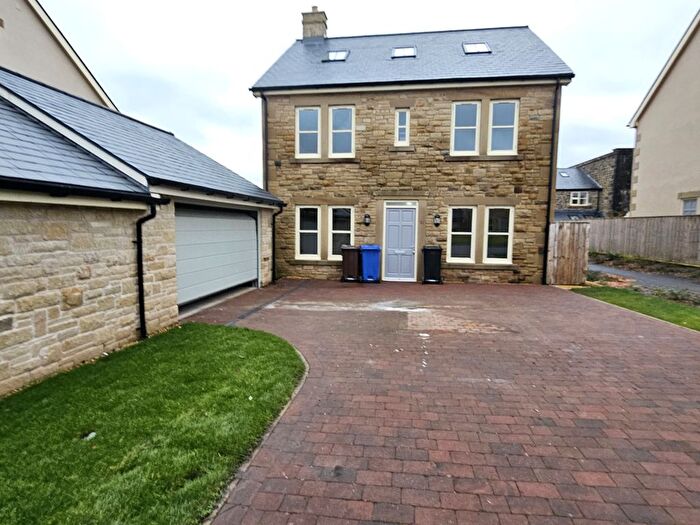
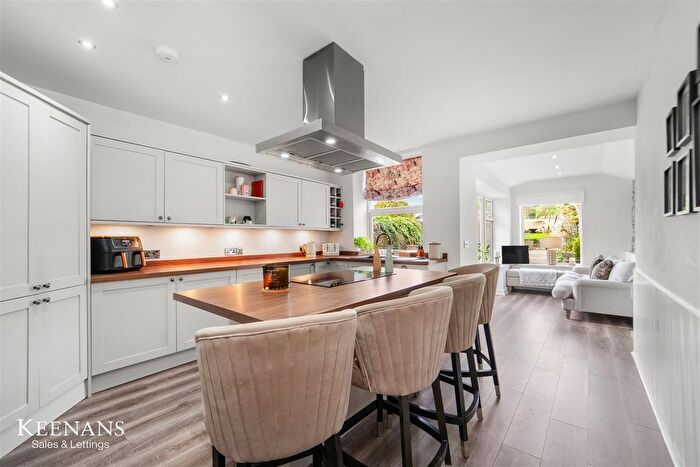
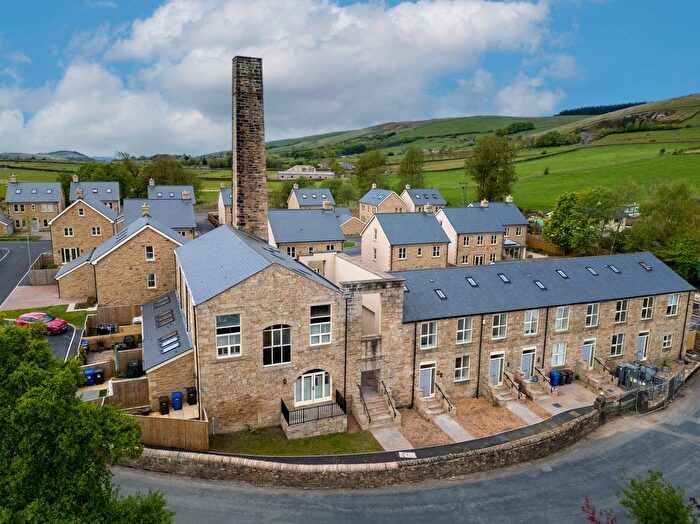
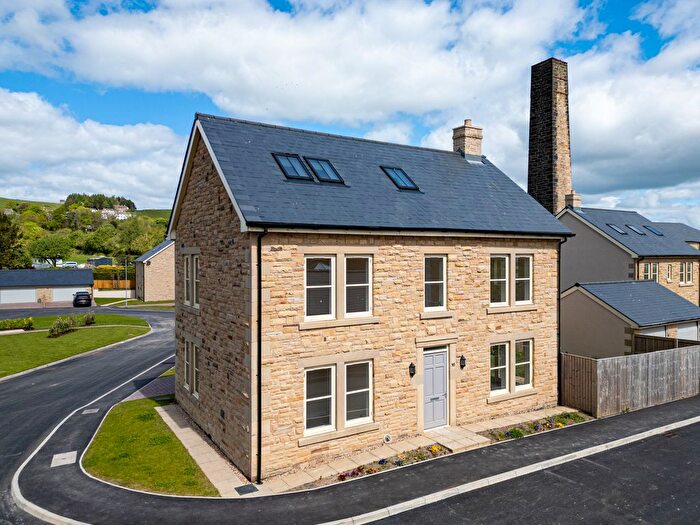
Houses for sale & to rent in Old Laund Booth, Burnley
House Prices in Old Laund Booth
Properties in Old Laund Booth have an average house price of £287,967.00 and had 53 Property Transactions within the last 3 years¹.
Old Laund Booth is an area in Burnley, Lancashire with 642 households², where the most expensive property was sold for £520,000.00.
Properties for sale in Old Laund Booth
Previously listed properties in Old Laund Booth
Roads and Postcodes in Old Laund Booth
Navigate through our locations to find the location of your next house in Old Laund Booth, Burnley for sale or to rent.
| Streets | Postcodes |
|---|---|
| Catlow Closes | BB12 9QB |
| Cuckstool Lane | BB12 9PB |
| Deer Chace | BB12 9PH |
| Fence Gate | BB12 9EG |
| Field Top Court | BB12 9AH |
| Forest Avenue | BB12 9EW |
| Forester Drive | BB12 9PG |
| Green Bank Drive | BB12 9QJ |
| Greenhead Lane | BB12 9DX |
| Greystones Drive | BB12 9PJ |
| Harpers Lane | BB12 9PD BB12 9PF |
| Heatherlea Road | BB12 9EJ |
| Heathgate | BB12 9PQ |
| Heights Lane | BB12 9JF |
| Hoarstones Avenue | BB12 9DZ |
| Lane Top | BB12 9QR |
| Laund Gate | BB12 9PL |
| Millbrook | BB12 9PE |
| Noggarth Road | BB12 9PN BB12 9PW |
| Old Laund Street | BB12 9EN |
| Pendle Fields | BB12 9HN |
| Spencer Fold | BB12 9QF |
| St Annes Drive | BB12 9DY |
| St Annes Way | BB12 9HL |
| Tunstill Fold | BB12 9QE |
| Uplands Drive | BB12 9EQ |
| Wheatcroft Avenue | BB12 9QL |
| Wheatley Close | BB12 9QH |
| Wheatley Lane Road | BB12 9EA BB12 9EB BB12 9ED BB12 9EE BB12 9EP BB12 9PZ BB12 9QA BB12 9QD BB12 9QG |
| Woodbury Avenue | BB12 9EH |
| BB12 9NU |
Transport near Old Laund Booth
- FAQ
- Price Paid By Year
- Property Type Price
Frequently asked questions about Old Laund Booth
What is the average price for a property for sale in Old Laund Booth?
The average price for a property for sale in Old Laund Booth is £287,967. This amount is 114% higher than the average price in Burnley. There are 170 property listings for sale in Old Laund Booth.
What streets have the most expensive properties for sale in Old Laund Booth?
The streets with the most expensive properties for sale in Old Laund Booth are Heights Lane at an average of £520,000, Uplands Drive at an average of £485,000 and Green Bank Drive at an average of £425,000.
What streets have the most affordable properties for sale in Old Laund Booth?
The streets with the most affordable properties for sale in Old Laund Booth are Old Laund Street at an average of £138,000, Forester Drive at an average of £193,750 and Spencer Fold at an average of £209,150.
Which train stations are available in or near Old Laund Booth?
Some of the train stations available in or near Old Laund Booth are Brierfield, Nelson and Burnley Central.
Property Price Paid in Old Laund Booth by Year
The average sold property price by year was:
| Year | Average Sold Price | Price Change |
Sold Properties
|
|---|---|---|---|
| 2025 | £289,200 | -4% |
17 Properties |
| 2024 | £299,526 | 8% |
17 Properties |
| 2023 | £276,523 | -16% |
19 Properties |
| 2022 | £321,829 | 7% |
27 Properties |
| 2021 | £300,034 | 11% |
37 Properties |
| 2020 | £266,437 | 27% |
22 Properties |
| 2019 | £194,903 | -18% |
26 Properties |
| 2018 | £229,499 | 6% |
26 Properties |
| 2017 | £215,760 | -10% |
30 Properties |
| 2016 | £236,827 | 5% |
29 Properties |
| 2015 | £224,393 | 6% |
29 Properties |
| 2014 | £211,530 | -5% |
28 Properties |
| 2013 | £221,157 | 19% |
20 Properties |
| 2012 | £179,750 | -5% |
22 Properties |
| 2011 | £188,635 | -11% |
23 Properties |
| 2010 | £209,647 | -1% |
23 Properties |
| 2009 | £210,829 | 9% |
12 Properties |
| 2008 | £190,897 | -16% |
21 Properties |
| 2007 | £222,173 | 11% |
32 Properties |
| 2006 | £196,715 | 14% |
38 Properties |
| 2005 | £168,831 | -5% |
30 Properties |
| 2004 | £176,696 | 2% |
47 Properties |
| 2003 | £172,496 | 41% |
28 Properties |
| 2002 | £102,242 | 5% |
34 Properties |
| 2001 | £97,148 | 6% |
39 Properties |
| 2000 | £91,469 | 15% |
30 Properties |
| 1999 | £77,861 | 7% |
30 Properties |
| 1998 | £72,405 | -13% |
30 Properties |
| 1997 | £81,619 | 13% |
38 Properties |
| 1996 | £71,291 | 6% |
17 Properties |
| 1995 | £67,062 | - |
27 Properties |
Property Price per Property Type in Old Laund Booth
Here you can find historic sold price data in order to help with your property search.
The average Property Paid Price for specific property types in the last three years are:
| Property Type | Average Sold Price | Sold Properties |
|---|---|---|
| Semi Detached House | £271,090.00 | 16 Semi Detached Houses |
| Detached House | £391,263.00 | 15 Detached Houses |
| Terraced House | £229,813.00 | 22 Terraced Houses |

