
Houses for sale in Burnley, Lancashire
House Prices in Burnley
Properties in Burnley have an average house price of £136k and had 5,319 Property Transactions within the last 3 years.¹
Burnley is an area in Lancashire with 43,124 households², where the most expensive property was sold for £990k.
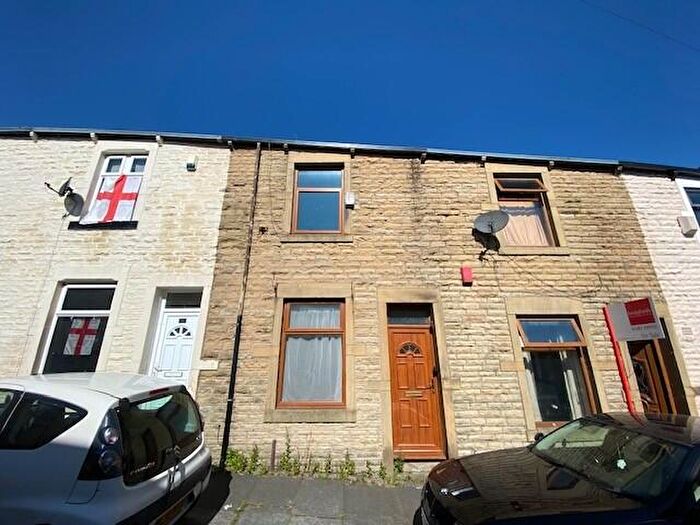
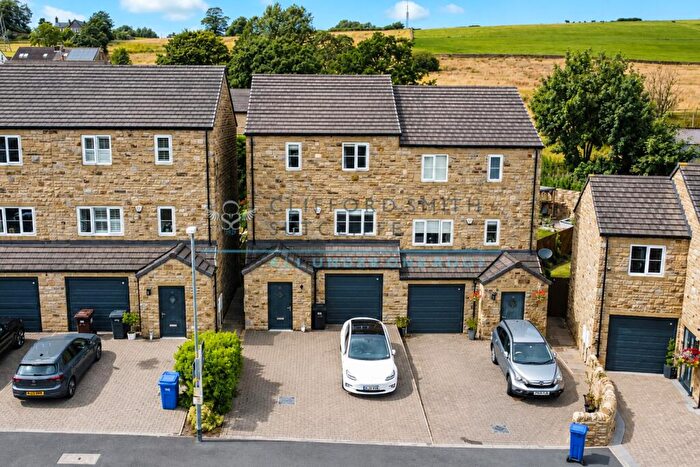
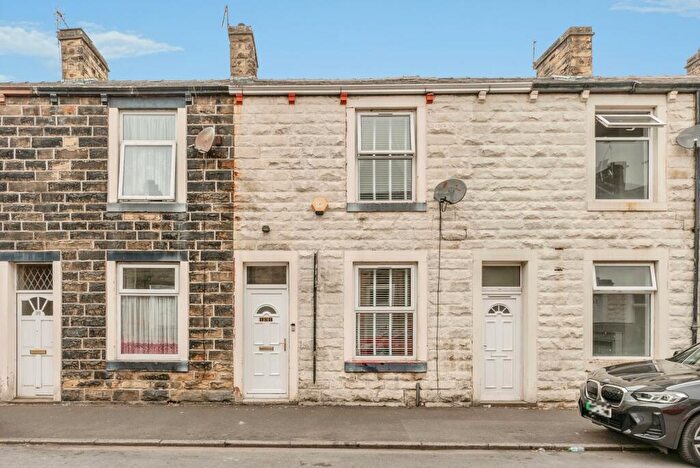
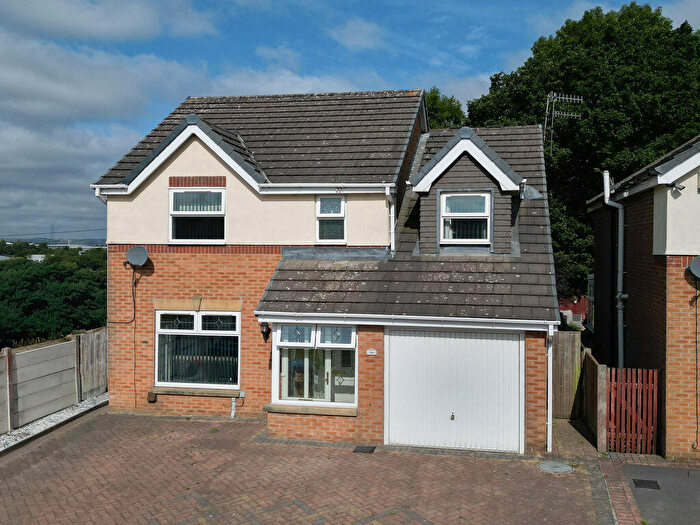
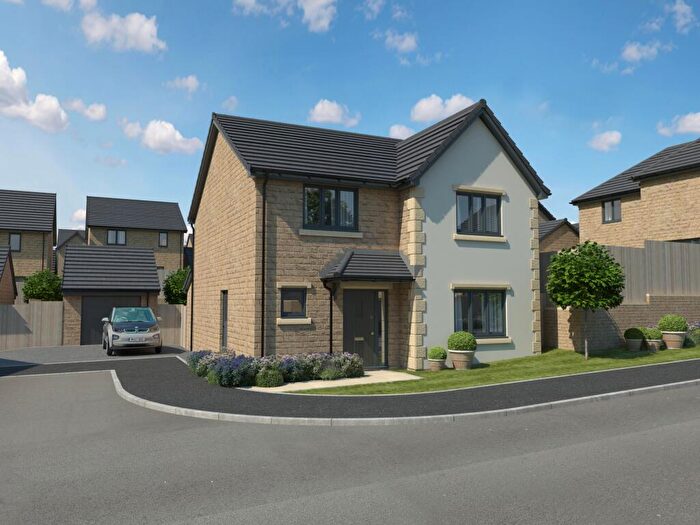
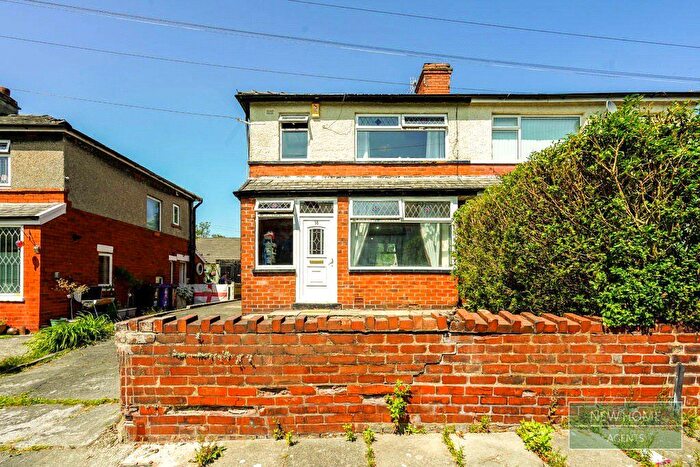
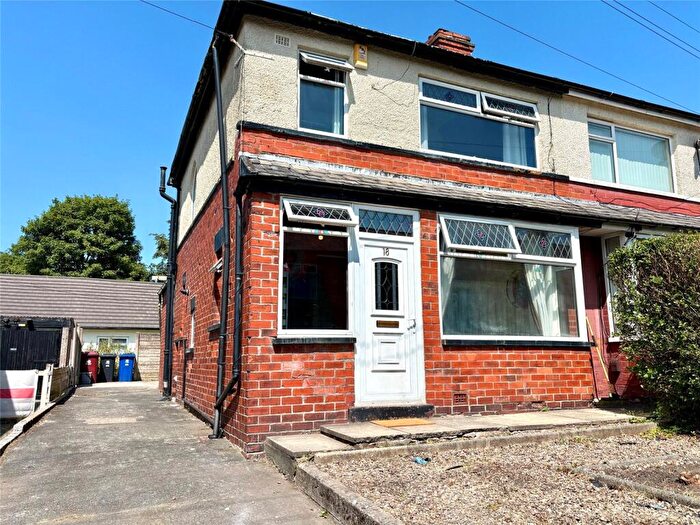
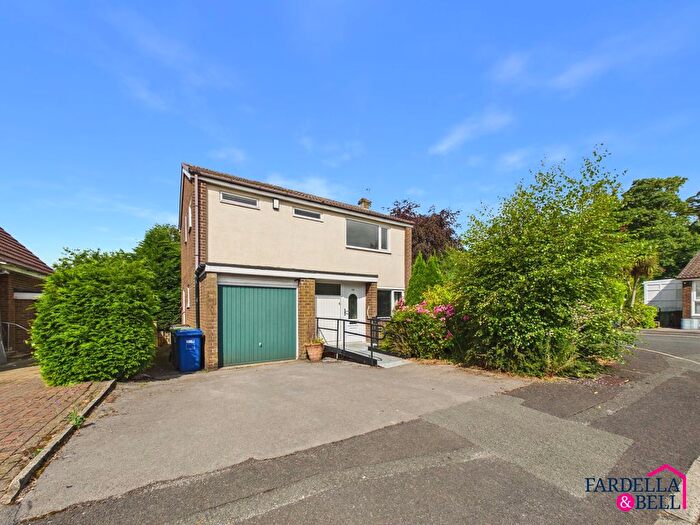
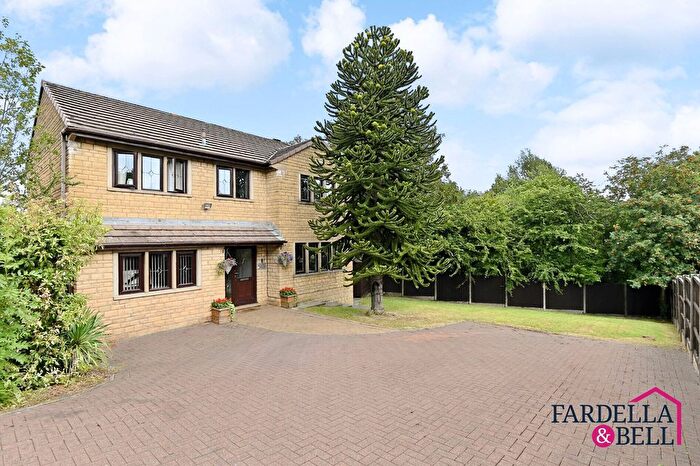
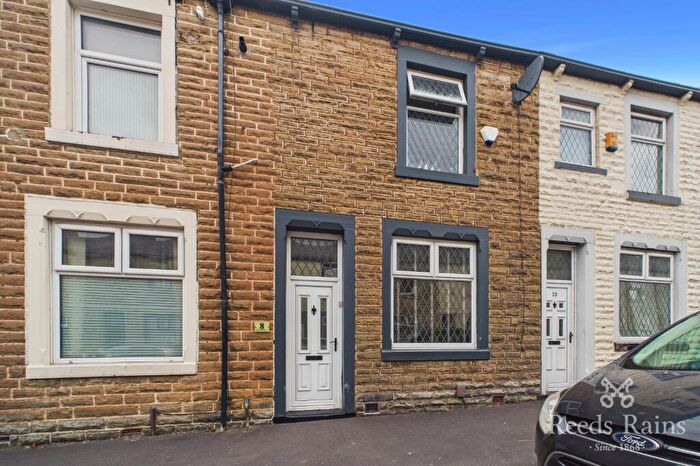
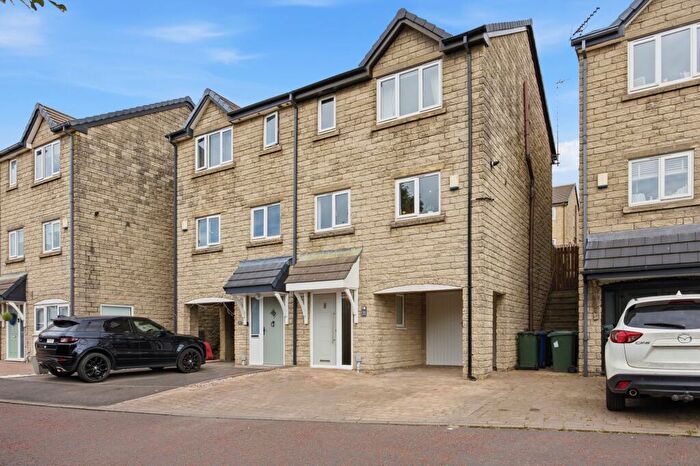
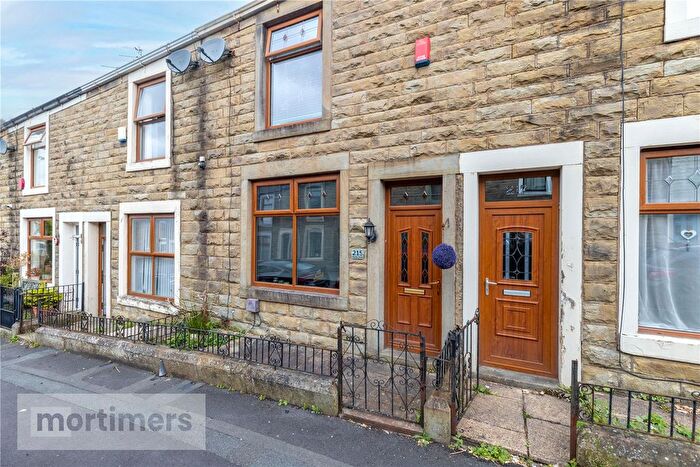
Properties for sale in Burnley
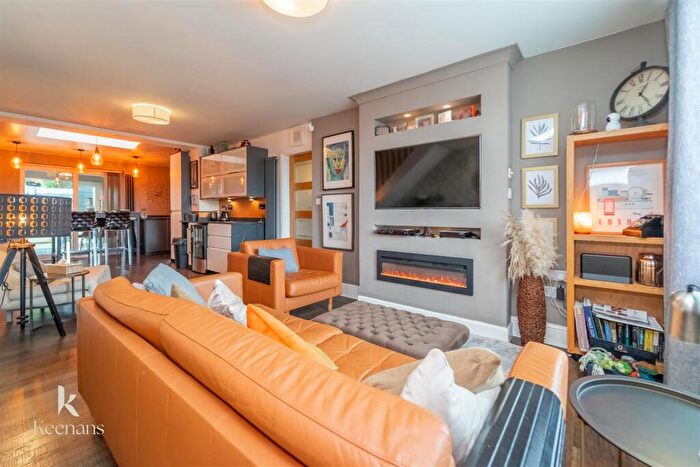
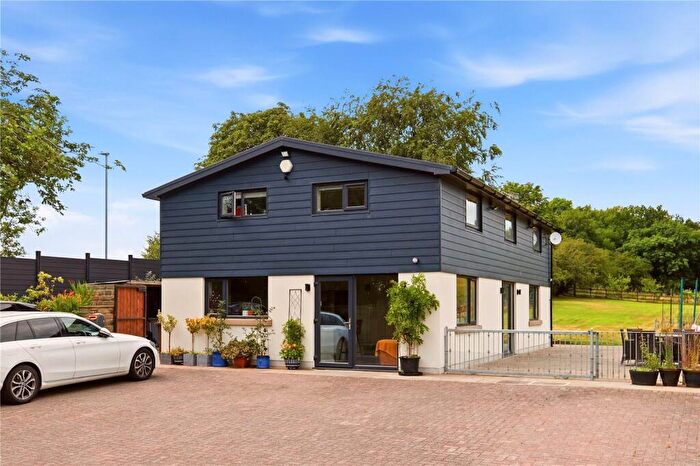
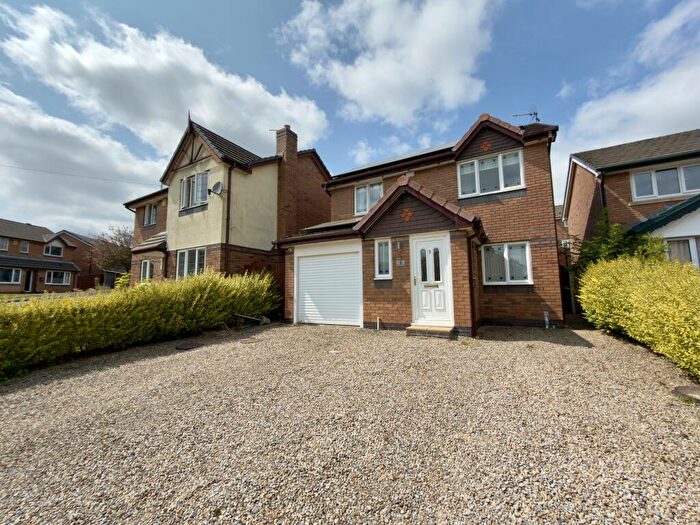
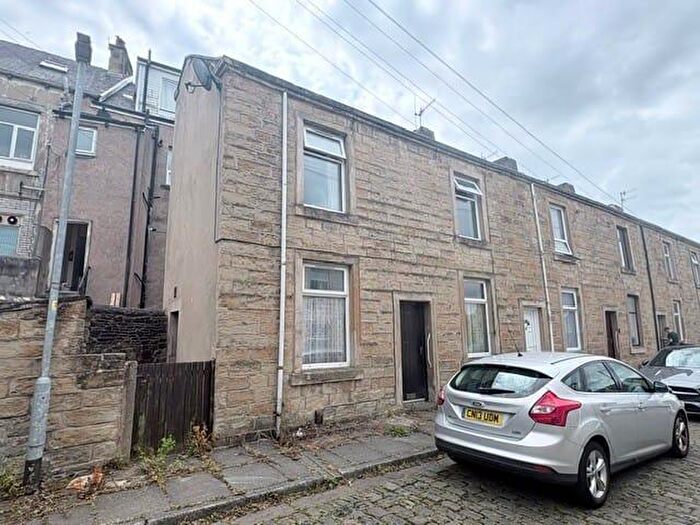
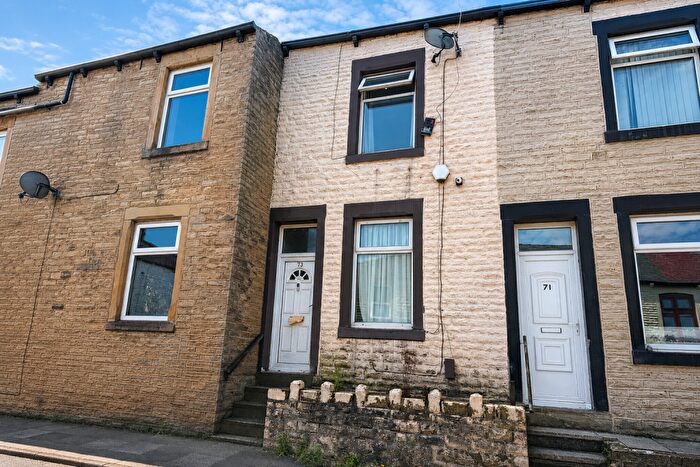
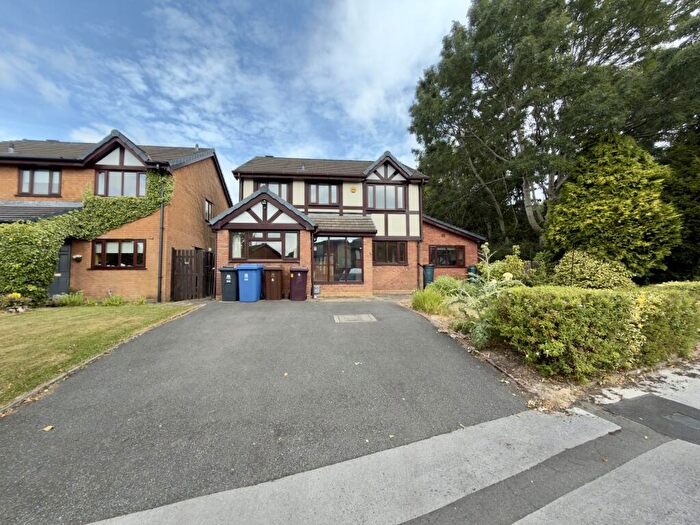
![]()
If you are looking to sell your house, let it out, or receive a property valuation, an expert can help you.
Click the button below to get started.


Neighbourhoods in Burnley
Navigate through our locations to find the location of your next house in Burnley, Lancashire for sale or to rent.
- Bank Hall
- Briercliffe
- Brunshaw
- Cliviger With Worsthorne
- Coal Clough With Deerplay
- Daneshouse With Stoneyholme
- Gannow
- Gawthorpe
- Hapton With Park
- Higham And Pendleside
- Lanehead
- Marsden
- Old Laund Booth
- Queensgate
- Read And Simonstone
- Reedley
- Rosegrove With Lowerhouse
- Rosehill With Burnley Wood
- Sabden
- Southfield
- Trinity
- Whittlefield With Ightenhill
- Brierfield East & Clover Hill
- Brierfield West & Reedley
- Marsden & Southfield
- East Whalley, Read & Simonstone
- Fence & Higham
- Barrowford & Pendleside
Property price trends in Burnley
According to the latest Land Registry data, the average home in Burnley sold for £139,020 in 2026. That figure comes from a substantial record of 62,649 sales logged over the past 31 years.
Prices have continued to climb over the last three years. Compared with 2023, when the typical sale came in around £128,052, that's a rise of roughly 8.6%.
Looking back five years, average prices are up about 6.8% since 2021, a gain of around £8,875 in cash terms.
Zoom out to the past decade for the fuller picture. Back in 2016, homes here averaged £103,117, so the typical sold price has climbed about 34.8% since then, roughly 3% a year. Stretch the view to fifteen years and that annual pace eases back to about 2.2%.
Frequently asked questions about Burnley
What is the average price for a property for sale in Burnley?
The average price for a property for sale in Burnley is £135,605. This amount is 35% lower than the average price in Lancashire. There are more than 10,000 property listings for sale in Burnley.
What locations have the most expensive properties for sale in Burnley?
The locations with the most expensive properties for sale in Burnley are Barrowford & Pendleside at an average of £478,316, East Whalley, Read & Simonstone at an average of £466,666 and Marsden at an average of £343,000.
What locations have the most affordable properties for sale in Burnley?
The locations with the most affordable properties for sale in Burnley are Bank Hall at an average of £78,476, Trinity at an average of £79,917 and Daneshouse With Stoneyholme at an average of £97,504.
Which train stations are available in or near Burnley?
Some of the train stations available in or near Burnley are Burnley Barracks, Burnley Central and Burnley Manchester Road.
Property Price Paid in Burnley by Year
The average sold property price by year was:
| Year | Average Sold Price | Price Change |
Sold Properties
|
|---|---|---|---|
| 2026 | £139,020 | -3% |
105 Properties |
| 2025 | £142,704 | 4% |
1,637 Properties |
| 2024 | £136,454 | 6% |
1,790 Properties |
| 2023 | £128,052 | -4% |
1,787 Properties |
| 2022 | £133,070 | 2% |
2,162 Properties |
| 2021 | £130,145 | 12% |
2,395 Properties |
| 2020 | £115,039 | 5% |
1,666 Properties |
| 2019 | £108,966 | 4% |
1,928 Properties |
| 2018 | £104,611 | 1% |
2,035 Properties |
| 2017 | £103,645 | 1% |
2,184 Properties |
Property Price per Property Type in Burnley
Here you can find historic sold price data in order to help with your property search.
The average Property Paid Price for specific property types in the last three years are:
| Property Type | Average Sold Price | Sold Properties |
|---|---|---|
| Semi Detached House | £180,052.00 | 1,105 Semi Detached Houses |
| Terraced House | £92,879.00 | 3,383 Terraced Houses |
| Detached House | £302,343.00 | 624 Detached Houses |
| Flat | £93,986.00 | 207 Flats |
Transport in Burnley
Please see below transportation links in this area:
