
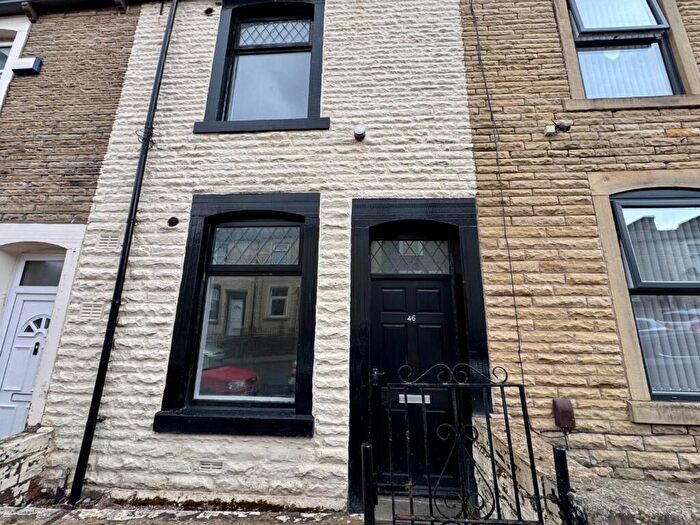
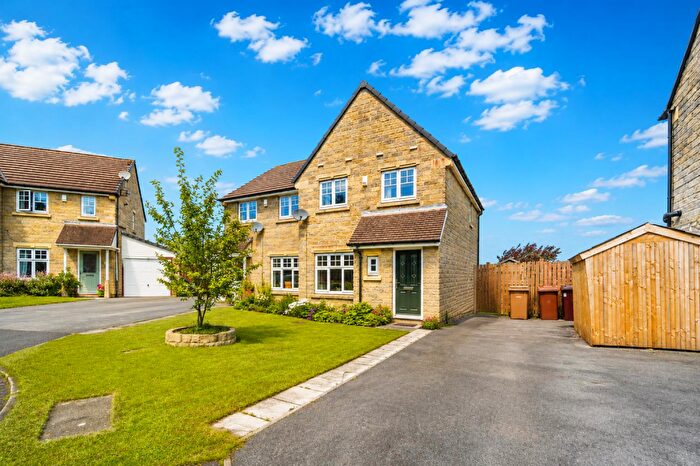
Houses for sale in BB11 2JS, Rosehill Road, Trinity, Burnley
House Prices in BB11 2JS, Rosehill Road, Trinity
Properties in BB11 2JS have no sales history available within the last 3 years. BB11 2JS is a postcode in Rosehill Road located in Trinity, an area in Burnley, Lancashire, with 9 households².
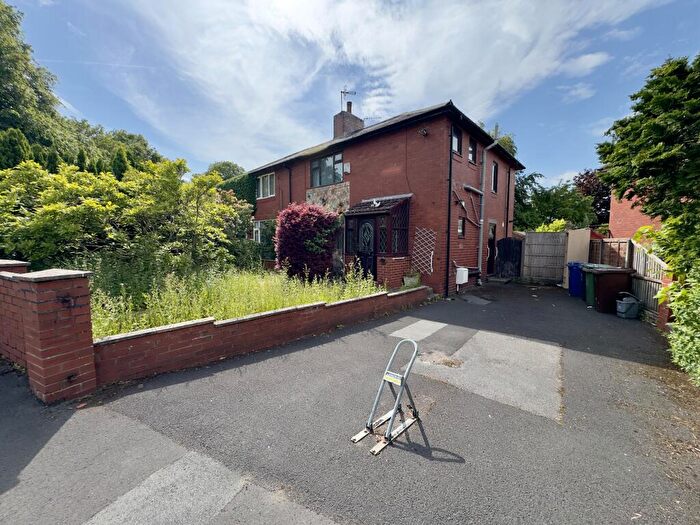
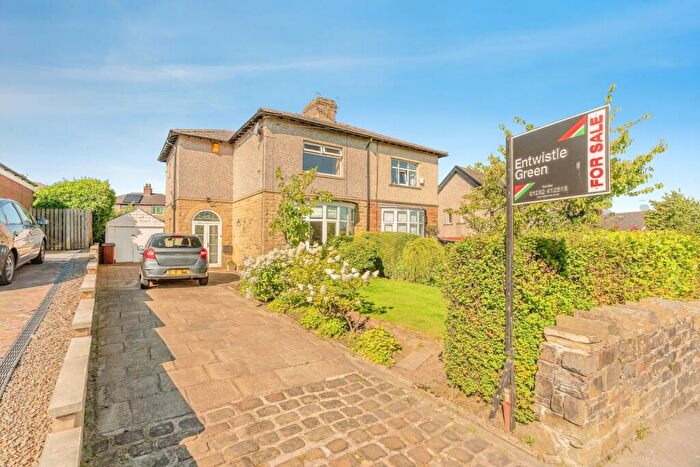
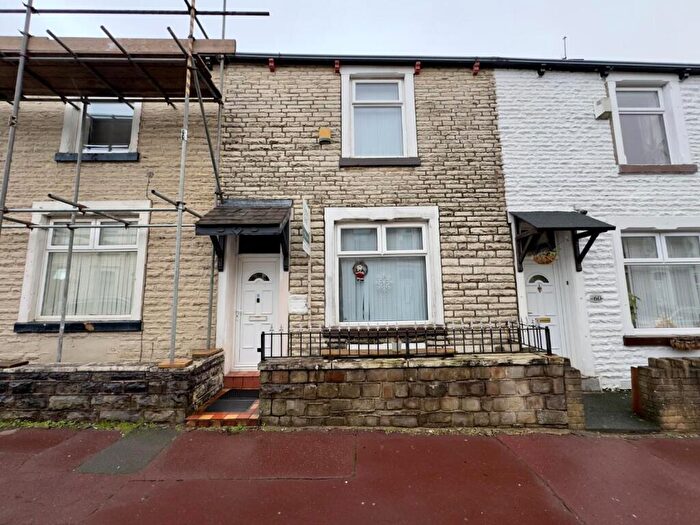
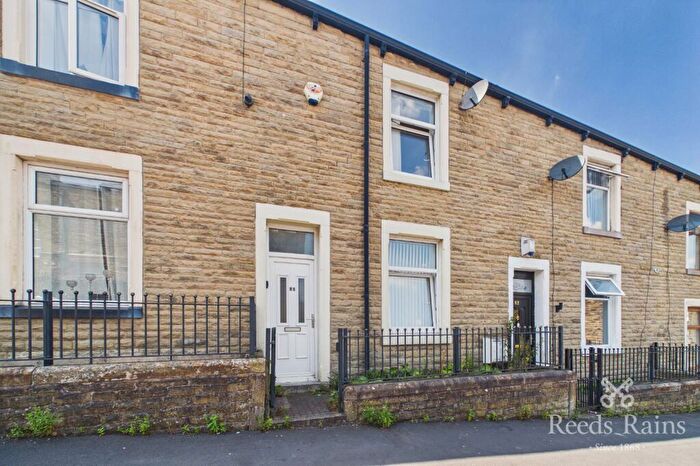
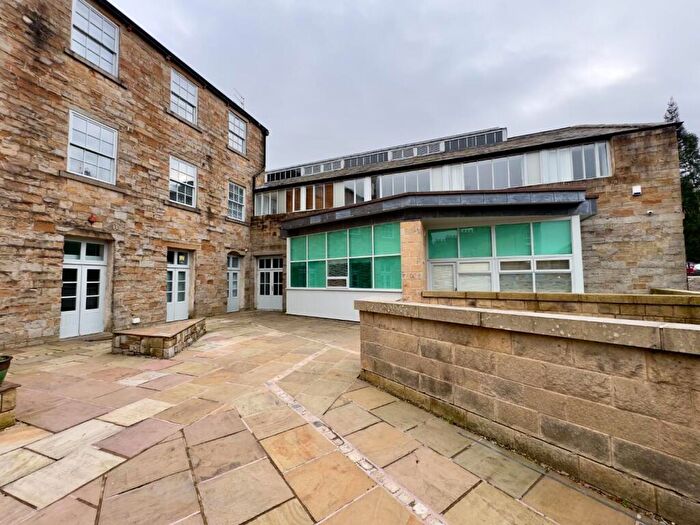
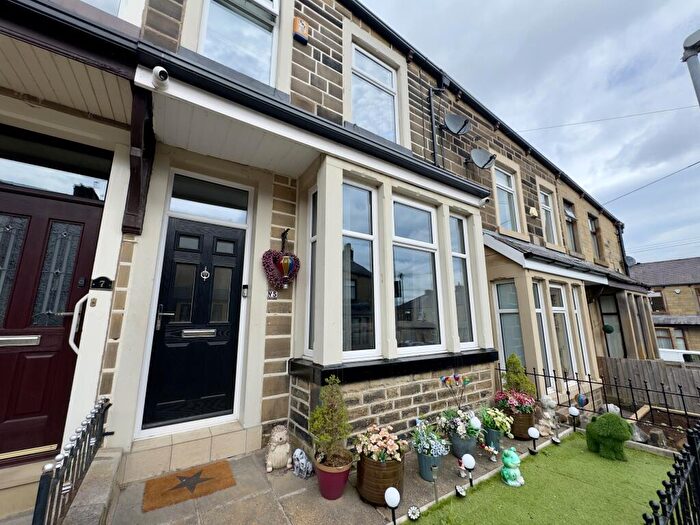
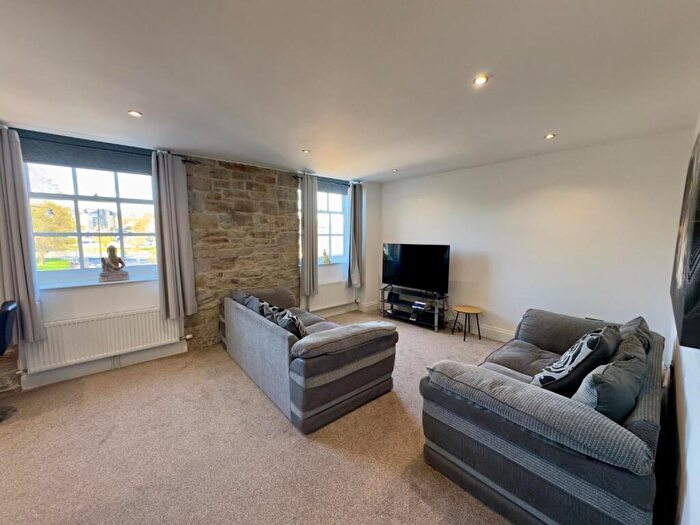
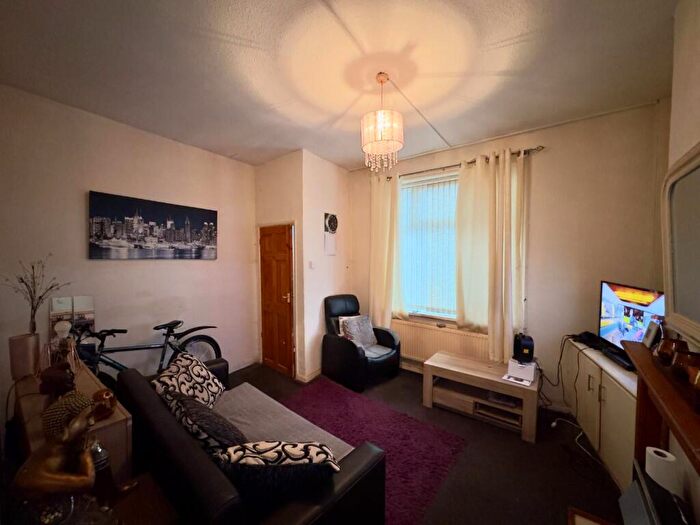
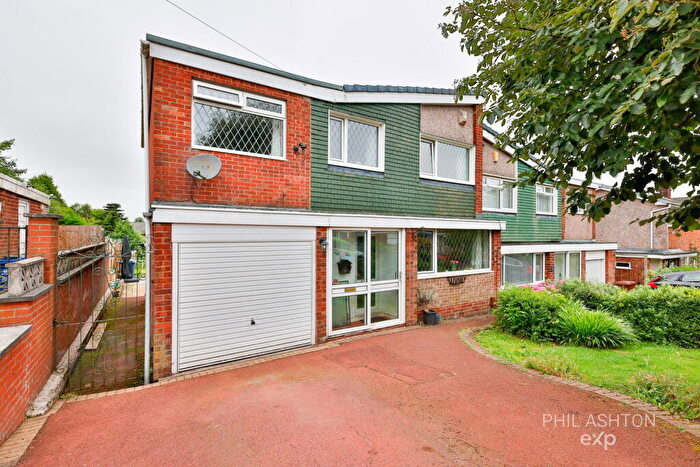
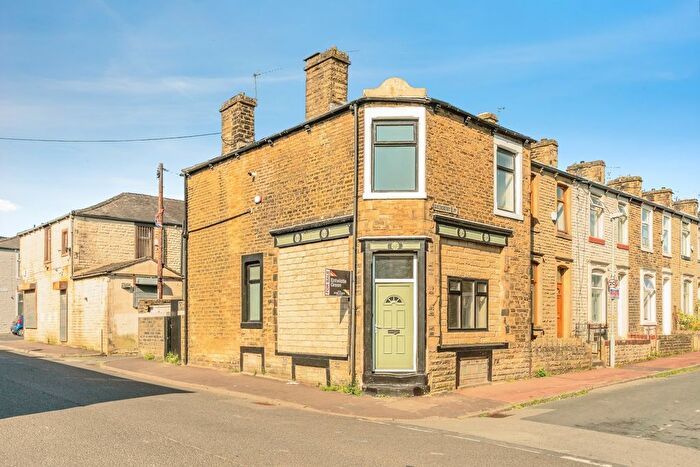
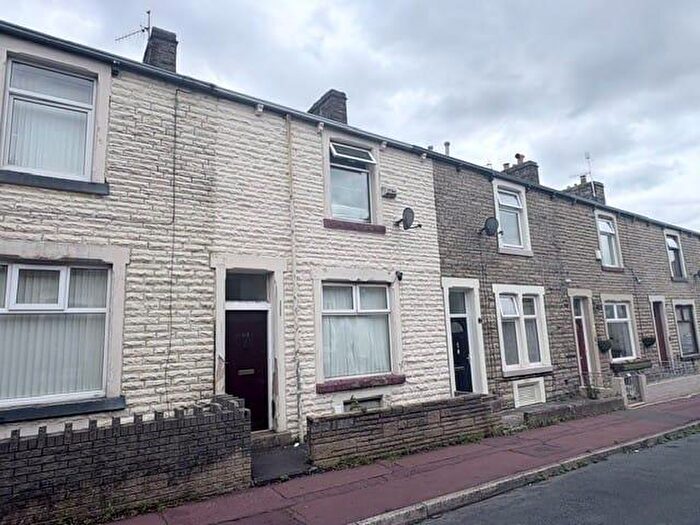
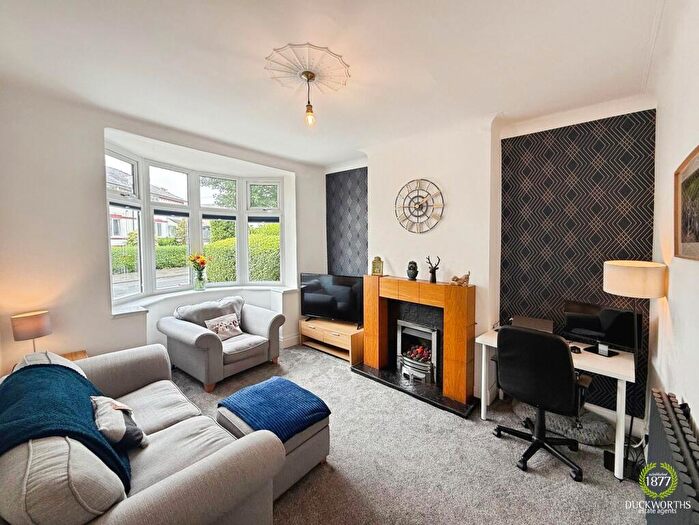
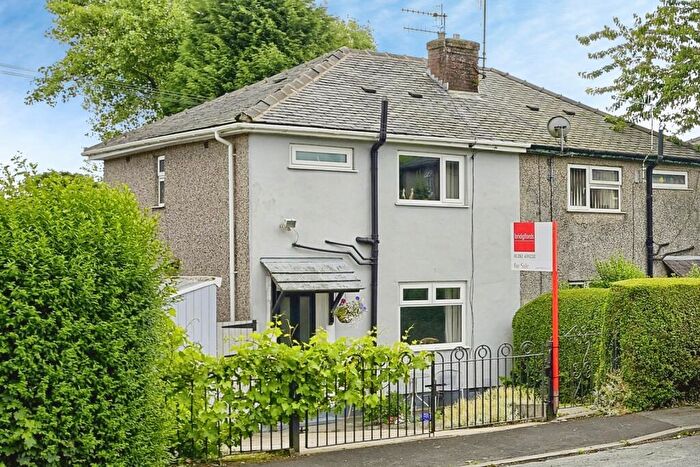
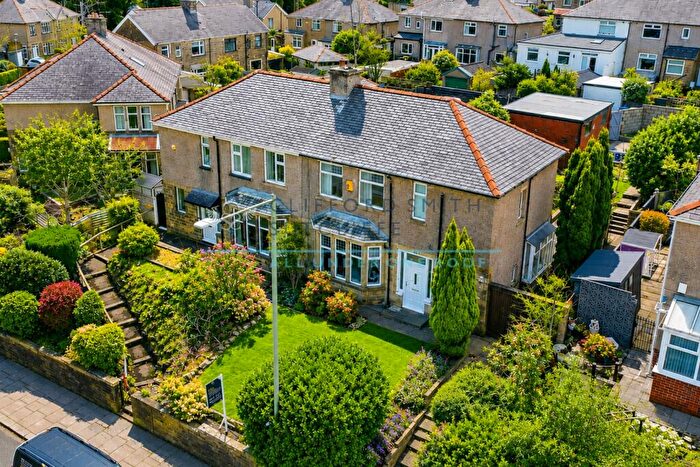
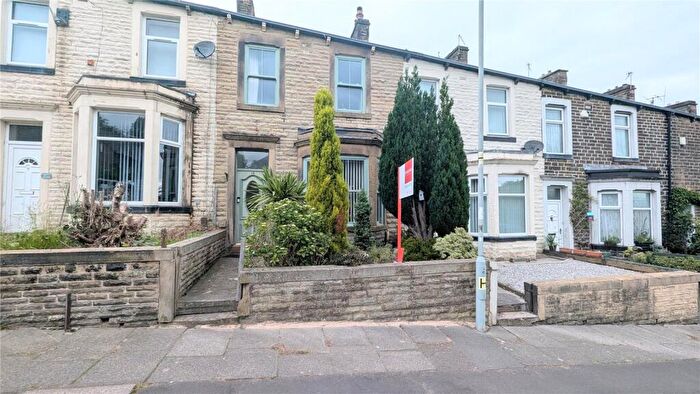
Properties for sale near BB11 2JS, Rosehill Road
![]()
If you are looking to sell your house, let it out, or receive a property valuation, an expert can help you.
Click the button below to get started.
Price Paid in Rosehill Road, BB11 2JS, Trinity
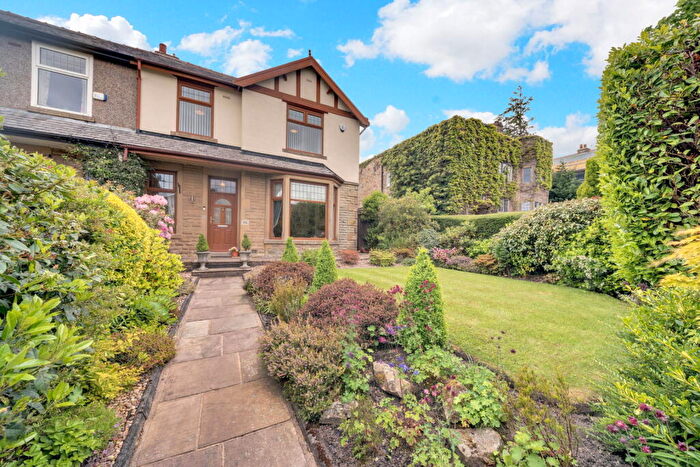
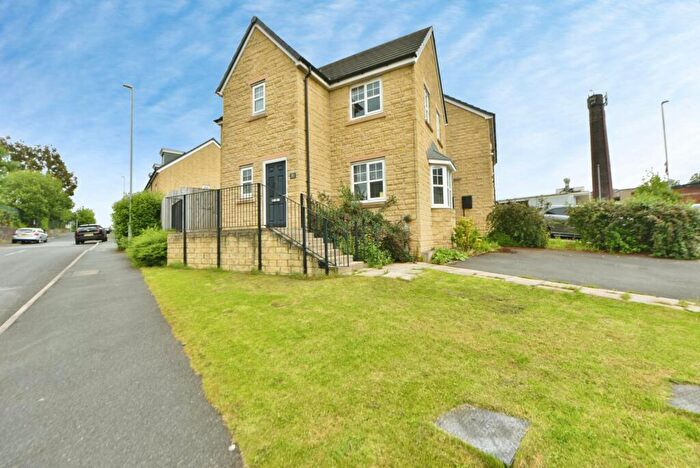
MOSELEY HOUSE Rosehill Road, BB11 2JS, Trinity Burnley
Property MOSELEY HOUSE has been sold 2 times. The last time it was sold was in 15/02/2021 and the sold price was £565,000.00.
This detached house, sold as a freehold on 15/02/2021, is a 416 sqm detached house with an EPC rating of F.
| Date | Price | Property Type | Tenure | Classification |
|---|---|---|---|---|
| 15/02/2021 | £565,000.00 | Detached House | freehold | Established Building |
| 04/12/1995 | £130,000.00 | Detached House | freehold | Established Building |
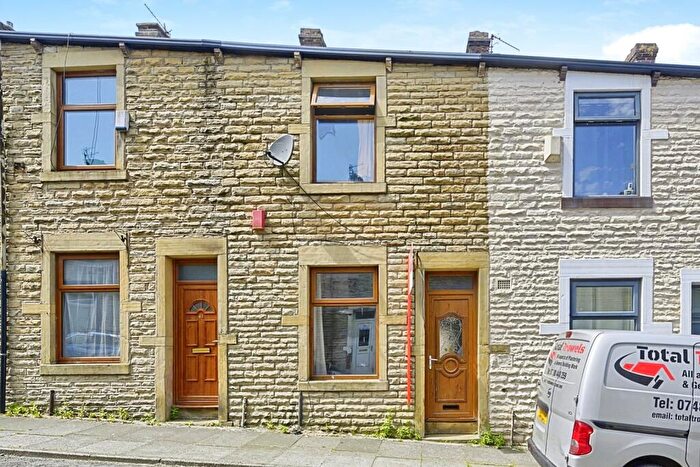
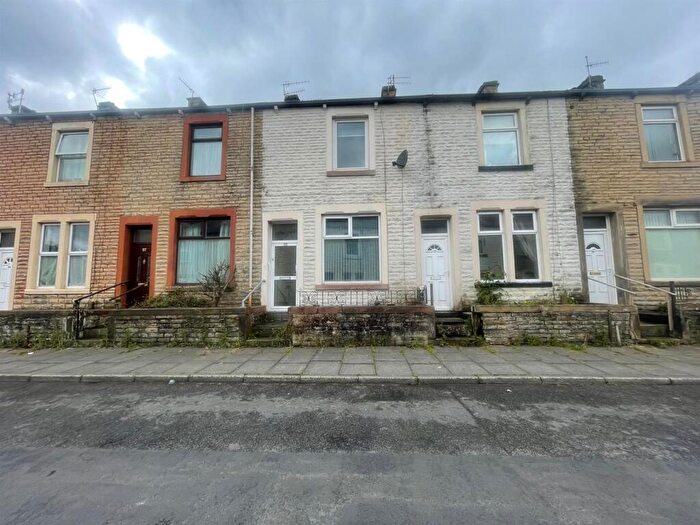
28 Rosehill Road, BB11 2JS, Trinity Burnley
Property 28 has been sold 3 times. The last time it was sold was in 07/08/2020 and the sold price was £225,500.00.
This terraced house, sold as a leasehold on 07/08/2020, is a 206 sqm mid-terrace house with an EPC rating of F.
| Date | Price | Property Type | Tenure | Classification |
|---|---|---|---|---|
| 07/08/2020 | £225,500.00 | Terraced House | leasehold | Established Building |
| 16/11/2018 | £125,000.00 | Terraced House | leasehold | Established Building |
| 11/10/1996 | £70,000.00 | Semi Detached House | leasehold | Established Building |
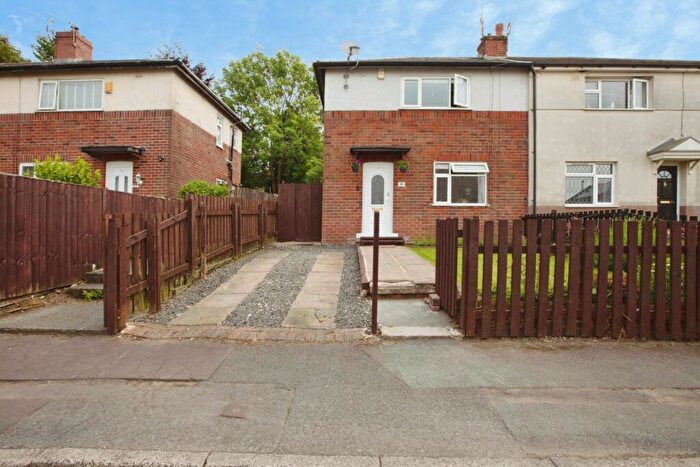
29 - 31 Rosehill Road, BB11 2JS, Trinity Burnley
Property 29 - 31 has been sold 2 times. The last time it was sold was in 06/12/2019 and the sold price was £190,000.00.
This other property, sold as a freehold on 06/12/2019, is a 118 sqm detached house with an EPC rating of E.
| Date | Price | Property Type | Tenure | Classification |
|---|---|---|---|---|
| 06/12/2019 | £190,000.00 | Other Property | freehold | Established Building |
| 26/07/2002 | £96,000.00 | Detached House | freehold | Established Building |
32 Rosehill Road, BB11 2JS, Trinity Burnley
Property 32 has been sold 1 time. The last time it was sold was in 16/06/2015 and the sold price was £170,000.00.
This semi detached house, sold as a leasehold on 16/06/2015, is a 250 sqm mid-terrace house with an EPC rating of F.
| Date | Price | Property Type | Tenure | Classification |
|---|---|---|---|---|
| 16/06/2015 | £170,000.00 | Semi Detached House | leasehold | Established Building |
30 Rosehill Road, BB11 2JS, Trinity Burnley
Property 30 has been sold 2 times. The last time it was sold was in 13/02/2004 and the sold price was £148,000.00.
This is a Terraced House which was sold as a leasehold in 13/02/2004
| Date | Price | Property Type | Tenure | Classification |
|---|---|---|---|---|
| 13/02/2004 | £148,000.00 | Terraced House | leasehold | Established Building |
| 20/10/2000 | £95,000.00 | Terraced House | leasehold | Established Building |
26 Rosehill Road, BB11 2JS, Trinity Burnley
Property 26 has been sold 1 time. The last time it was sold was in 18/10/2001 and the sold price was £113,500.00.
This is a Terraced House which was sold as a leasehold in 18/10/2001
| Date | Price | Property Type | Tenure | Classification |
|---|---|---|---|---|
| 18/10/2001 | £113,500.00 | Terraced House | leasehold | Established Building |
Postcodes in Rosehill Road, Trinity
Navigate through other locations in Rosehill Road, Trinity, Burnley to see more property listings for sale or to rent.
Property price trends in BB11 2JS, Rosehill Road
According to the latest Land Registry data, the average home in BB11 2JS, Rosehill Road sold for £565,000 in 2021. That figure comes from 10 sales logged over the past 26 years.
Prices have continued to climb over the last three years. Compared with 2018, when the typical sale came in around £125,000, that's a rise of roughly 352%.
Looking back five years, average prices are up about 232.4% since 2015, a gain of around £395,000 in cash terms.
Property Price Paid in BB11 2JS, Rosehill Road by Year
The average sold property price by year was:
| Year | Average Sold Price | Price Change |
Sold Properties
|
|---|---|---|---|
| 2021 | £565,000 | 60% |
1 Property |
| 2020 | £225,500 | 45% |
1 Property |
| 2018 | £125,000 | -36% |
1 Property |
| 2015 | £170,000 | 13% |
1 Property |
| 2004 | £148,000 | 35% |
1 Property |
| 2002 | £96,000 | -18% |
1 Property |
| 2001 | £113,500 | 16% |
1 Property |
| 2000 | £95,000 | 26% |
1 Property |
| 1996 | £70,000 | -86% |
1 Property |
| 1995 | £130,000 | - |
1 Property |
