
Houses for sale in BB11 4LA, Queensberry Road, Trinity, Burnley
House Prices in BB11 4LA, Queensberry Road, Trinity
Properties in BB11 4LA have no sales history available within the last 3 years. BB11 4LA is a postcode in Queensberry Road located in Trinity, an area in Burnley, Lancashire, with 1 household².
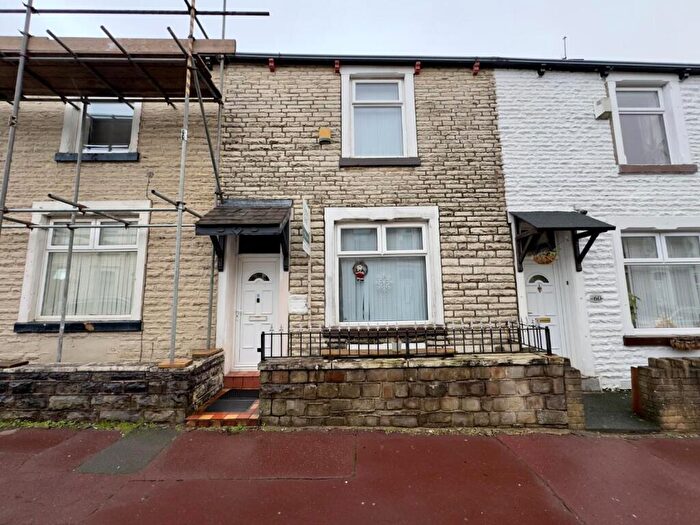
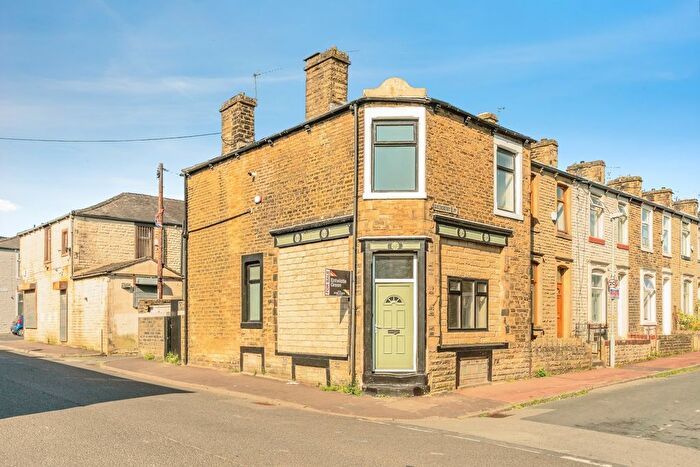
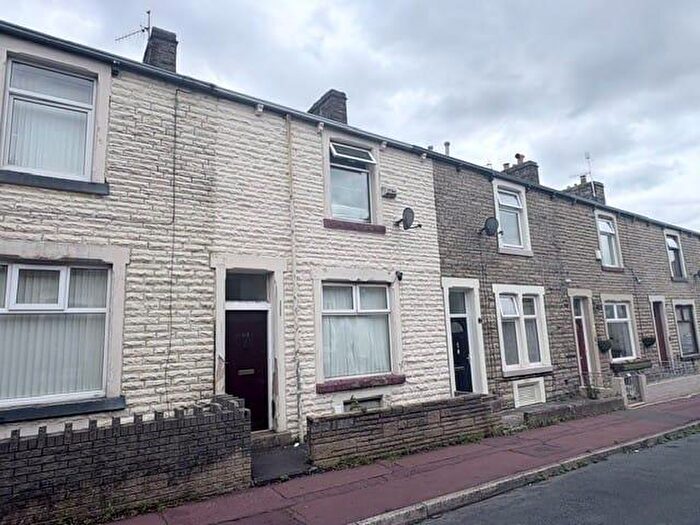
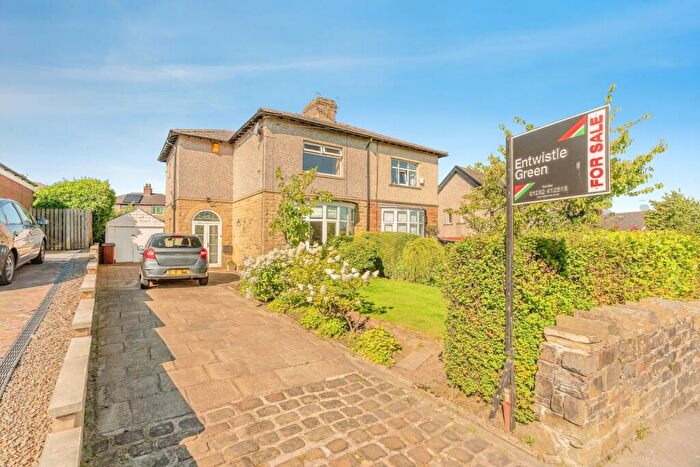
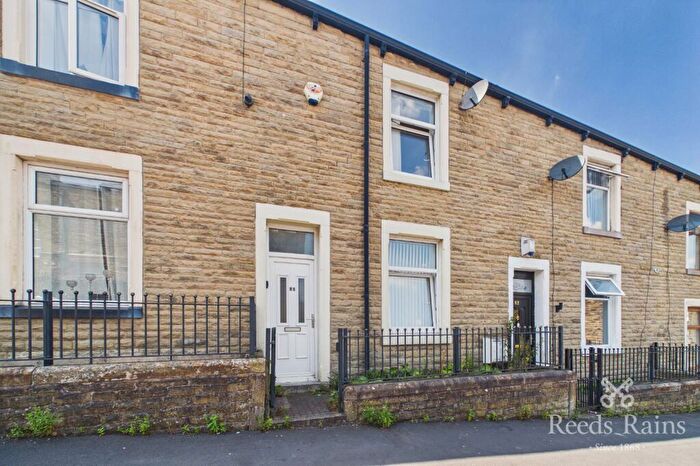
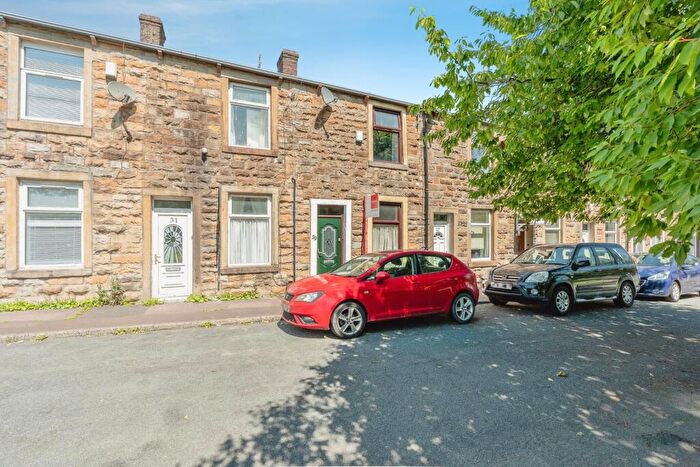
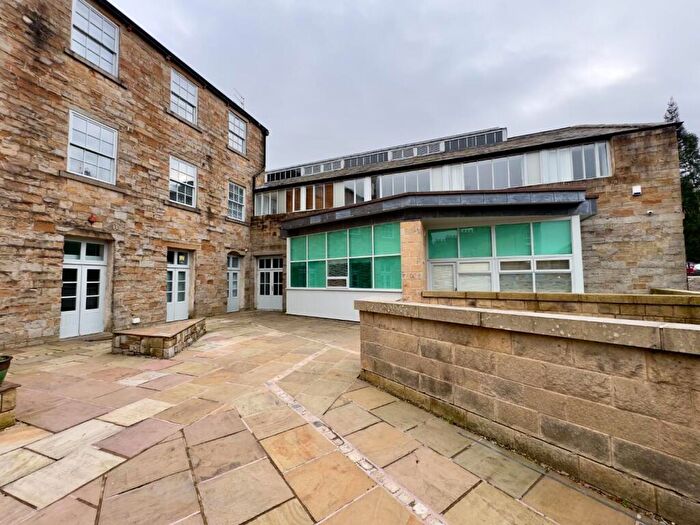
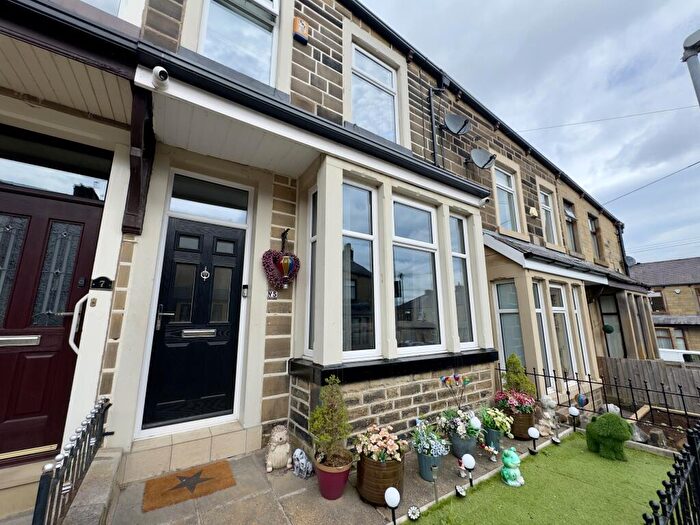
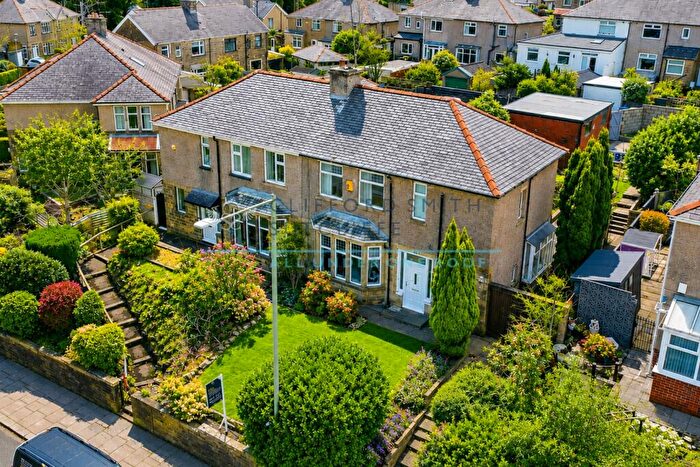
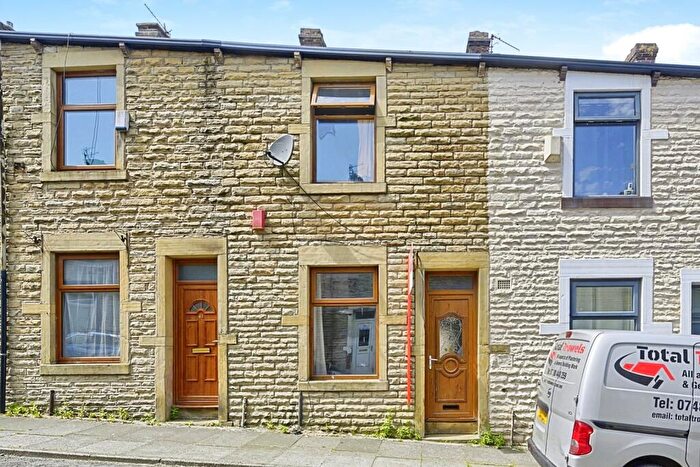
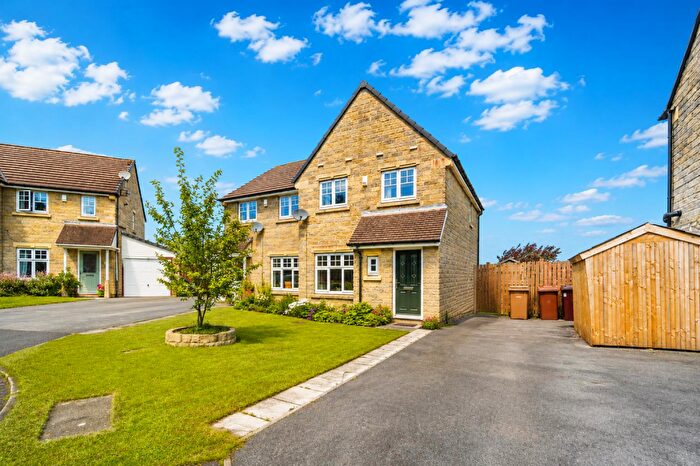
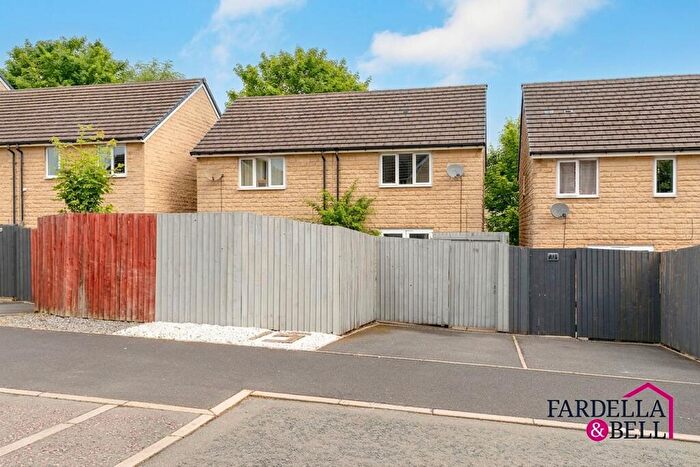
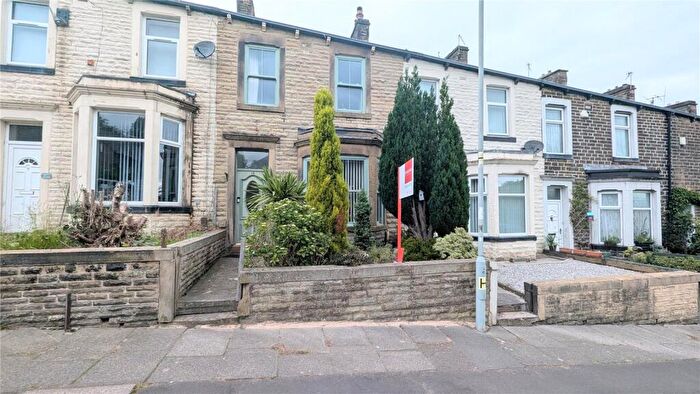
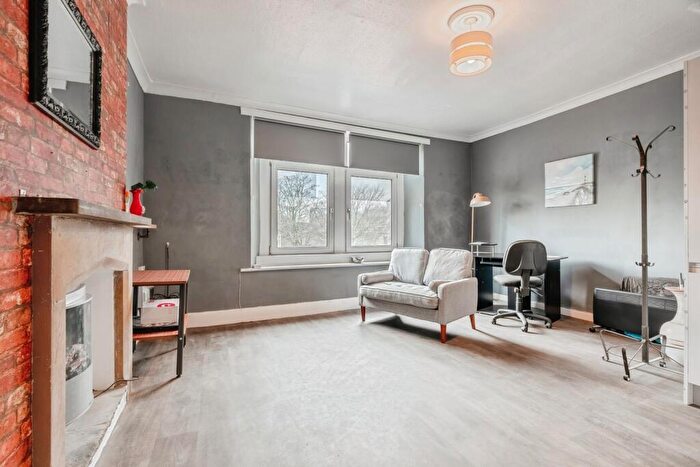
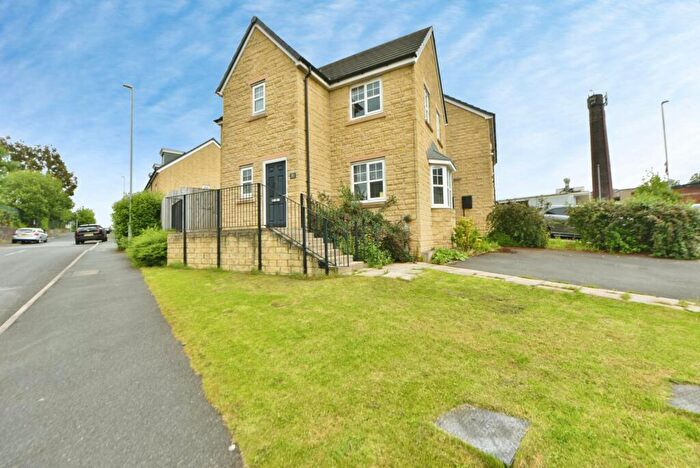
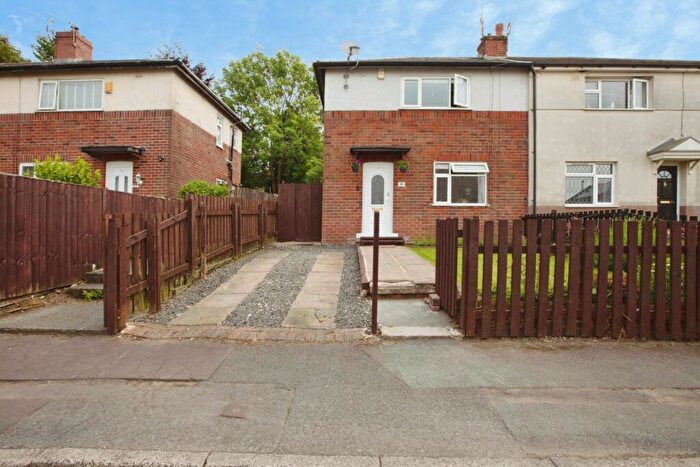
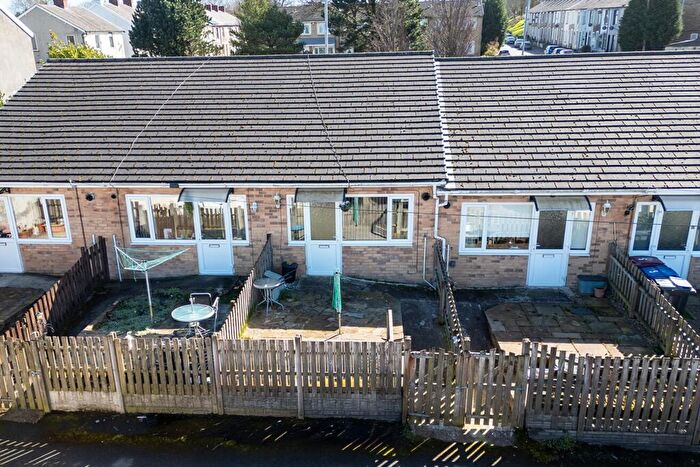
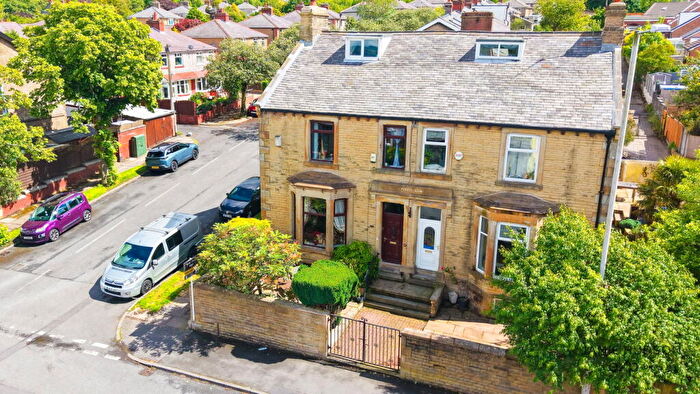
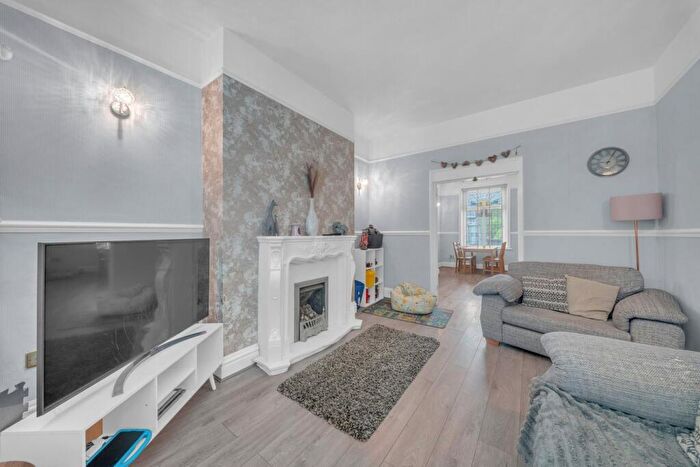
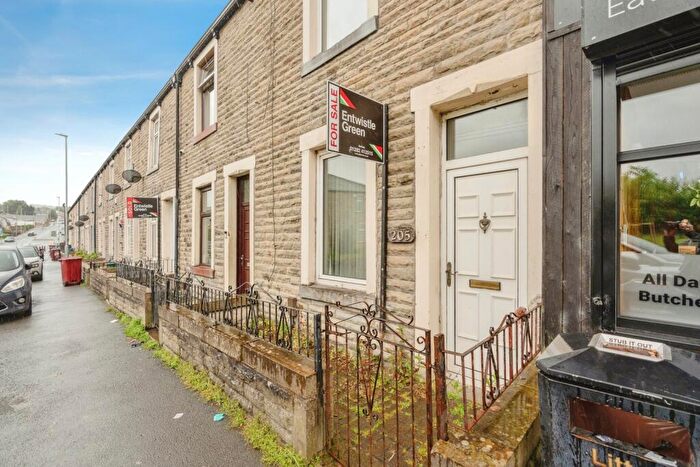
Properties for sale near BB11 4LA, Queensberry Road
![]()
If you are looking to sell your house, let it out, or receive a property valuation, an expert can help you.
Click the button below to get started.
Price Paid in Queensberry Road, BB11 4LA, Trinity
63 Queensberry Road, BB11 4LA, Trinity Burnley
Property 63 has been sold 3 times. The last time it was sold was in 22/07/2022 and the sold price was £33,500.00.
This terraced house, sold as a leasehold on 22/07/2022, is a 38 sqm mid-floor flat with an EPC rating of C.
| Date | Price | Property Type | Tenure | Classification |
|---|---|---|---|---|
| 22/07/2022 | £33,500.00 | Terraced House | leasehold | Established Building |
| 21/07/2006 | £54,000.00 | Terraced House | leasehold | Established Building |
| 01/06/2001 | £4,400.00 | Terraced House | leasehold | Established Building |
72 Queensberry Road, BB11 4LA, Trinity Burnley
Property 72 has been sold 7 times. The last time it was sold was in 05/08/2019 and the sold price was £64,000.00.
This terraced house, sold as a leasehold on 05/08/2019, is a 78 sqm end-terrace house with an EPC rating of E.
| Date | Price | Property Type | Tenure | Classification |
|---|---|---|---|---|
| 05/08/2019 | £64,000.00 | Terraced House | leasehold | Established Building |
| 14/09/2018 | £50,000.00 | Terraced House | leasehold | Established Building |
| 27/01/2017 | £20,000.00 | Terraced House | leasehold | Established Building |
| 28/11/2008 | £36,600.00 | Terraced House | leasehold | Established Building |
| 23/04/2004 | £20,000.00 | Terraced House | leasehold | Established Building |
| 05/12/2003 | £12,000.00 | Terraced House | leasehold | Established Building |
| 28/07/2002 | £12,000.00 | Terraced House | leasehold | Established Building |
59 Queensberry Road, BB11 4LA, Trinity Burnley
Property 59 has been sold 4 times. The last time it was sold was in 20/03/2018 and the sold price was £39,500.00.
This other property, sold as a leasehold on 20/03/2018, is a 95 sqm end-terrace house with an EPC rating of E.
| Date | Price | Property Type | Tenure | Classification |
|---|---|---|---|---|
| 20/03/2018 | £39,500.00 | Other Property | leasehold | Established Building |
| 30/05/2006 | £50,000.00 | Terraced House | leasehold | Established Building |
| 21/10/2005 | £36,500.00 | Terraced House | leasehold | Established Building |
| 05/06/1998 | £10,000.00 | Terraced House | leasehold | Established Building |
65 Queensberry Road, BB11 4LA, Trinity Burnley
Property 65 has been sold 3 times. The last time it was sold was in 23/08/2012 and the sold price was £14,000.00.
This is a Terraced House which was sold as a leasehold in 23/08/2012
| Date | Price | Property Type | Tenure | Classification |
|---|---|---|---|---|
| 23/08/2012 | £14,000.00 | Terraced House | leasehold | Established Building |
| 16/01/2012 | £17,000.00 | Terraced House | leasehold | Established Building |
| 08/06/1998 | £10,000.00 | Terraced House | leasehold | Established Building |
Postcodes in Queensberry Road, Trinity
Navigate through other locations in Queensberry Road, Trinity, Burnley to see more property listings for sale or to rent.
Property price trends in BB11 4LA, Queensberry Road
According to the latest Land Registry data, the average home in BB11 4LA, Queensberry Road sold for £33,500 in 2022. That figure comes from 16 sales logged over the past 24 years.
Prices have fallen back over the last three years. Compared with 2019, when the typical sale came in around £64,000, that's a fall of roughly 47.7%.
Looking back five years, average prices are up about 67.5% since 2017, a gain of around £13,500 in cash terms.
Zoom out to the past decade for the fuller picture. Back in 2012, homes here averaged £15,500, so the typical sold price has climbed about 116.1% since then, roughly 8% a year. Stretch the view to fifteen years and that annual pace eases back to about -2.7%.
Property Price Paid in BB11 4LA, Queensberry Road by Year
The average sold property price by year was:
| Year | Average Sold Price | Price Change |
Sold Properties
|
|---|---|---|---|
| 2022 | £33,500 | -91% |
1 Property |
| 2019 | £64,000 | 22% |
1 Property |
| 2018 | £50,000 | 60% |
1 Property |
| 2017 | £20,000 | 23% |
1 Property |
| 2012 | £15,500 | -136% |
2 Properties |
| 2008 | £36,600 | -42% |
1 Property |
| 2006 | £52,000 | 30% |
2 Properties |
| 2005 | £36,500 | 45% |
1 Property |
| 2004 | £20,000 | 40% |
1 Property |
| 2003 | £12,000 | - |
1 Property |
