
Houses for sale in BB11 5BE, Cambridge Street, Trinity, Burnley
House Prices in BB11 5BE, Cambridge Street, Trinity
Properties in BB11 5BE have no sales history available within the last 3 years. BB11 5BE is a postcode in Cambridge Street located in Trinity, an area in Burnley, Lancashire, with 1 household².
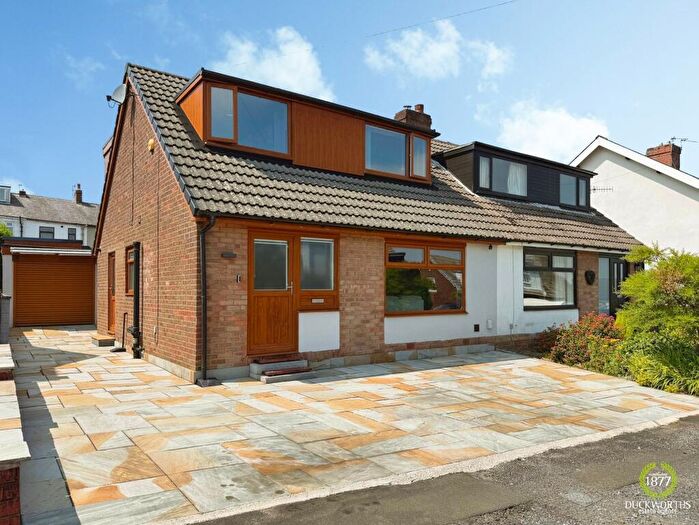
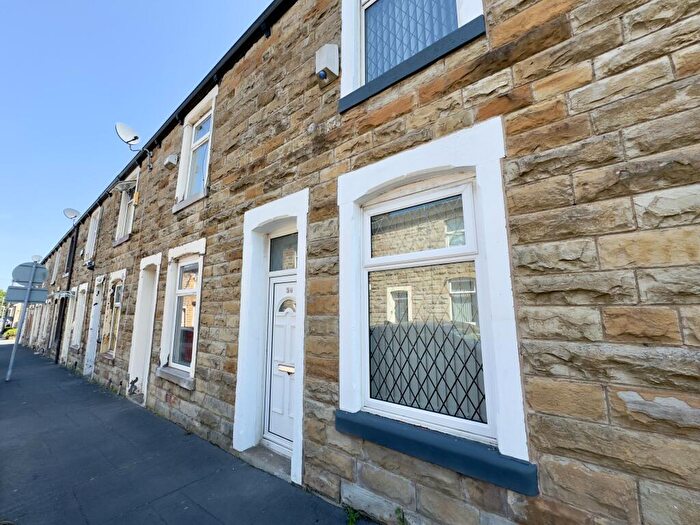
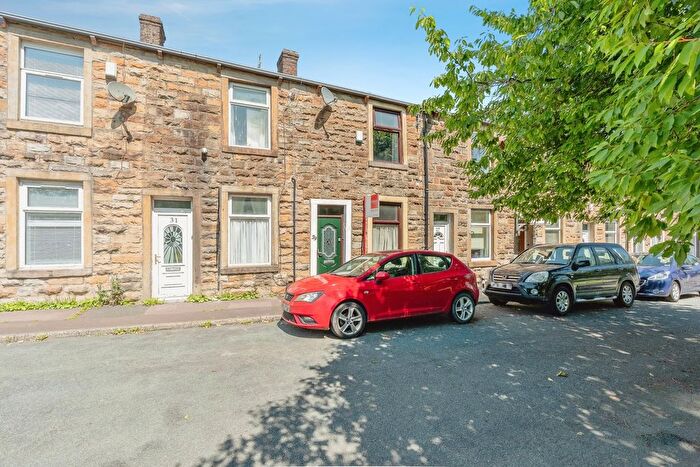
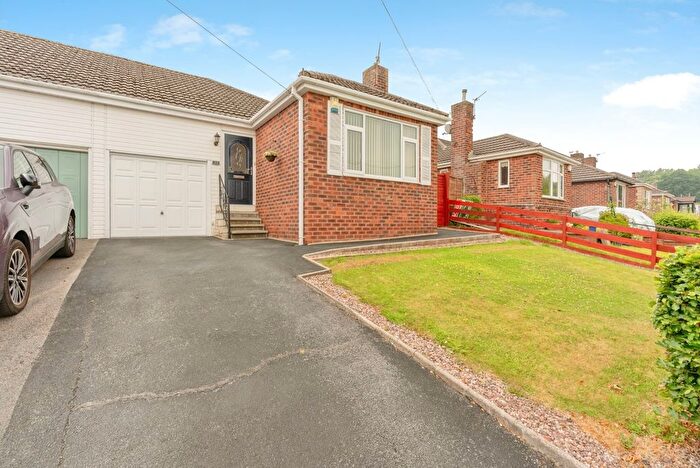
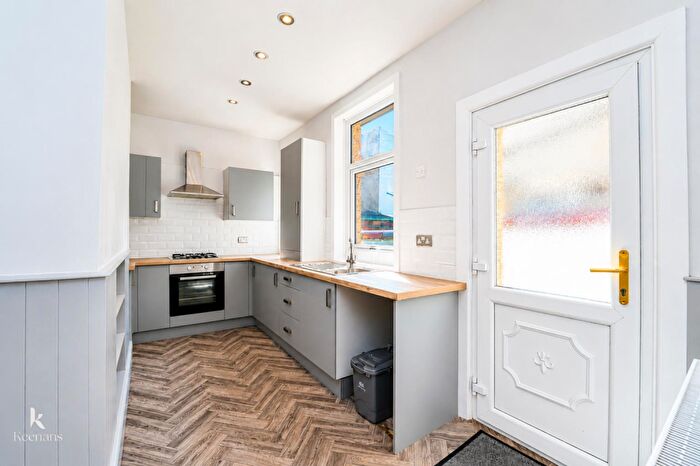
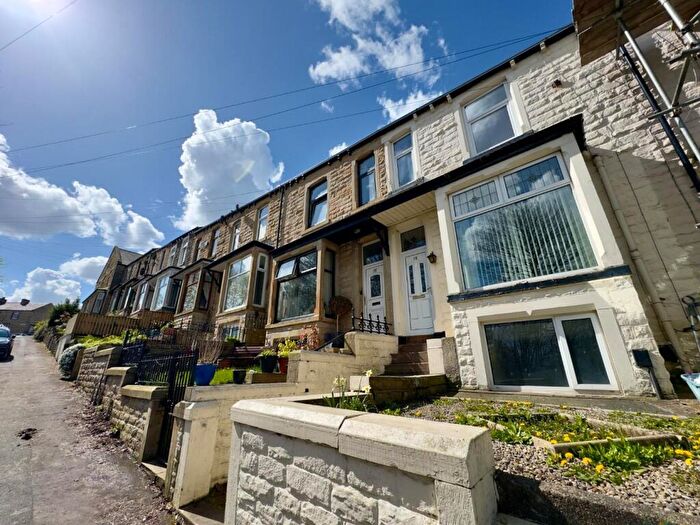
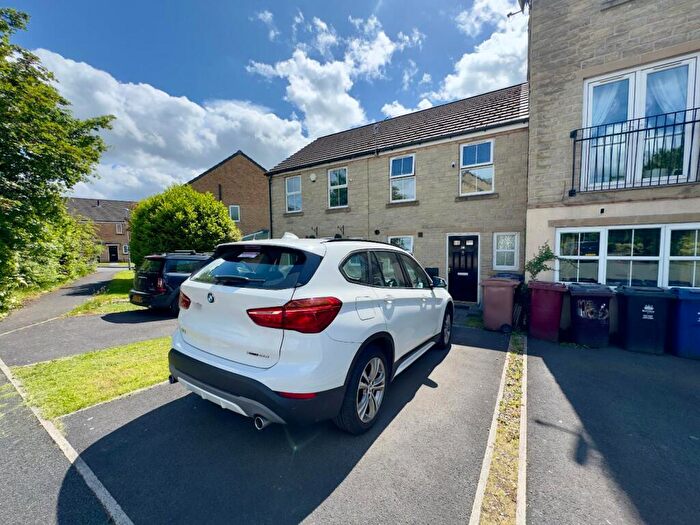
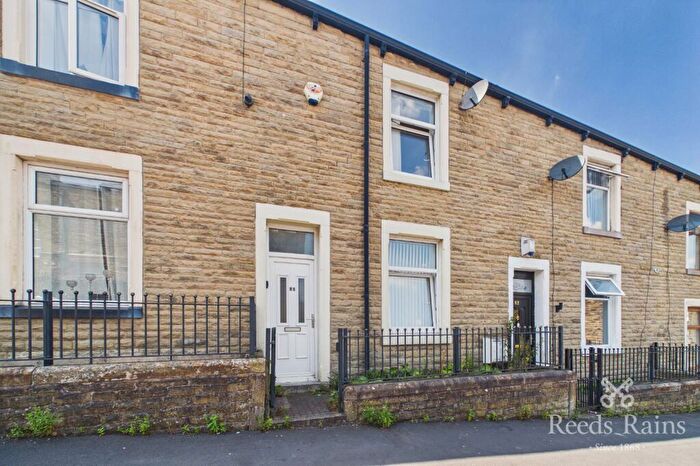
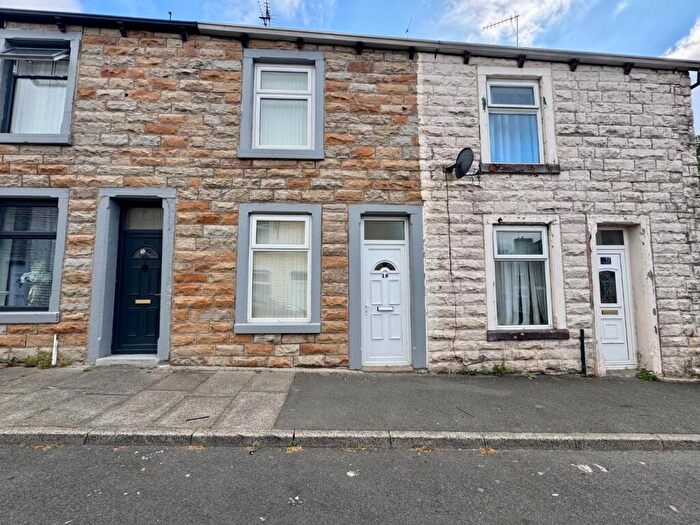
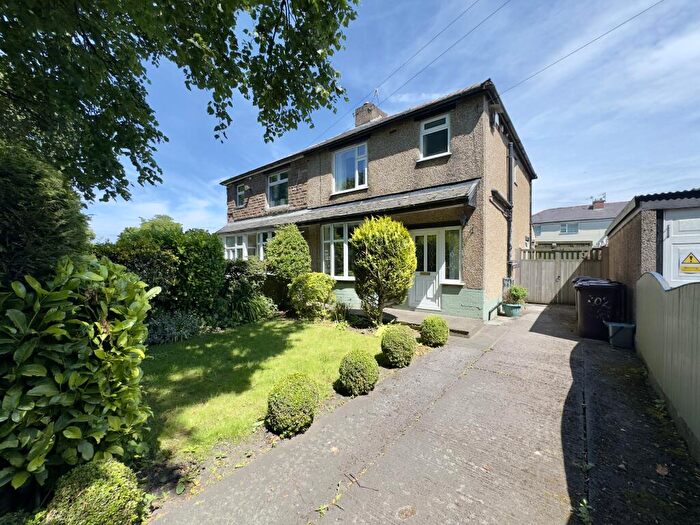
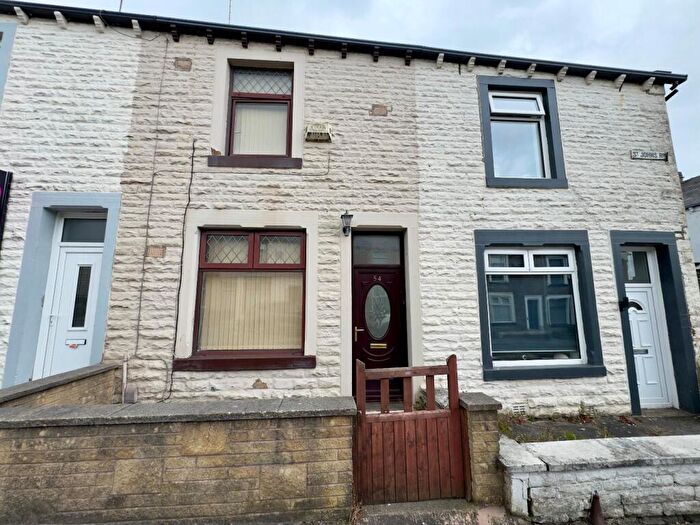
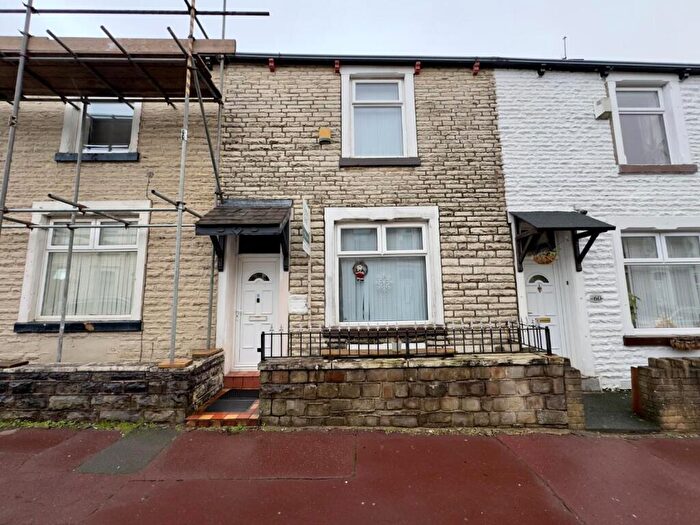
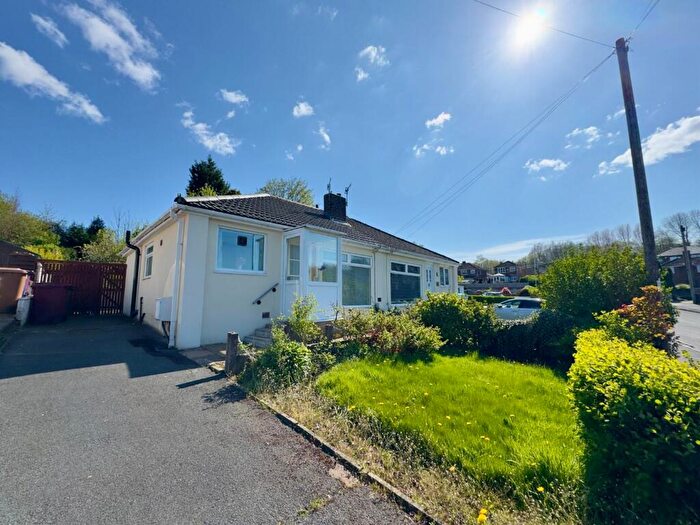
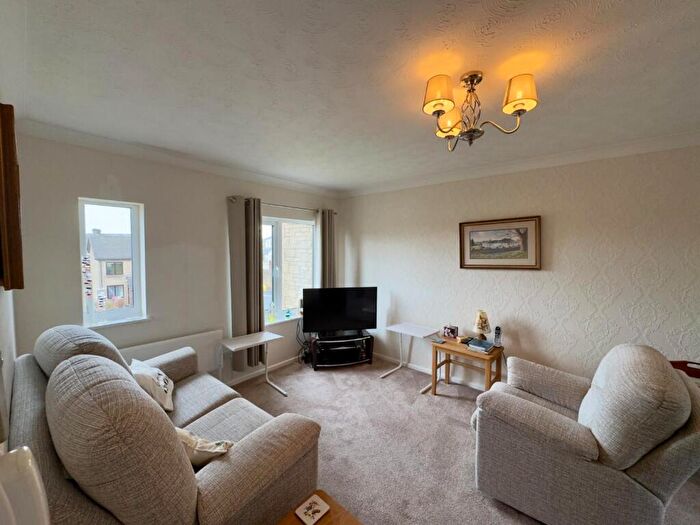
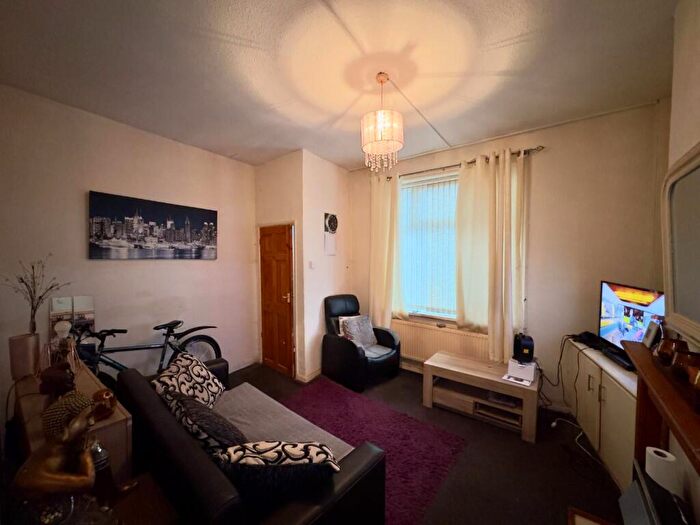
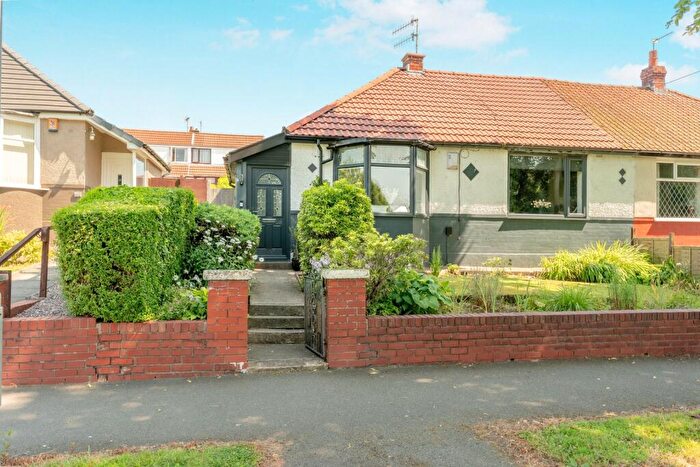
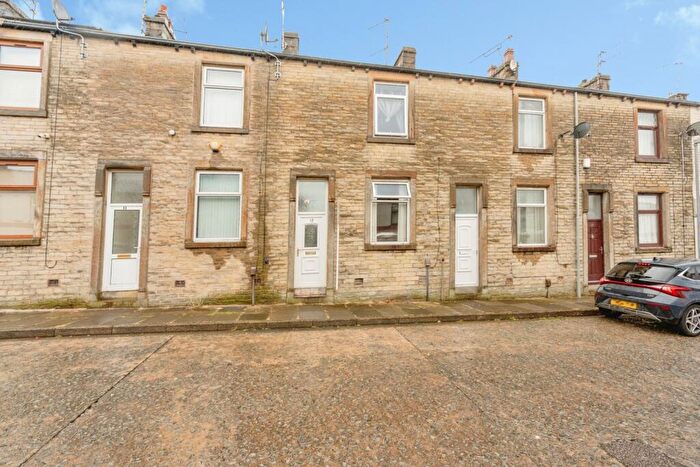
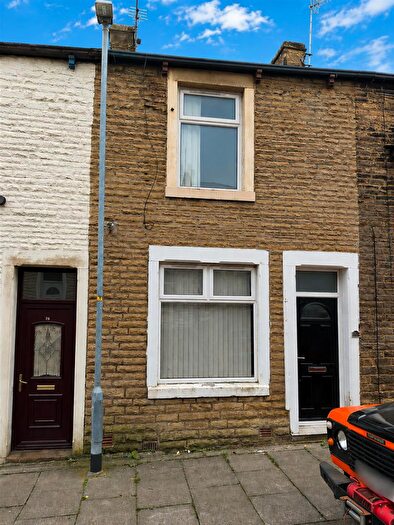
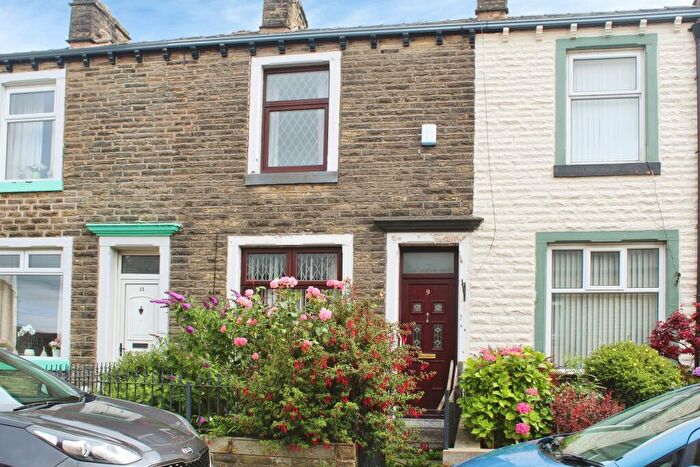
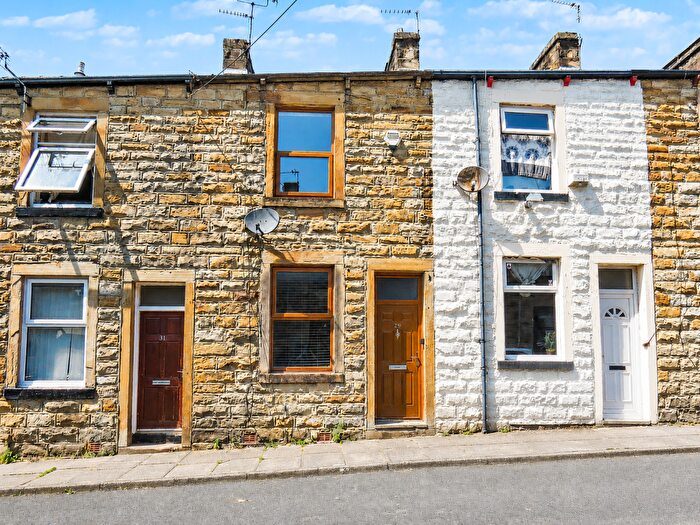
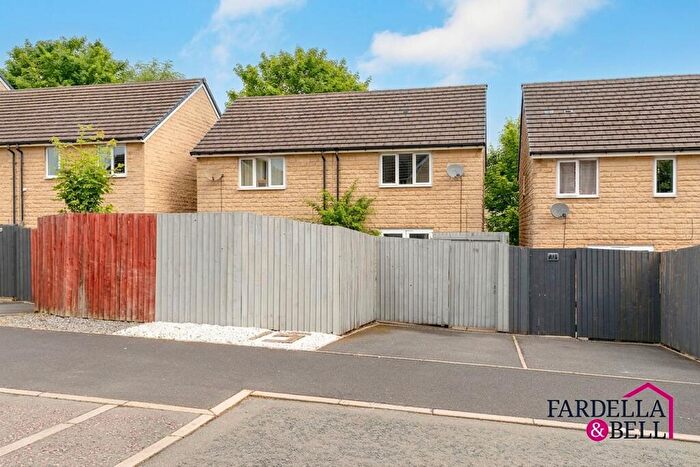
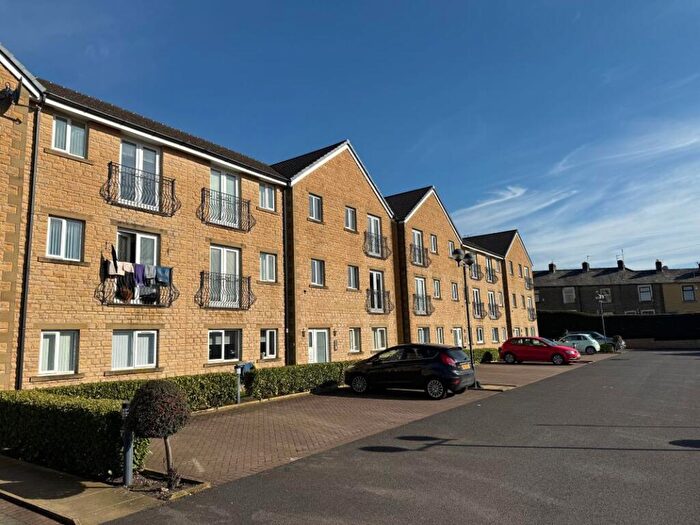
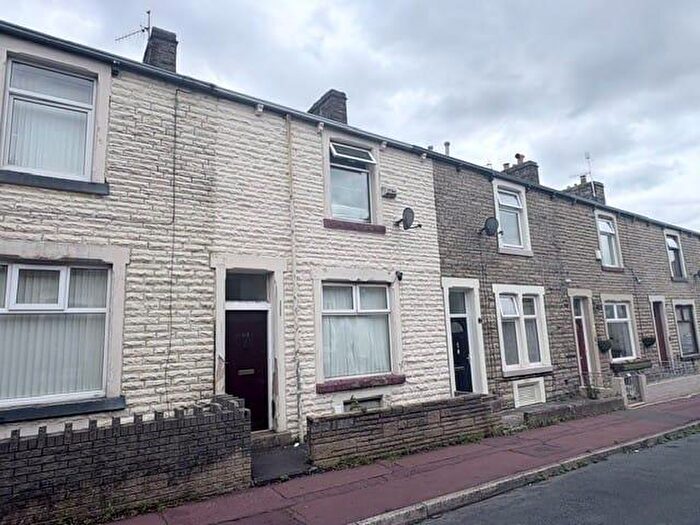
Properties for sale near BB11 5BE, Cambridge Street
![]()
If you are looking to sell your house, let it out, or receive a property valuation, an expert can help you.
Click the button below to get started.
Price Paid in Cambridge Street, BB11 5BE, Trinity
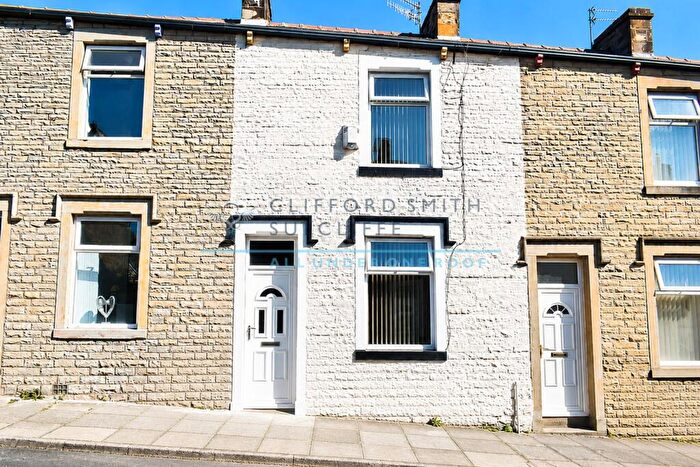
1 Cambridge Street, BB11 5BE, Trinity Burnley
Property 1 has been sold 9 times. The last time it was sold was in 05/03/2026 and the sold price was £56,943.00.
This terraced house, sold as a leasehold on 05/03/2026, is a 95 sqm end-terrace house with an EPC rating of G.
| Date | Price | Property Type | Tenure | Classification |
|---|---|---|---|---|
| 05/03/2026 | £56,943.00 | Terraced House | leasehold | Established Building |
| 09/07/2007 | £48,000.00 | Terraced House | leasehold | Established Building |
| 01/09/2006 | £32,500.00 | Terraced House | leasehold | Established Building |
| 06/06/2006 | £27,500.00 | Terraced House | leasehold | Established Building |
| 22/06/2004 | £21,500.00 | Terraced House | leasehold | Established Building |
| 22/06/2004 | £31,000.00 | Terraced House | leasehold | Established Building |
| 18/03/2004 | £7,750.00 | Terraced House | leasehold | Established Building |
| 22/10/2001 | £15,500.00 | Terraced House | leasehold | Established Building |
| 23/03/2001 | £5,000.00 | Terraced House | leasehold | Established Building |
Property price trends in BB11 5BE, Cambridge Street
According to the latest Land Registry data, the average home in BB11 5BE, Cambridge Street sold for £48,000 in 2007. That figure comes from 8 sales logged over the past 6 years.
Prices have continued to climb over the last three years. Compared with 2004, when the typical sale came in around £20,083, that's a rise of roughly 139%.
Looking back five years, average prices are up about 368.3% since 2001, a gain of around £37,750 in cash terms.
Property Price Paid in BB11 5BE, Cambridge Street by Year
The average sold property price by year was:
| Year | Average Sold Price | Price Change |
Sold Properties
|
|---|---|---|---|
| 2007 | £48,000 | 38% |
1 Property |
| 2006 | £30,000 | 33% |
2 Properties |
| 2004 | £20,083 | 49% |
3 Properties |
| 2001 | £10,250 | - |
2 Properties |
