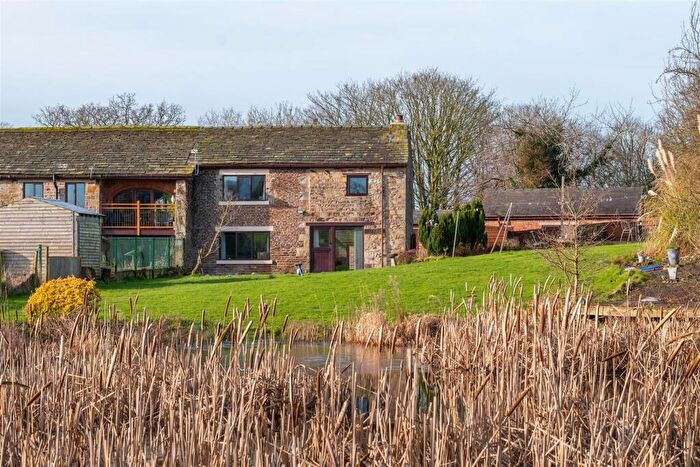
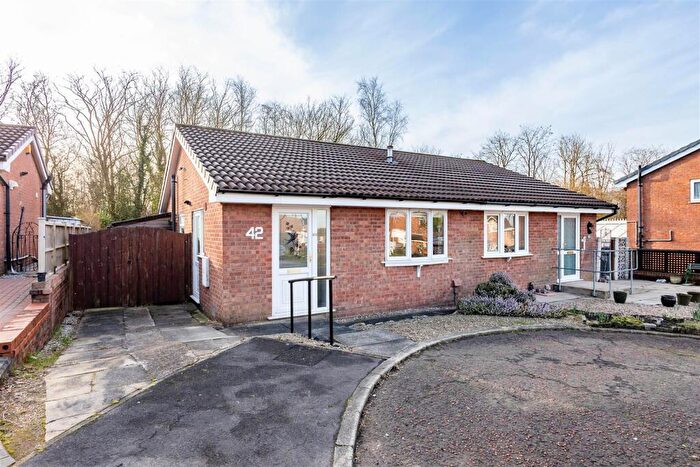
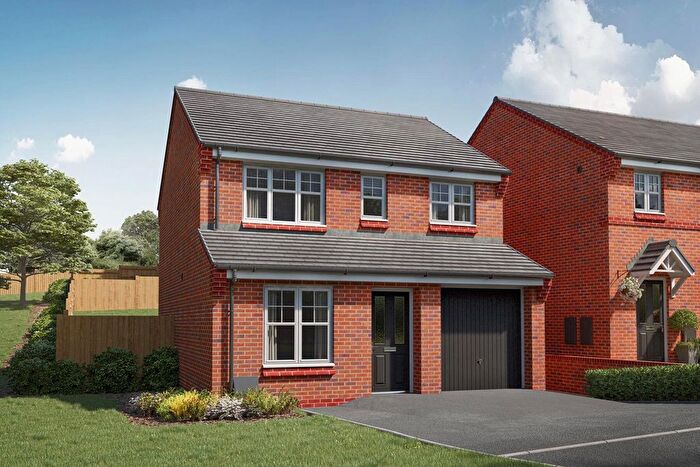
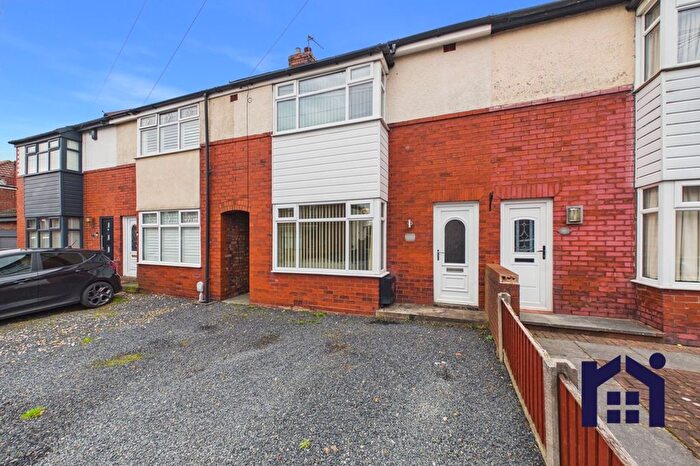
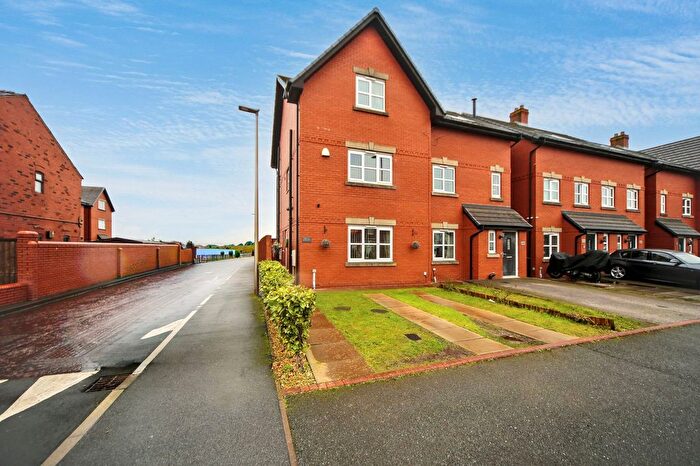
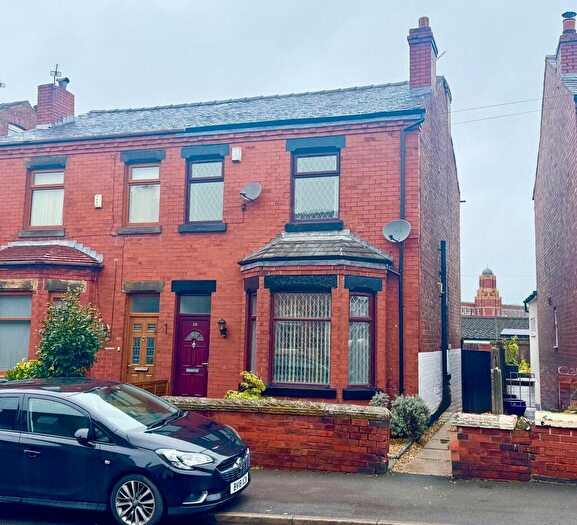
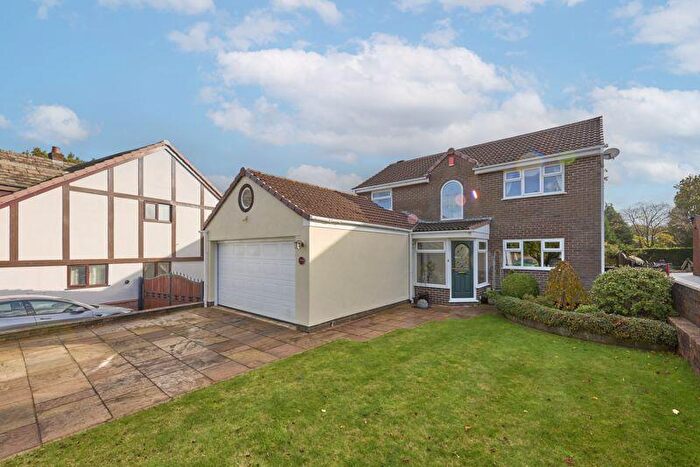
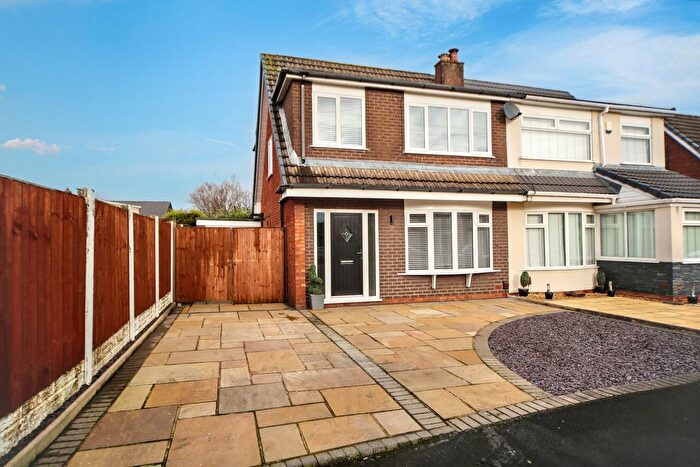
Houses for sale & to rent in Chisnall, Chorley
House Prices in Chisnall
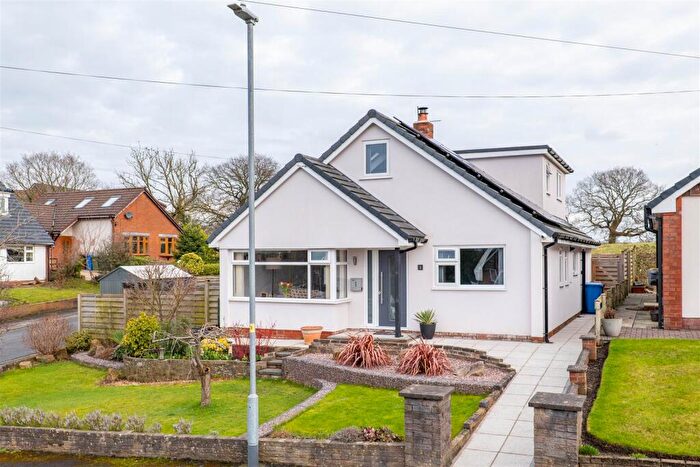
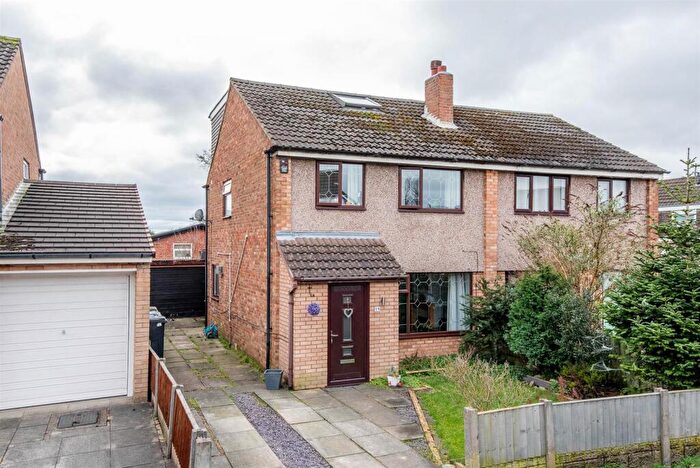
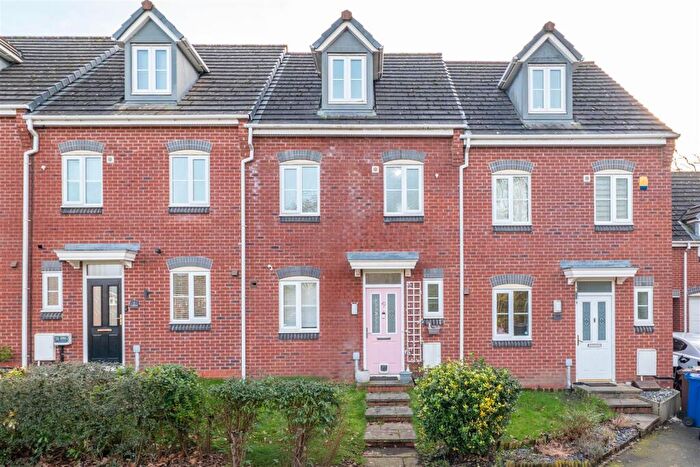
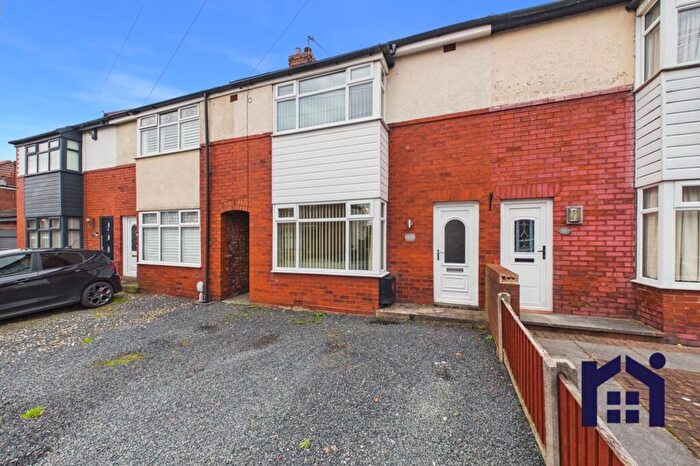
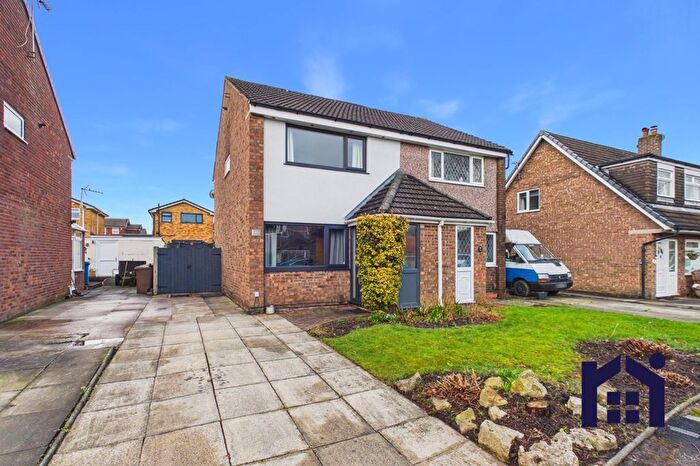
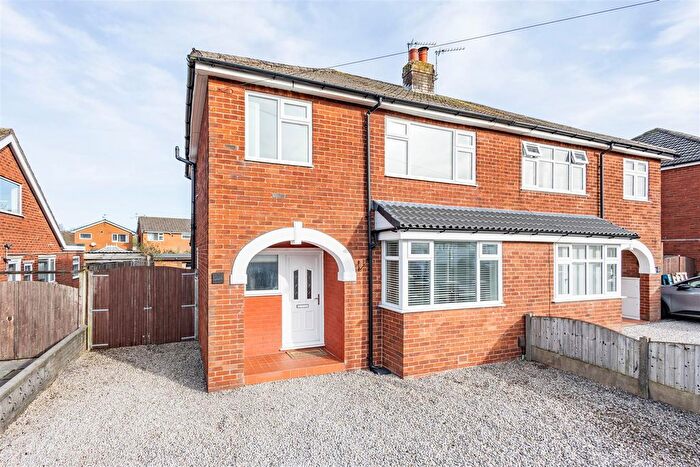
Properties in Chisnall have an average house price of £259,226.00 and had 158 Property Transactions within the last 3 years¹.
Chisnall is an area in Chorley, Lancashire with 1,662 households², where the most expensive property was sold for £1,042,500.00.
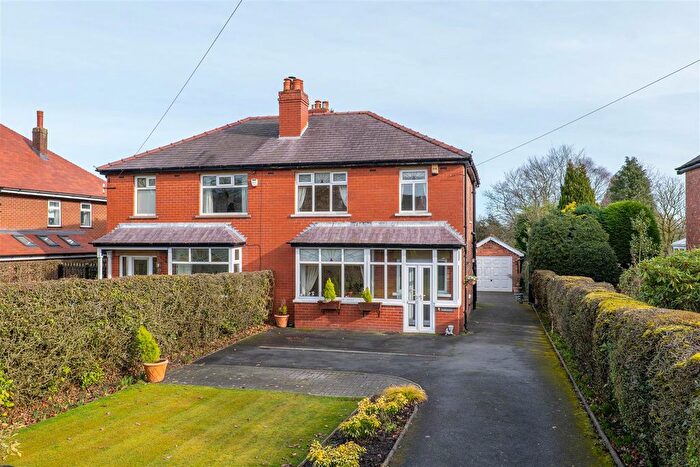
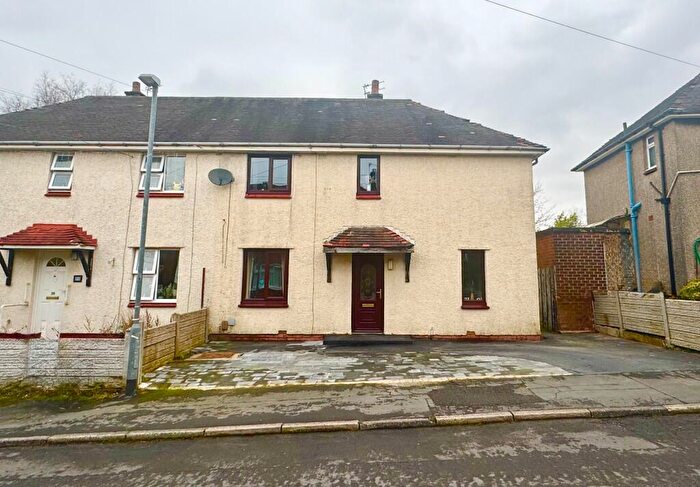
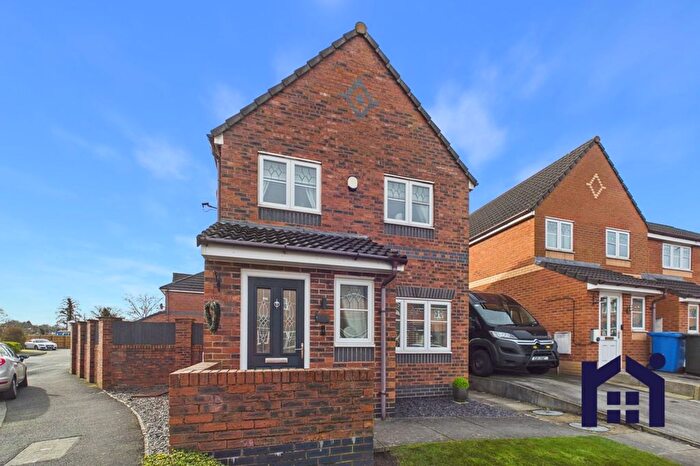
Properties for sale in Chisnall
Roads and Postcodes in Chisnall
Navigate through our locations to find the location of your next house in Chisnall, Chorley for sale or to rent.
| Streets | Postcodes |
|---|---|
| Alder Drive | PR7 5NJ |
| Alma Drive | PR7 3RD |
| Ashdale Close | PR7 5JJ |
| Back Lane | PR7 5JS PR7 5JT PR7 5JX |
| Bannister Green | PR7 5PL PR7 5PP |
| Barmskin Lane | PR7 5PT |
| Belmont Place | PR7 5DX |
| Blainscough Lane | PR7 5HT |
| Bogburn Lane | PR7 5JF |
| Brook Lane | PR7 5LJ |
| Burwell Avenue | PR7 5DL |
| Charter Lane | PR7 5LY PR7 5LZ |
| Cherry Tree Close | PR7 5FJ |
| Chisnall Lane | PR7 5EA |
| Chorley Lane | PR7 3QS PR7 5EP PR7 5ES PR7 5EZ PR7 5HB PR7 5HE |
| Church Fold | PR7 3RE |
| Church Lane | PR7 3RB PR7 5NA |
| Coppull Moor Lane | PR7 5JA |
| Crane Street | PR7 5JE |
| Croston Lane | PR7 5HJ |
| Delph Lane | PR7 5LD PR7 5ND |
| Dob Brow | PR7 3QR |
| Dob Brow Close | PR7 3BN |
| Freemans Lane | PR7 5ER |
| German Lane | PR7 5NE |
| Glover Road | PR7 5DT |
| Grange Drive | PR7 5FG |
| Harrock View | PR7 5PZ |
| Highgrove Avenue | PR7 5LW |
| Hill View Drive | PR7 5DG |
| Langton Close | PR7 5UU |
| Leeson Avenue | PR7 5NB |
| Lichen Close | PR7 5RY PR7 5TT |
| Lucas Avenue | PR7 5NF |
| Manor Way | PR7 5FH |
| Meadow Way | PR7 5DQ |
| Meadowlands | PR7 5QH PR7 5RX |
| Merefold | PR7 5EX |
| Mill Lane | PR7 5LG PR7 5LQ |
| Neargates | PR7 5EY |
| Nursery Close | PR7 5UA |
| Old Hall Lane | PR7 5LB |
| Park Hall Road | PR7 5LS |
| Preston Road | PR7 5DN PR7 5DP PR7 5DR PR7 5DS PR7 5DU PR7 5DW PR7 5EB PR7 5ED PR7 5HH PR7 5HL PR7 5HY PR7 5JP PR7 5JZ PR7 5LE PR7 5LH |
| Rivington Place | PR7 5DY |
| Robin Close | PR7 5HA |
| Sharratts Path | PR7 3QP |
| Southgates | PR7 5EU |
| Spendmore Lane | PR7 5DD PR7 5DH |
| Stocks Court | PR7 5JN |
| Stocks Lane | PR7 5LT |
| Tansley Avenue | PR7 5DJ |
| The Foxwood | PR7 5JQ |
| The Meadows | PR7 5NR |
| The Warings | PR7 5NZ |
| Town Lane | PR7 5HP |
| West End Avenue | PR7 5DB |
| Whalley Road | PR7 5NY |
| Whitegate Fold | PR7 5ET |
| Willow Drive | PR7 5NL |
| Withington Lane | PR7 5LU |
| Wood Lane | PR7 5NP PR7 5NS PR7 5NT PR7 5NU PR7 5PA |
| Wrennalls Lane | PR7 5PW |
| Yew Tree Villas | PR7 5LF |
| Yewlands Avenue | PR7 5LN |
Transport near Chisnall
-
Euxton Balshaw Lane Station
-
Chorley Station
-
Buckshaw Parkway Station
-
Adlington (Lancashire) Station
-
Appley Bridge Station
-
Parbold Station
-
Croston Station
-
Leyland Station
-
Gathurst Station
- FAQ
- Price Paid By Year
- Property Type Price
Frequently asked questions about Chisnall
What is the average price for a property for sale in Chisnall?
The average price for a property for sale in Chisnall is £259,226. This amount is 15% higher than the average price in Chorley. There are 1,821 property listings for sale in Chisnall.
What streets have the most expensive properties for sale in Chisnall?
The streets with the most expensive properties for sale in Chisnall are Barmskin Lane at an average of £708,750, Freemans Lane at an average of £425,000 and Ashdale Close at an average of £390,000.
What streets have the most affordable properties for sale in Chisnall?
The streets with the most affordable properties for sale in Chisnall are Crane Street at an average of £138,500, Hill View Drive at an average of £152,500 and Bogburn Lane at an average of £156,250.
Which train stations are available in or near Chisnall?
Some of the train stations available in or near Chisnall are Euxton Balshaw Lane, Chorley and Buckshaw Parkway.
Property Price Paid in Chisnall by Year
The average sold property price by year was:
| Year | Average Sold Price | Price Change |
Sold Properties
|
|---|---|---|---|
| 2025 | £245,456 | -13% |
50 Properties |
| 2024 | £276,561 | 8% |
56 Properties |
| 2023 | £253,797 | -17% |
52 Properties |
| 2022 | £295,832 | 8% |
62 Properties |
| 2021 | £270,760 | 15% |
91 Properties |
| 2020 | £230,359 | -8% |
59 Properties |
| 2019 | £248,981 | 14% |
71 Properties |
| 2018 | £213,912 | 8% |
56 Properties |
| 2017 | £196,838 | 7% |
55 Properties |
| 2016 | £182,280 | -22% |
70 Properties |
| 2015 | £222,968 | 5% |
57 Properties |
| 2014 | £211,603 | 11% |
58 Properties |
| 2013 | £188,158 | 12% |
49 Properties |
| 2012 | £165,497 | -13% |
41 Properties |
| 2011 | £186,420 | -0,2% |
54 Properties |
| 2010 | £186,750 | 4% |
36 Properties |
| 2009 | £179,811 | -33% |
34 Properties |
| 2008 | £239,597 | 19% |
48 Properties |
| 2007 | £194,145 | -7% |
85 Properties |
| 2006 | £208,353 | 21% |
82 Properties |
| 2005 | £163,963 | 10% |
53 Properties |
| 2004 | £147,895 | 17% |
89 Properties |
| 2003 | £122,730 | 13% |
124 Properties |
| 2002 | £106,836 | 12% |
111 Properties |
| 2001 | £93,792 | 16% |
102 Properties |
| 2000 | £79,068 | 13% |
74 Properties |
| 1999 | £68,425 | -6% |
74 Properties |
| 1998 | £72,583 | -7% |
58 Properties |
| 1997 | £77,735 | 31% |
78 Properties |
| 1996 | £53,638 | -17% |
44 Properties |
| 1995 | £62,545 | - |
35 Properties |
Property Price per Property Type in Chisnall
Here you can find historic sold price data in order to help with your property search.
The average Property Paid Price for specific property types in the last three years are:
| Property Type | Average Sold Price | Sold Properties |
|---|---|---|
| Semi Detached House | £236,015.00 | 61 Semi Detached Houses |
| Detached House | £398,999.00 | 42 Detached Houses |
| Terraced House | £178,233.00 | 55 Terraced Houses |

