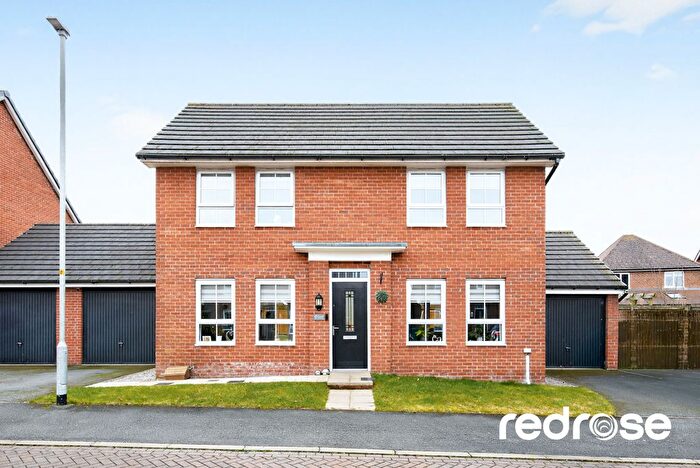
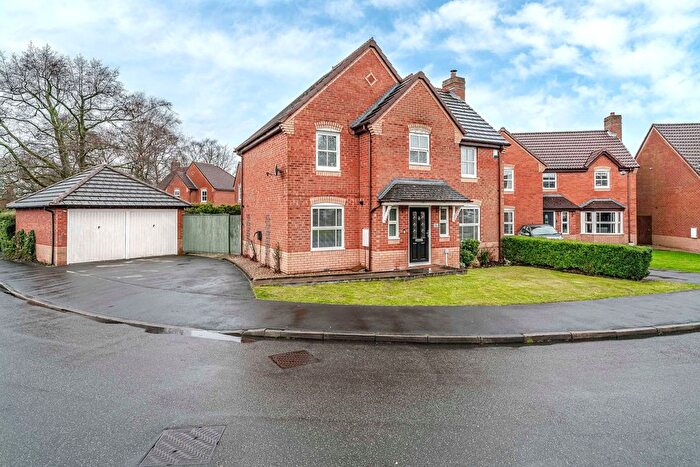
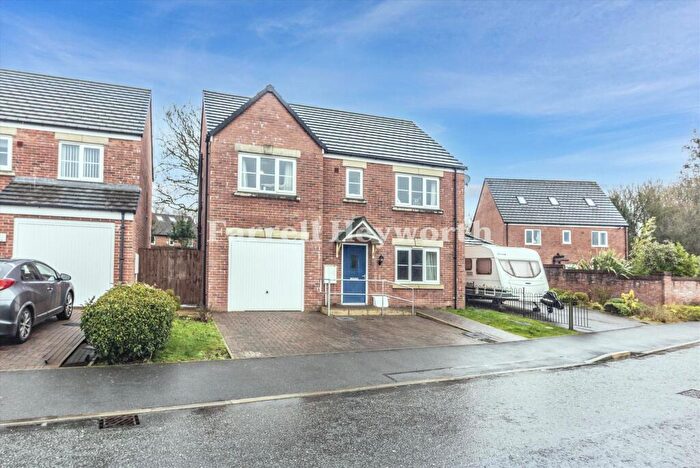
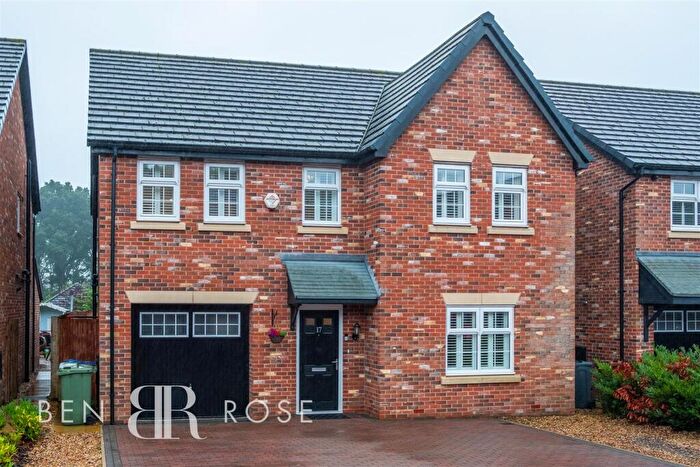
Houses for sale & to rent in Euxton South, Chorley
House Prices in Euxton South
Properties in Euxton South have an average house price of £266,433.00 and had 160 Property Transactions within the last 3 years¹.
Euxton South is an area in Chorley, Lancashire with 1,614 households², where the most expensive property was sold for £945,000.00.
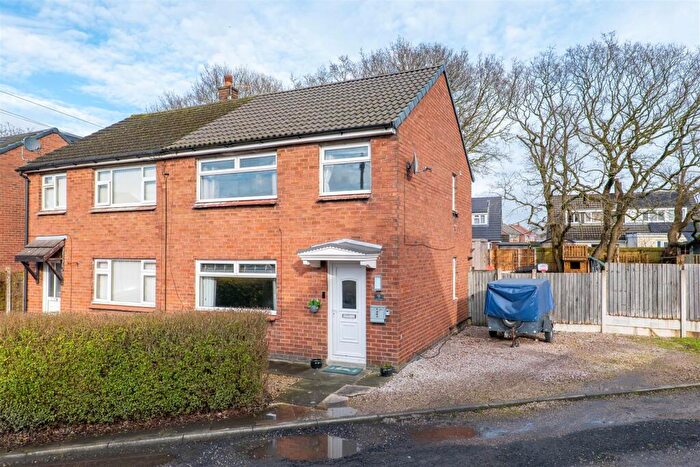
Properties for sale in Euxton South
Roads and Postcodes in Euxton South
Navigate through our locations to find the location of your next house in Euxton South, Chorley for sale or to rent.
| Streets | Postcodes |
|---|---|
| Ambleside Avenue | PR7 6NX |
| Anderton Road | PR7 6JA |
| Balshaw Avenue | PR7 6HY |
| Balshaw House Gardens | PR7 6QG |
| Balshaw Lane | PR7 6HU PR7 6HX |
| Baronsway | PR7 6PS |
| Bredon Avenue | PR7 6NS |
| Casterton | PR7 6HN |
| Chiltern Avenue | PR7 6NU |
| Church Walk | PR7 6HL |
| Coniston Avenue | PR7 6NY |
| Conway Close | PR7 6NT |
| Cotswold Avenue | PR7 6NR |
| Countess Way | PR7 6PT |
| Culbeck Lane | PR7 6EP |
| Dale Avenue | PR7 6PF |
| Dawbers Lane | PR7 6DZ PR7 6EB PR7 6ED PR7 6EE PR7 6EF PR7 6EL PR7 6EN PR7 6EQ PR7 6EU PR7 6EW |
| Dean Hall Lane | PR7 6ER |
| Dunrobin Drive | PR7 6NE |
| Earlsway | PR7 6QA |
| Empress Way | PR7 6QB |
| Euxton Hall Gardens | PR7 6PB |
| Euxton Hall Mews | PR7 6QE |
| Fieldside Avenue | PR7 6JF |
| Grasmere Close | PR7 6NP |
| Hawkshead Avenue | PR7 6NZ |
| Highways Avenue | PR7 6PA PR7 6QD |
| Hillside Close | PR7 6JB |
| Kingsway | PR7 6PP PR7 6PR |
| Mallom Avenue | PR7 6PU |
| Mill Lane | PR7 6EJ |
| Old Dawbers Lane | PR7 6EH |
| Park Avenue | PR7 6JQ |
| Pennine Avenue | PR7 6PE |
| Pincock Brow | PR7 6LD |
| Pincock Street | PR7 6LR |
| Princess Way | PR7 6PH PR7 6PJ PR7 6PL PR7 6PX PR7 6PY |
| Queensway | PR7 6PN PR7 6PW |
| Regency Gardens | PR7 6NW |
| Regents Way | PR7 6PG PR7 6PQ |
| Runshaw Lane | PR7 6EX |
| Southport Road | PR7 6HT |
| Talbot Drive | PR7 6PD |
| Washington Lane | PR7 6DE PR7 6DF PR7 6DQ |
| Whinney Lane | PR7 6DT |
| Wigan Road | PR7 6DY PR7 6HZ PR7 6JD PR7 6JG PR7 6LP |
Transport near Euxton South
- FAQ
- Price Paid By Year
- Property Type Price
Frequently asked questions about Euxton South
What is the average price for a property for sale in Euxton South?
The average price for a property for sale in Euxton South is £266,433. This amount is 18% higher than the average price in Chorley. There are 1,685 property listings for sale in Euxton South.
What streets have the most expensive properties for sale in Euxton South?
The streets with the most expensive properties for sale in Euxton South are Casterton at an average of £655,000, Dawbers Lane at an average of £592,300 and Washington Lane at an average of £525,000.
What streets have the most affordable properties for sale in Euxton South?
The streets with the most affordable properties for sale in Euxton South are Balshaw Avenue at an average of £125,000, Regency Gardens at an average of £131,487 and Chiltern Avenue at an average of £140,000.
Which train stations are available in or near Euxton South?
Some of the train stations available in or near Euxton South are Euxton Balshaw Lane, Buckshaw Parkway and Chorley.
Property Price Paid in Euxton South by Year
The average sold property price by year was:
| Year | Average Sold Price | Price Change |
Sold Properties
|
|---|---|---|---|
| 2025 | £243,670 | -10% |
44 Properties |
| 2024 | £267,669 | -5% |
50 Properties |
| 2023 | £280,673 | 10% |
66 Properties |
| 2022 | £251,994 | 16% |
41 Properties |
| 2021 | £210,935 | 9% |
89 Properties |
| 2020 | £192,588 | 1% |
62 Properties |
| 2019 | £190,013 | 1% |
64 Properties |
| 2018 | £187,418 | 1% |
77 Properties |
| 2017 | £184,652 | -4% |
52 Properties |
| 2016 | £191,511 | 4% |
70 Properties |
| 2015 | £182,978 | 10% |
71 Properties |
| 2014 | £164,576 | 16% |
70 Properties |
| 2013 | £138,526 | -9% |
49 Properties |
| 2012 | £151,231 | -4% |
36 Properties |
| 2011 | £157,267 | -7% |
47 Properties |
| 2010 | £168,333 | -6% |
43 Properties |
| 2009 | £178,874 | -5% |
31 Properties |
| 2008 | £187,321 | 0,2% |
37 Properties |
| 2007 | £187,014 | 9% |
78 Properties |
| 2006 | £170,211 | 5% |
80 Properties |
| 2005 | £162,088 | 3% |
82 Properties |
| 2004 | £156,787 | 23% |
108 Properties |
| 2003 | £121,257 | 16% |
75 Properties |
| 2002 | £101,404 | 22% |
84 Properties |
| 2001 | £79,295 | 5% |
74 Properties |
| 2000 | £75,274 | 11% |
90 Properties |
| 1999 | £67,148 | -3% |
85 Properties |
| 1998 | £68,869 | 6% |
70 Properties |
| 1997 | £64,517 | 11% |
95 Properties |
| 1996 | £57,315 | 6% |
73 Properties |
| 1995 | £53,735 | - |
51 Properties |
Property Price per Property Type in Euxton South
Here you can find historic sold price data in order to help with your property search.
The average Property Paid Price for specific property types in the last three years are:
| Property Type | Average Sold Price | Sold Properties |
|---|---|---|
| Semi Detached House | £215,112.00 | 85 Semi Detached Houses |
| Detached House | £374,681.00 | 55 Detached Houses |
| Terraced House | £218,857.00 | 14 Terraced Houses |
| Flat | £112,225.00 | 6 Flats |

