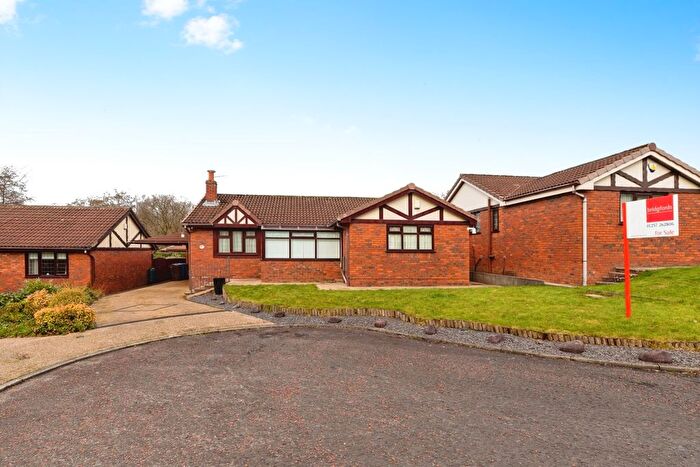
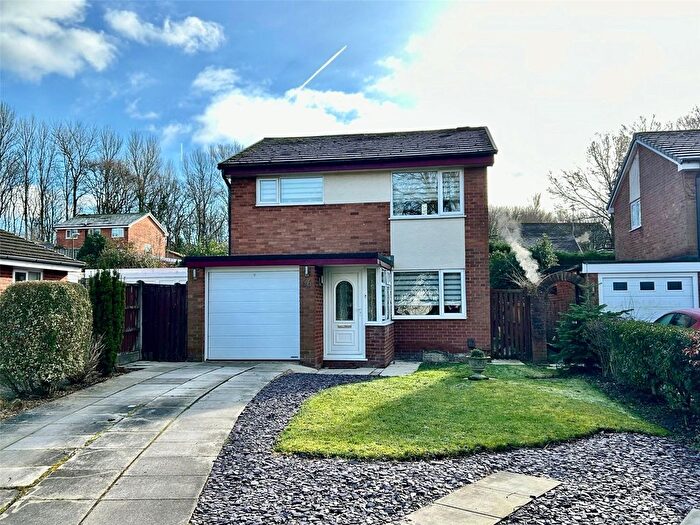
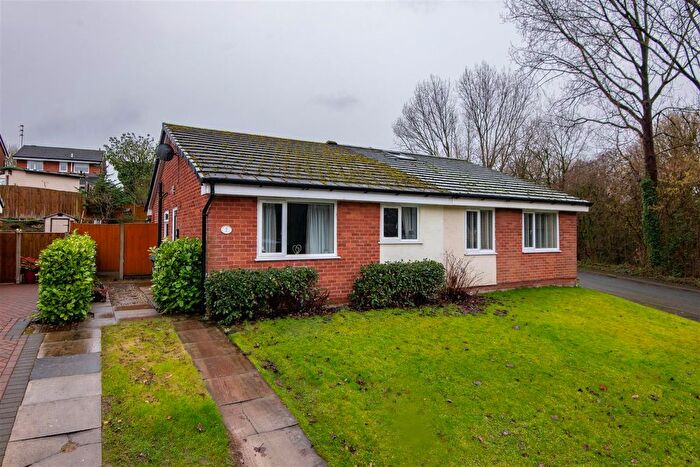
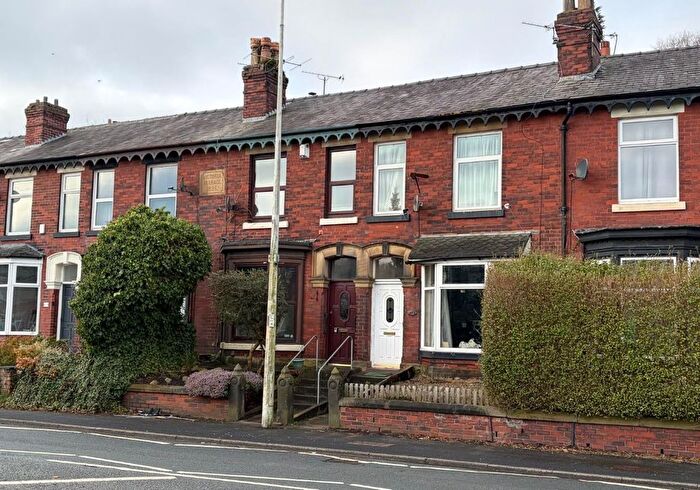
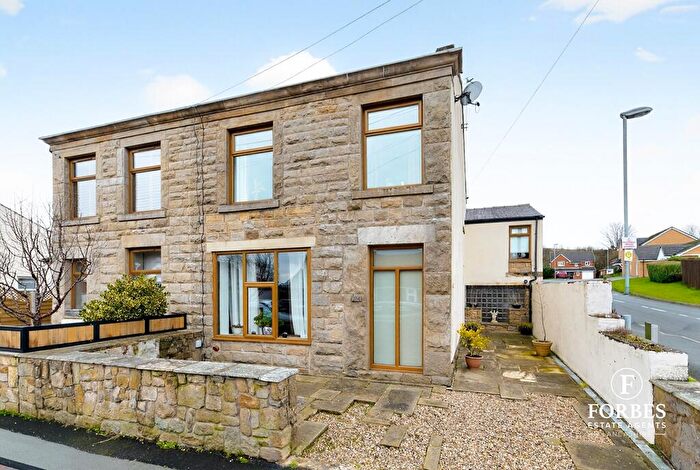
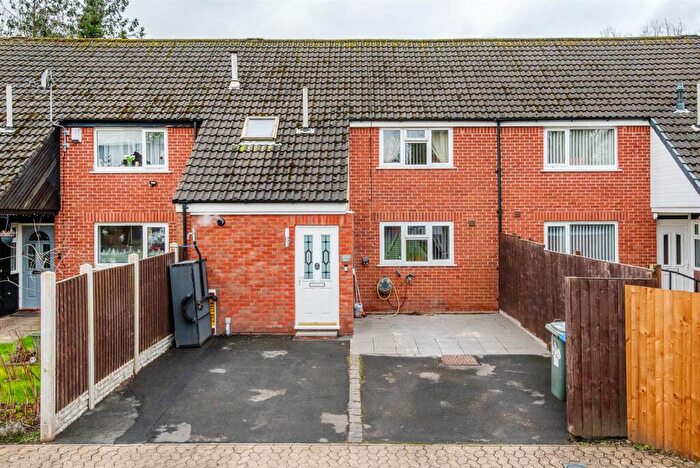
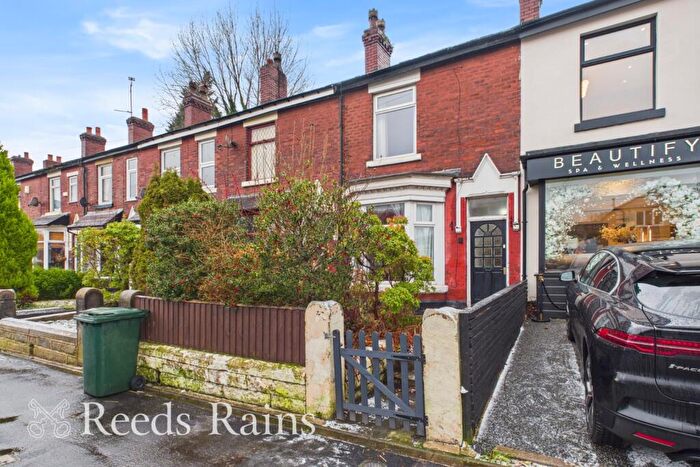
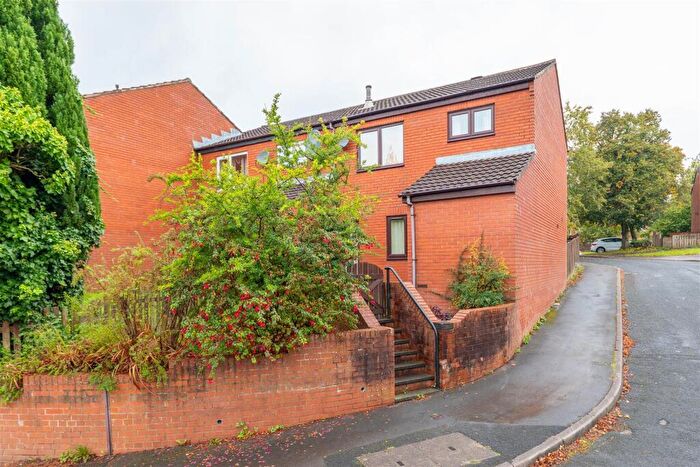
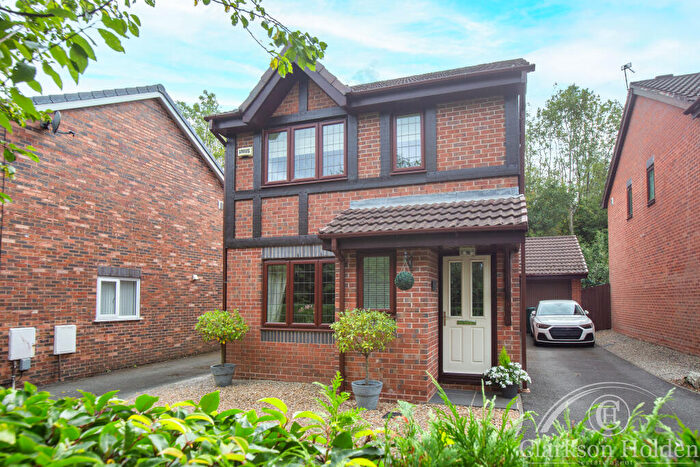
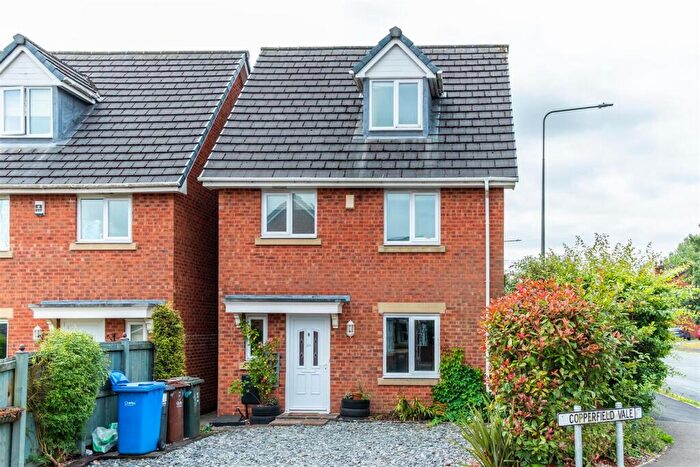
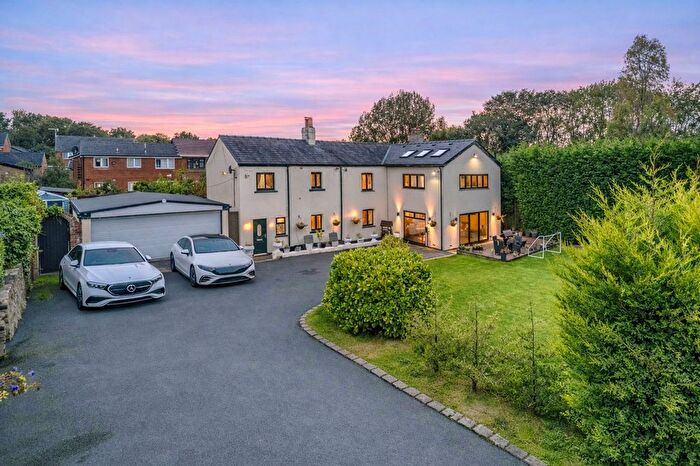
Houses for sale & to rent in Clayton-le-woods North, Chorley
House Prices in Clayton-le-woods North
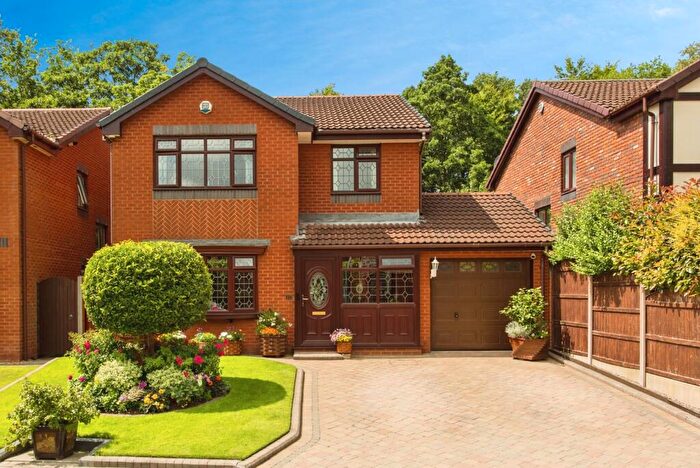
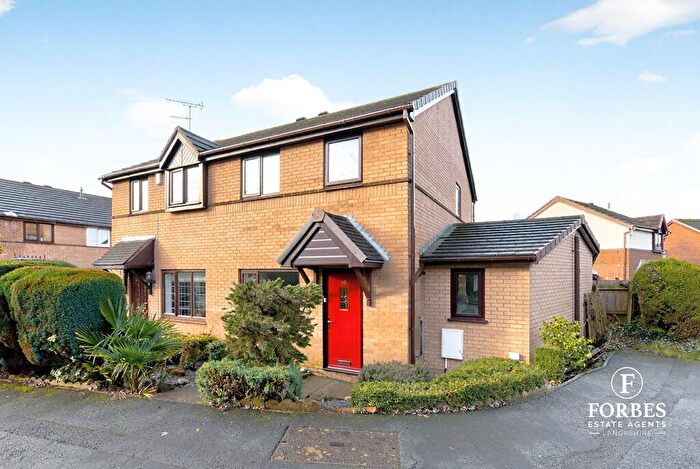
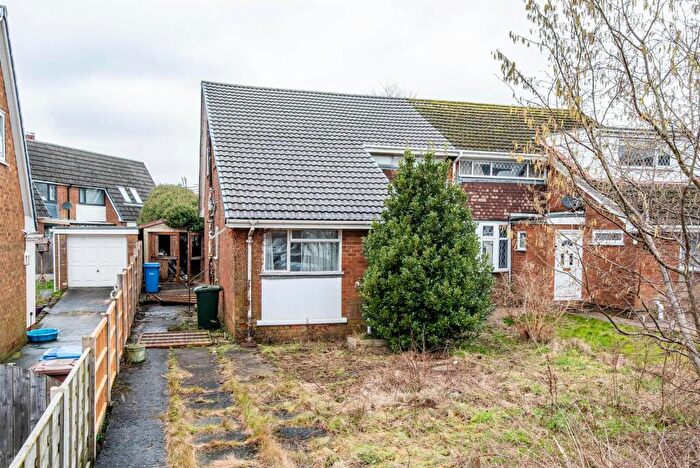
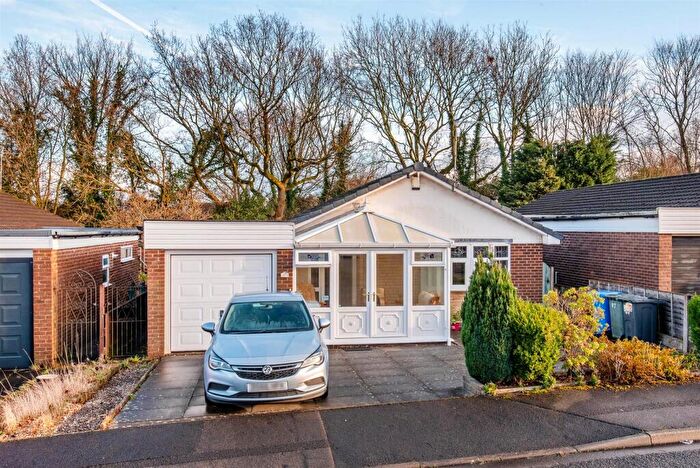
Properties in Clayton-le-woods North have an average house price of £224,868.00 and had 96 Property Transactions within the last 3 years¹.
Clayton-le-woods North is an area in Chorley, Lancashire with 840 households², where the most expensive property was sold for £590,000.00.
Properties for sale in Clayton-le-woods North
Roads and Postcodes in Clayton-le-woods North
Navigate through our locations to find the location of your next house in Clayton-le-woods North, Chorley for sale or to rent.
| Streets | Postcodes |
|---|---|
| Back Lane | PR6 7EU |
| Beechwood Croft | PR6 7EG |
| Black Croft | PR6 7US PR6 7UT |
| Bone Croft | PR6 7UR |
| Brookfield Lane | PR6 7FG |
| Cam Wood Fold | PR6 7SD |
| Clayton Villa Fold | PR6 7ET |
| Dove Cote | PR6 7AY |
| Fir Tree Grove | PR6 7FJ |
| Forsythia Drive | PR6 7DF |
| Gardenia Close | PR6 7DW |
| Glenmore | PR6 7TA PR6 7TB |
| Hazel Close | PR6 7FL |
| Kilncroft | PR6 7UA PR6 7UB PR6 7UD PR6 7UE |
| Lime Tree Close | PR6 7UG |
| Lords Croft | PR6 7TP PR6 7TR |
| Oak Croft | PR6 7UH PR6 7UJ |
| Pear Tree Road | PR6 7JP |
| Pingle Croft | PR6 7UL PR6 7UP |
| Preston Road | PR6 7EB PR6 7EH PR6 7EJ |
| Radburn Brow | PR6 7RA |
| Radburn Close | PR6 7RB |
| Sheep Hill Brow | PR6 7ES |
| Sheep Hill Lane | PR6 7ER PR6 7JH |
| Stack Croft | PR6 7TN |
| Stone House Green | PR6 7JT |
| The Clough | PR6 7DG |
| The Martindales | PR6 7TJ |
| Wood Beech Gardens | PR6 7FH |
Transport near Clayton-le-woods North
- FAQ
- Price Paid By Year
- Property Type Price
Frequently asked questions about Clayton-le-woods North
What is the average price for a property for sale in Clayton-le-woods North?
The average price for a property for sale in Clayton-le-woods North is £224,868. This amount is 0.5% lower than the average price in Chorley. There are 460 property listings for sale in Clayton-le-woods North.
What streets have the most expensive properties for sale in Clayton-le-woods North?
The streets with the most expensive properties for sale in Clayton-le-woods North are Beechwood Croft at an average of £405,000, Pear Tree Road at an average of £387,391 and Cam Wood Fold at an average of £382,750.
What streets have the most affordable properties for sale in Clayton-le-woods North?
The streets with the most affordable properties for sale in Clayton-le-woods North are Pingle Croft at an average of £103,388, Oak Croft at an average of £118,700 and Stack Croft at an average of £130,000.
Which train stations are available in or near Clayton-le-woods North?
Some of the train stations available in or near Clayton-le-woods North are Bamber Bridge, Leyland and Buckshaw Parkway.
Property Price Paid in Clayton-le-woods North by Year
The average sold property price by year was:
| Year | Average Sold Price | Price Change |
Sold Properties
|
|---|---|---|---|
| 2025 | £239,337 | 1% |
25 Properties |
| 2024 | £236,838 | 17% |
41 Properties |
| 2023 | £196,449 | -24% |
30 Properties |
| 2022 | £243,035 | 13% |
50 Properties |
| 2021 | £211,090 | -3% |
48 Properties |
| 2020 | £217,560 | 11% |
34 Properties |
| 2019 | £192,703 | 13% |
27 Properties |
| 2018 | £167,234 | -15% |
37 Properties |
| 2017 | £192,792 | 10% |
44 Properties |
| 2016 | £172,635 | 7% |
37 Properties |
| 2015 | £159,846 | -10% |
33 Properties |
| 2014 | £175,986 | -4% |
35 Properties |
| 2013 | £183,642 | -7% |
41 Properties |
| 2012 | £196,042 | 10% |
50 Properties |
| 2011 | £175,884 | 13% |
49 Properties |
| 2010 | £152,369 | -17% |
36 Properties |
| 2009 | £177,990 | 20% |
33 Properties |
| 2008 | £143,250 | -8% |
20 Properties |
| 2007 | £154,587 | -12% |
55 Properties |
| 2006 | £172,678 | 20% |
59 Properties |
| 2005 | £138,981 | 10% |
40 Properties |
| 2004 | £125,037 | 6% |
78 Properties |
| 2003 | £116,971 | 22% |
83 Properties |
| 2002 | £91,695 | 28% |
58 Properties |
| 2001 | £66,284 | -4% |
75 Properties |
| 2000 | £69,263 | 4% |
64 Properties |
| 1999 | £66,369 | -2% |
52 Properties |
| 1998 | £67,441 | 14% |
43 Properties |
| 1997 | £58,279 | 9% |
59 Properties |
| 1996 | £52,982 | 3% |
39 Properties |
| 1995 | £51,200 | - |
27 Properties |
Property Price per Property Type in Clayton-le-woods North
Here you can find historic sold price data in order to help with your property search.
The average Property Paid Price for specific property types in the last three years are:
| Property Type | Average Sold Price | Sold Properties |
|---|---|---|
| Semi Detached House | £175,433.00 | 30 Semi Detached Houses |
| Detached House | £345,600.00 | 37 Detached Houses |
| Terraced House | £146,112.00 | 15 Terraced Houses |
| Flat | £96,103.00 | 14 Flats |

