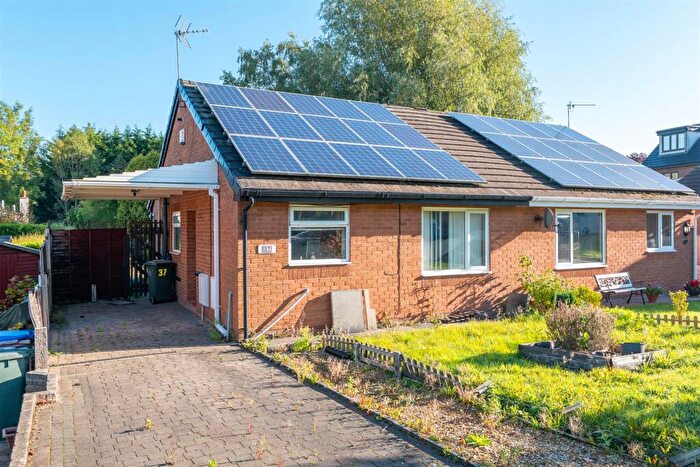
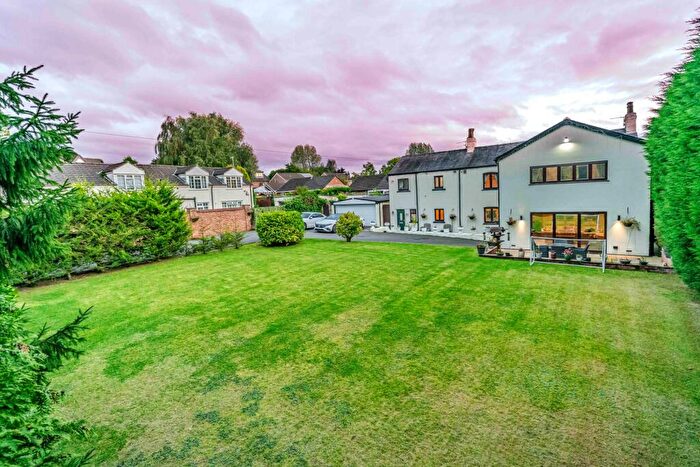
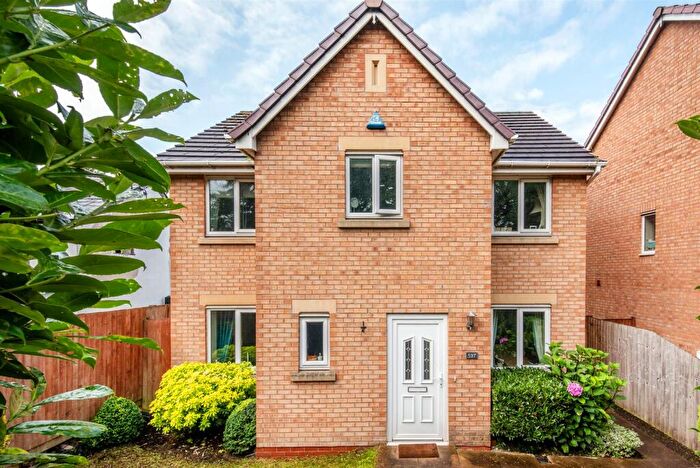
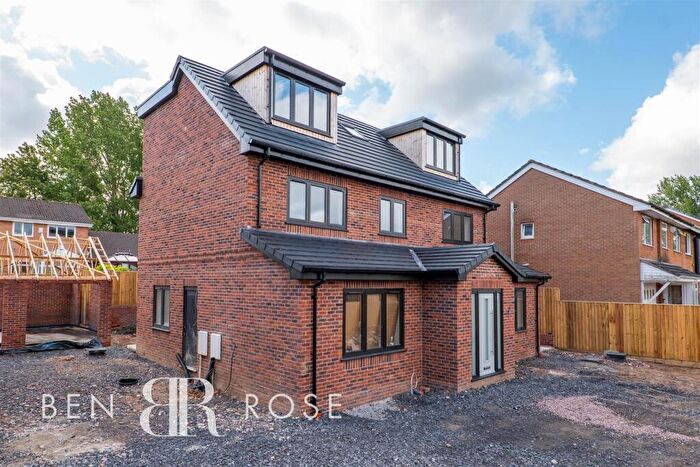
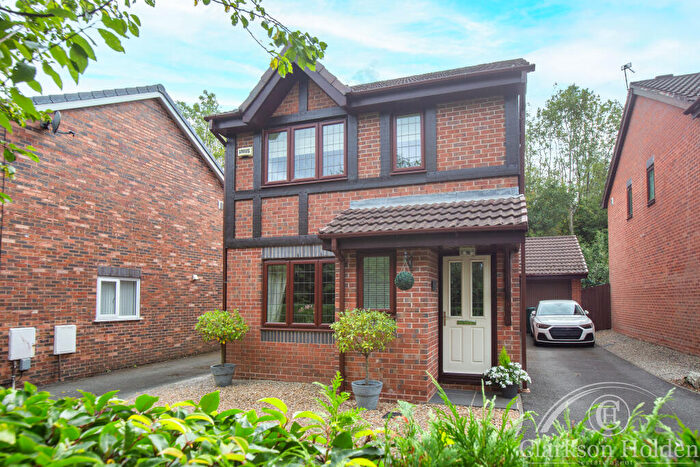
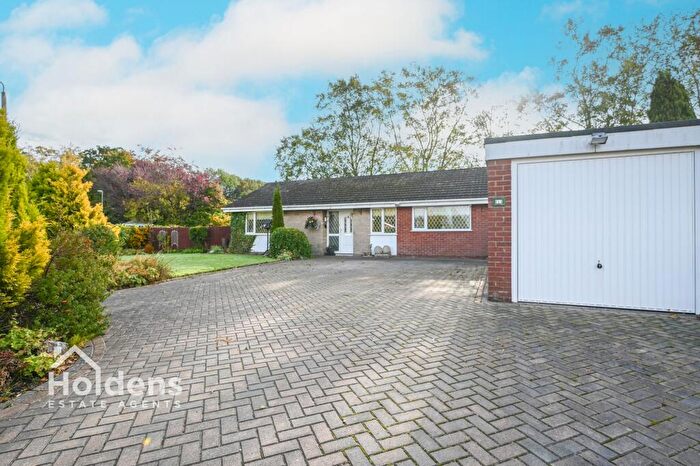
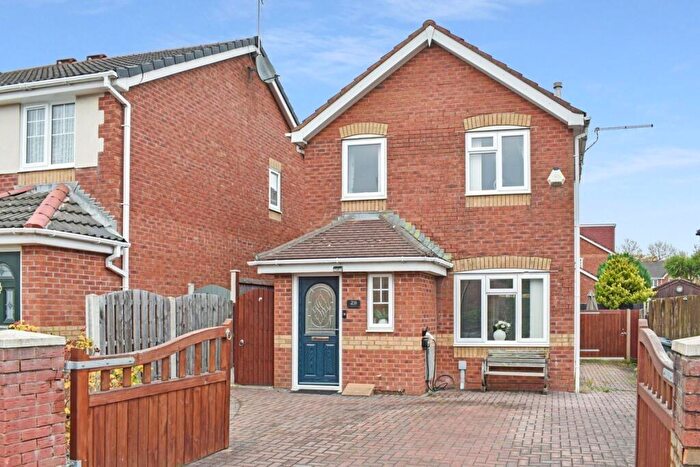
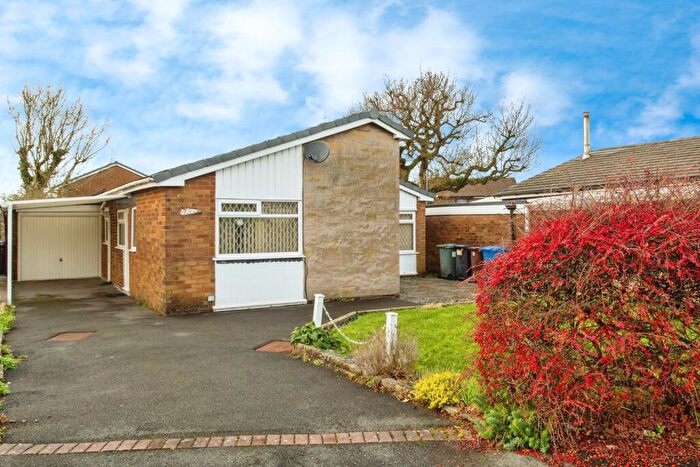
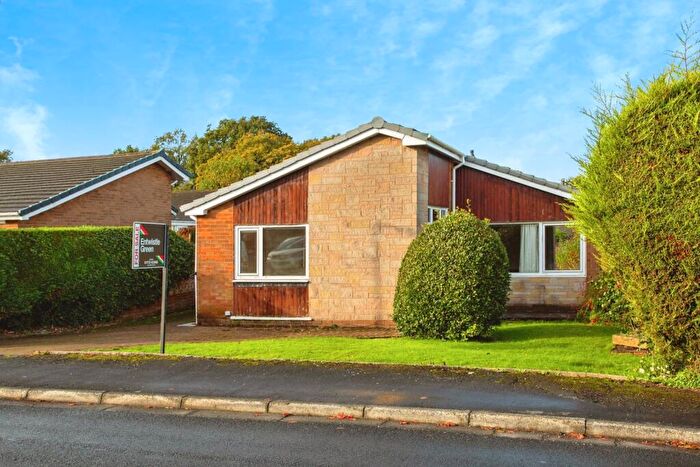
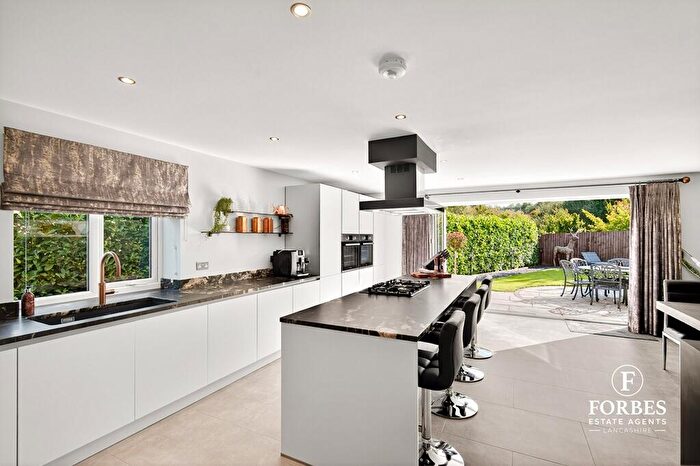
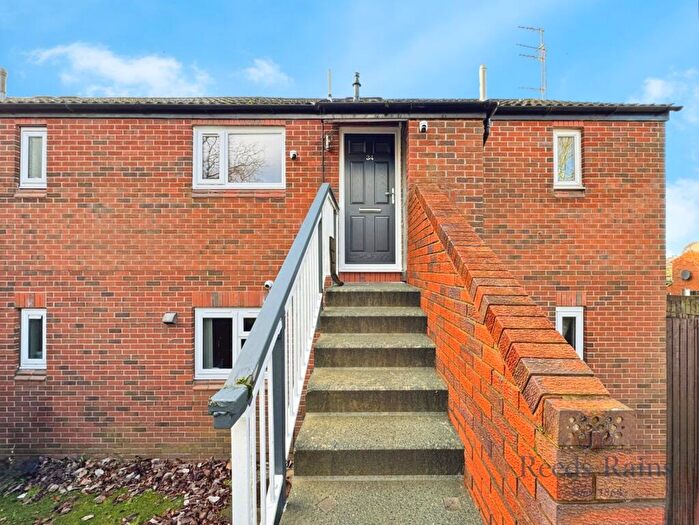
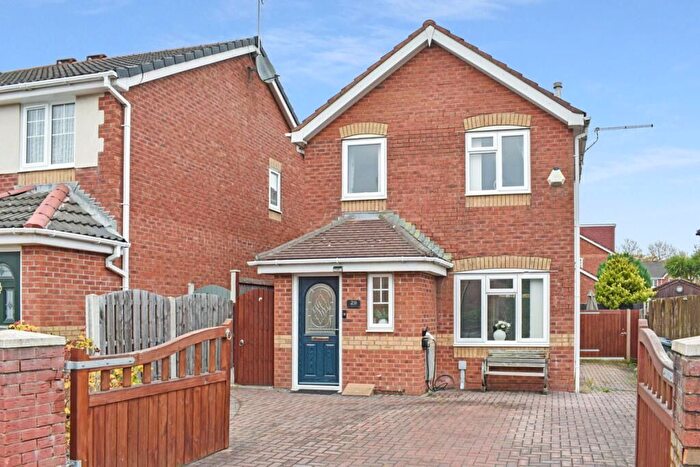
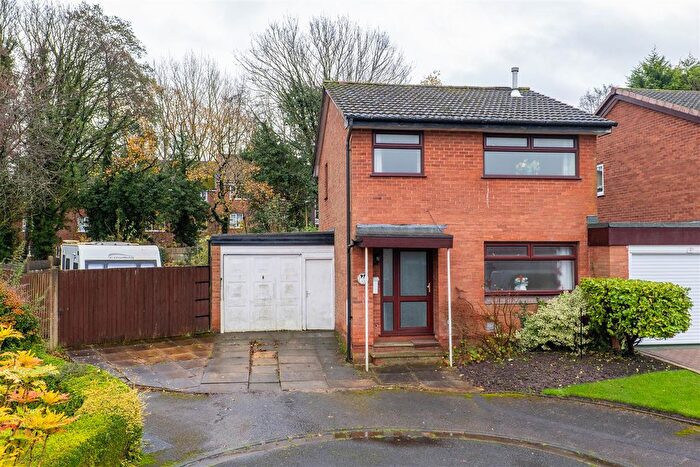
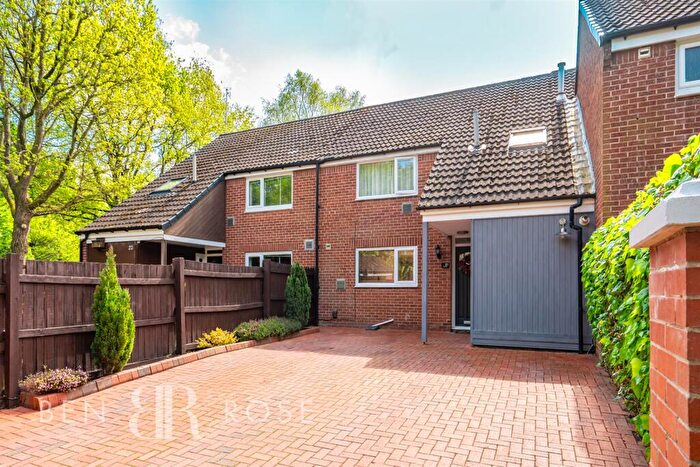
Houses for sale & to rent in Clayton-le-woods North, Preston
House Prices in Clayton-le-woods North
Properties in Clayton-le-woods North have an average house price of £173,198.00 and had 104 Property Transactions within the last 3 years¹.
Clayton-le-woods North is an area in Preston, Lancashire with 1,891 households², where the most expensive property was sold for £470,000.00.
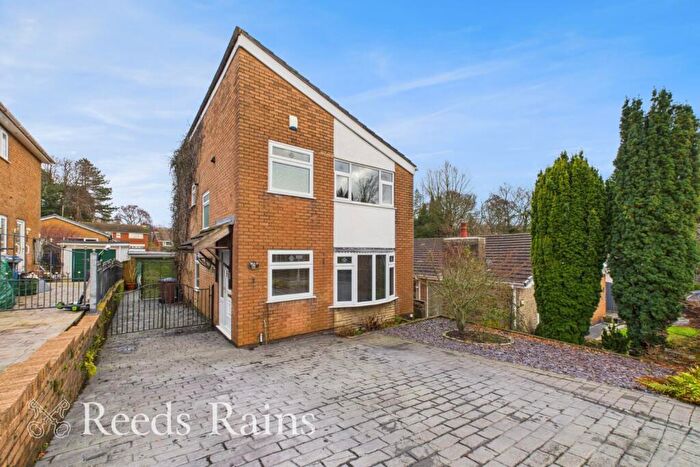
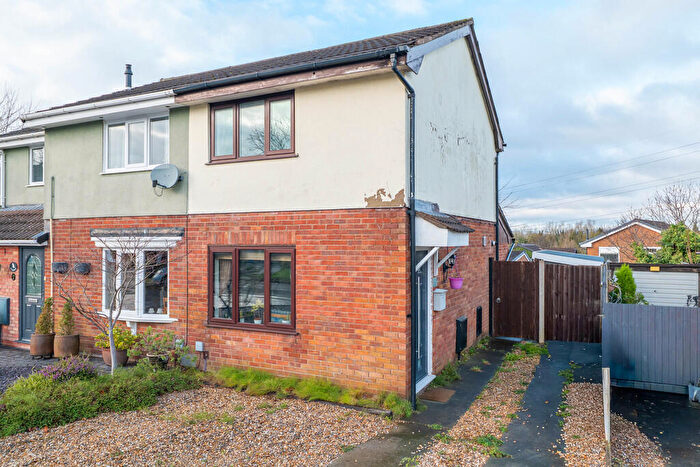
Properties for sale in Clayton-le-woods North
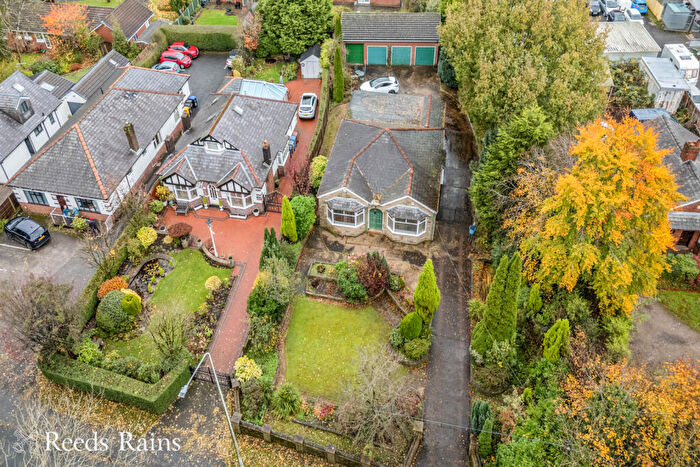
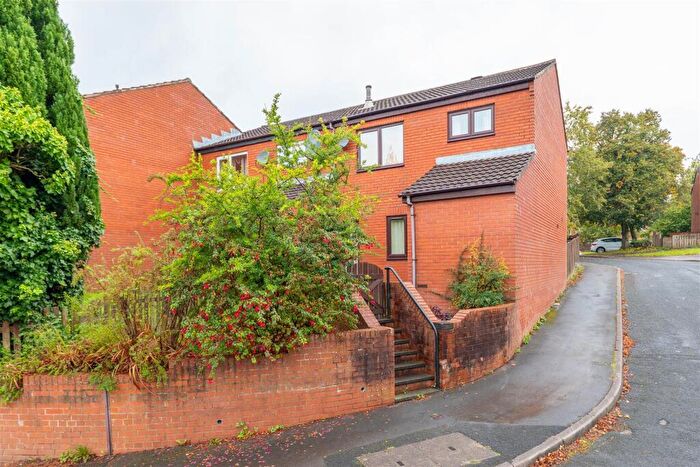
Previously listed properties in Clayton-le-woods North
Roads and Postcodes in Clayton-le-woods North
Navigate through our locations to find the location of your next house in Clayton-le-woods North, Preston for sale or to rent.
| Streets | Postcodes |
|---|---|
| Acrefield | PR5 8EU |
| Ambledene | PR5 8JR |
| Barley Field | PR5 8JH PR5 8JJ PR5 8JQ |
| Barn Meadow | PR5 8DT PR5 8DU PR5 8DX PR5 8DY PR5 8EA |
| Briery Hey | PR5 8HU |
| Brow Hey | PR5 8DS |
| Camwood | PR5 8LA |
| Carr Barn Brow | PR5 8LB |
| Carr Field | PR5 8BS PR5 8BT |
| Carr Meadow | PR5 8HR PR5 8HS |
| Croft Meadow | PR5 8HX |
| Daisy Meadow | PR5 8DB PR5 8DD PR5 8DE PR5 8DH PR5 8DL PR5 8DN PR5 8DR |
| Elmfield Drive | PR5 8LH |
| Gough Lane | PR5 6AQ |
| Greenwood | PR5 8JS PR5 8JT PR5 8JU PR5 8JX PR5 8JY |
| Homestead | PR5 8BA PR5 8BB PR5 8BD PR5 8BE |
| Little Banks Close | PR5 6BU |
| Longacre | PR5 8HB PR5 8HD PR5 8HE PR5 8HH PR5 8HQ |
| Mallards Walk | PR5 6AY |
| Masonfield | PR5 8HN PR5 8HP |
| Maypark | PR5 8JA PR5 8JB PR5 8JD PR5 8JE |
| Pines Close | PR5 8EQ |
| Preston Road | PR5 8JP |
| Reed Field | PR5 8HT |
| School Field | PR5 8BH PR5 8BJ |
| Seven Acres | PR5 8EX PR5 8EY PR5 8HA |
| The Heathers | PR5 8LJ PR5 8LL |
| Three Nooks | PR5 8EJ PR5 8EN |
| Tunley Holme | PR5 8EP PR5 8ER |
| Well Orchard | PR5 8HJ |
| Woodfield | PR5 8EB PR5 8ED PR5 8EE PR5 8EH |
Transport near Clayton-le-woods North
- FAQ
- Price Paid By Year
- Property Type Price
Frequently asked questions about Clayton-le-woods North
What is the average price for a property for sale in Clayton-le-woods North?
The average price for a property for sale in Clayton-le-woods North is £173,198. This amount is 22% lower than the average price in Preston. There are 472 property listings for sale in Clayton-le-woods North.
What streets have the most expensive properties for sale in Clayton-le-woods North?
The streets with the most expensive properties for sale in Clayton-le-woods North are Pines Close at an average of £407,500, Gough Lane at an average of £326,250 and Reed Field at an average of £270,237.
What streets have the most affordable properties for sale in Clayton-le-woods North?
The streets with the most affordable properties for sale in Clayton-le-woods North are Longacre at an average of £93,677, Tunley Holme at an average of £110,000 and Woodfield at an average of £113,333.
Which train stations are available in or near Clayton-le-woods North?
Some of the train stations available in or near Clayton-le-woods North are Bamber Bridge, Lostock Hall and Leyland.
Property Price Paid in Clayton-le-woods North by Year
The average sold property price by year was:
| Year | Average Sold Price | Price Change |
Sold Properties
|
|---|---|---|---|
| 2025 | £203,054 | 16% |
26 Properties |
| 2024 | £170,667 | 12% |
49 Properties |
| 2023 | £150,708 | -6% |
29 Properties |
| 2022 | £160,371 | 4% |
65 Properties |
| 2021 | £154,030 | 19% |
49 Properties |
| 2020 | £125,058 | -7% |
31 Properties |
| 2019 | £133,381 | 2% |
47 Properties |
| 2018 | £130,639 | 7% |
53 Properties |
| 2017 | £121,472 | -5% |
36 Properties |
| 2016 | £127,179 | 4% |
50 Properties |
| 2015 | £121,970 | 11% |
51 Properties |
| 2014 | £108,024 | 1% |
35 Properties |
| 2013 | £106,975 | 5% |
40 Properties |
| 2012 | £102,113 | -13% |
32 Properties |
| 2011 | £115,306 | -14% |
39 Properties |
| 2010 | £131,218 | 18% |
32 Properties |
| 2009 | £107,873 | -3% |
40 Properties |
| 2008 | £110,839 | -13% |
28 Properties |
| 2007 | £125,531 | 7% |
66 Properties |
| 2006 | £116,650 | 2% |
69 Properties |
| 2005 | £114,329 | 17% |
61 Properties |
| 2004 | £95,341 | 23% |
78 Properties |
| 2003 | £73,347 | 8% |
97 Properties |
| 2002 | £67,725 | 16% |
104 Properties |
| 2001 | £56,638 | 0,3% |
94 Properties |
| 2000 | £56,470 | 14% |
65 Properties |
| 1999 | £48,376 | 5% |
63 Properties |
| 1998 | £46,022 | -4% |
62 Properties |
| 1997 | £48,015 | -6% |
74 Properties |
| 1996 | £50,913 | 15% |
70 Properties |
| 1995 | £43,353 | - |
52 Properties |
Property Price per Property Type in Clayton-le-woods North
Here you can find historic sold price data in order to help with your property search.
The average Property Paid Price for specific property types in the last three years are:
| Property Type | Average Sold Price | Sold Properties |
|---|---|---|
| Semi Detached House | £160,828.00 | 43 Semi Detached Houses |
| Detached House | £243,098.00 | 30 Detached Houses |
| Terraced House | £128,830.00 | 26 Terraced Houses |
| Flat | £90,900.00 | 5 Flats |

