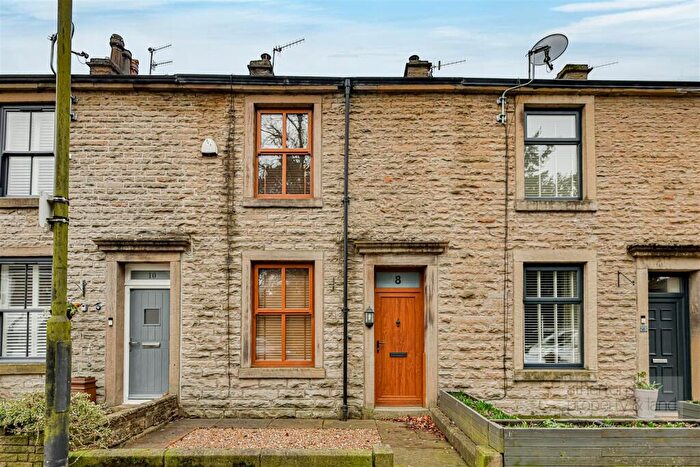
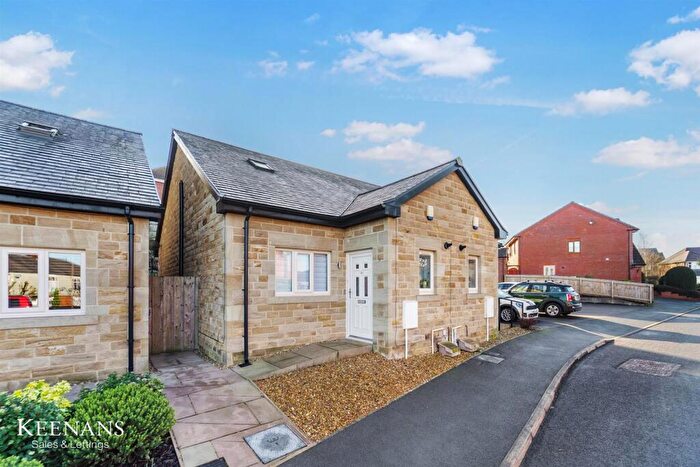
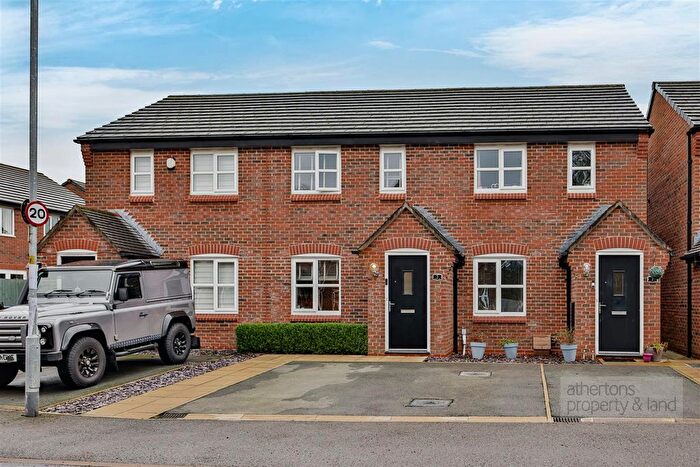
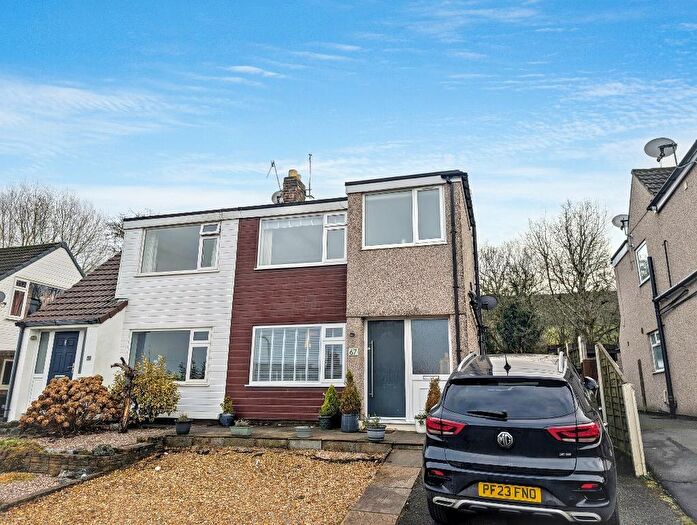
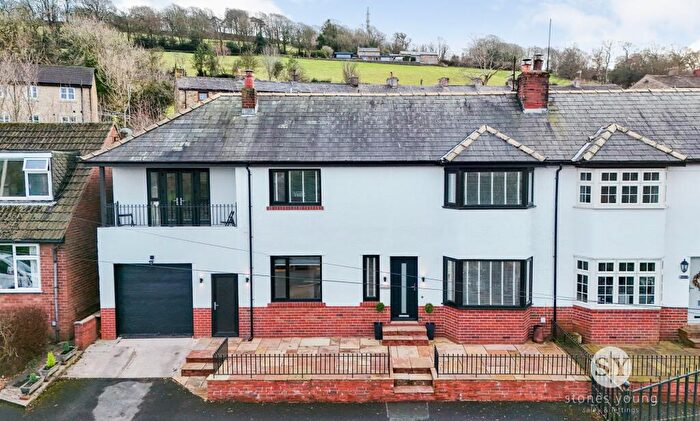
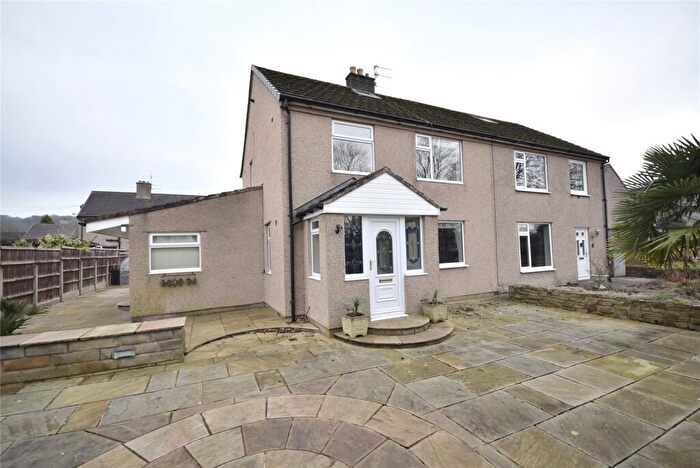
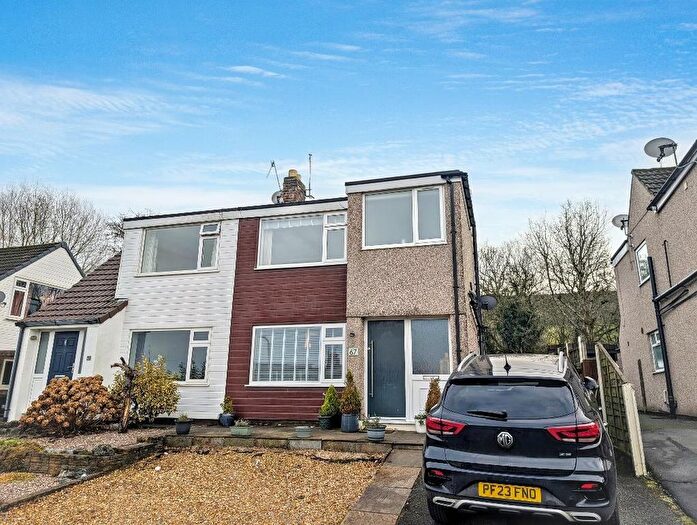
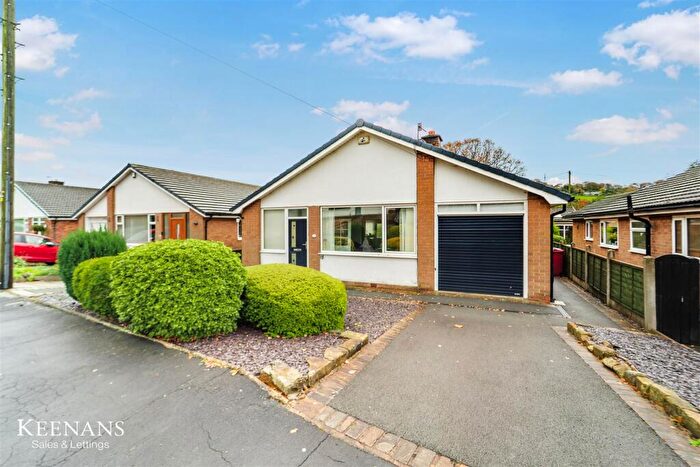
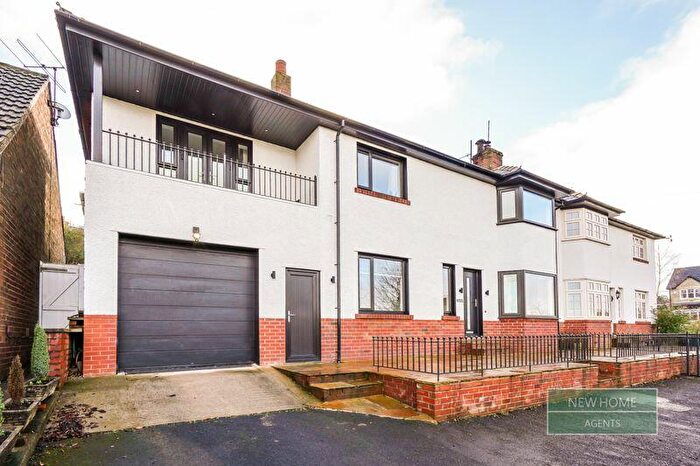
Houses for sale & to rent in Billington And Old Langho, Clitheroe
House Prices in Billington And Old Langho
Properties in Billington And Old Langho have an average house price of £252,187.00 and had 71 Property Transactions within the last 3 years¹.
Billington And Old Langho is an area in Clitheroe, Lancashire with 795 households², where the most expensive property was sold for £960,000.00.
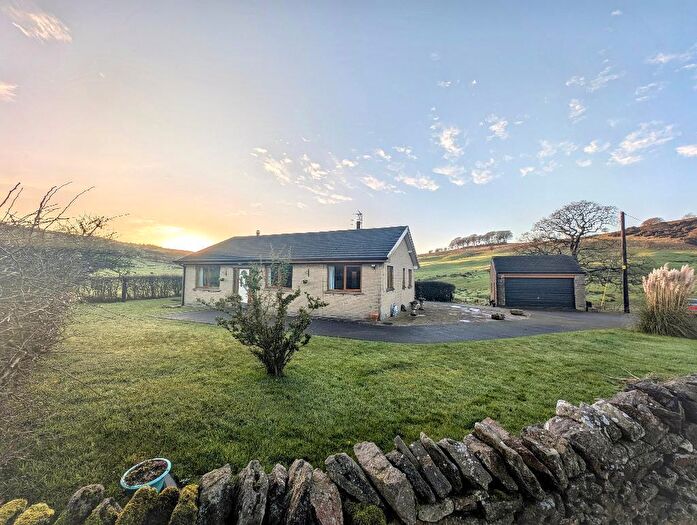
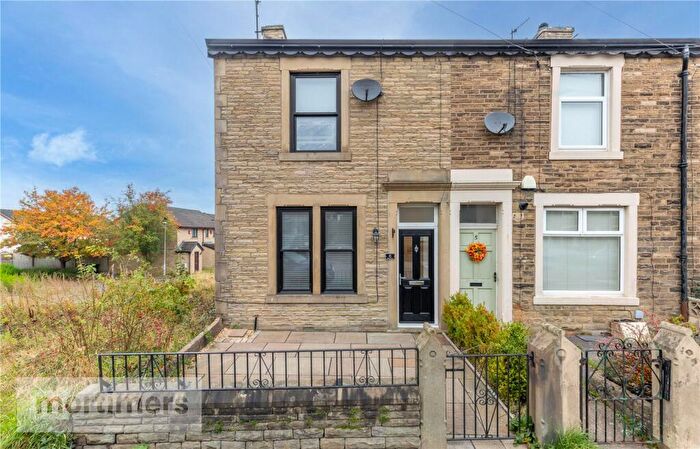
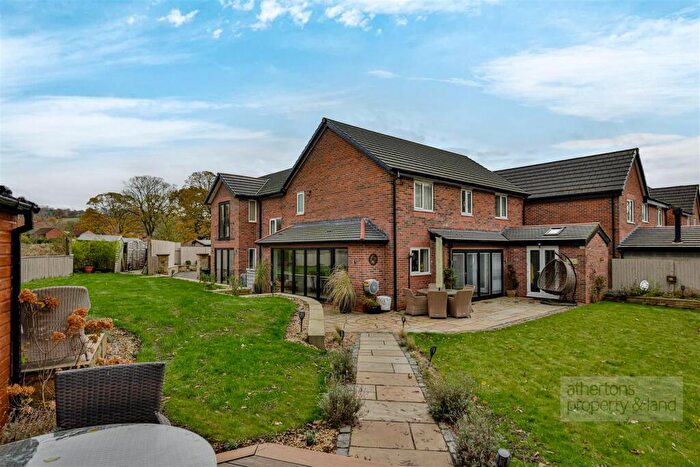
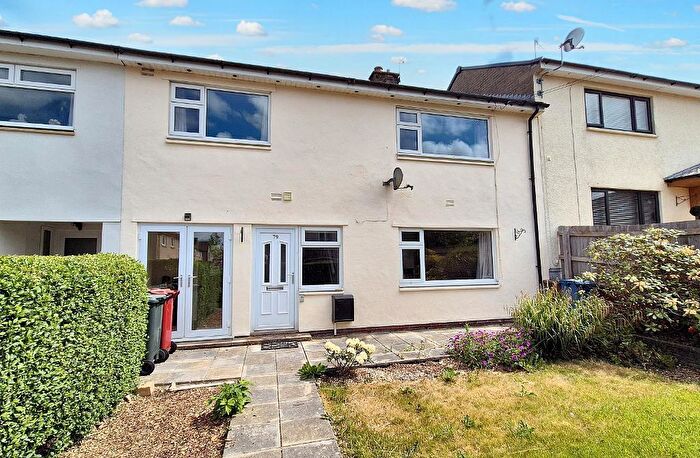
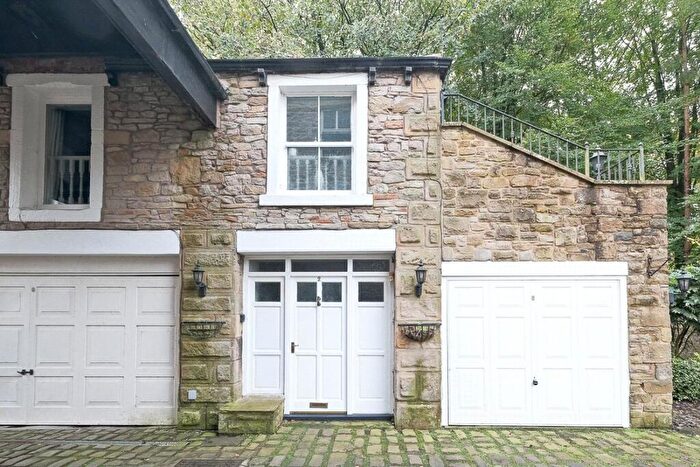
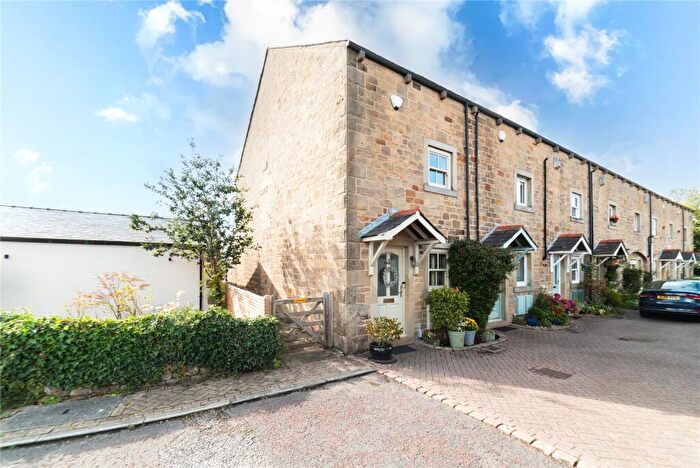
Properties for sale in Billington And Old Langho
Previously listed properties in Billington And Old Langho
Roads and Postcodes in Billington And Old Langho
Navigate through our locations to find the location of your next house in Billington And Old Langho, Clitheroe for sale or to rent.
| Streets | Postcodes |
|---|---|
| Abbey Terrace | BB7 9LQ |
| Abbey View | BB7 9NS |
| Bank Cottages | BB7 9NL |
| Billington Gardens | BB7 9LU BB7 9LX |
| Bonny Grass Terrace | BB7 9LY |
| Bridge End | BB7 9NU |
| Calder Avenue | BB7 9NQ |
| Calder Place | BB7 9NH |
| Chapel Rise | BB7 9TU |
| Dale View | BB7 9LL |
| Ebenezer Terrace | BB7 9NN |
| Elker Lane | BB7 9HZ |
| Elker Mews | BB7 9NF |
| Fells View | BB7 9LR |
| Lakeland Close | BB7 9LN |
| Longworth Road | BB7 9TP BB7 9TS |
| May Terrace | BB7 9NB |
| Meadow Close | BB7 9LH |
| Moor Lane | BB7 9JQ |
| Nab View | BB7 9LZ |
| Neddy Lane | BB7 9ND |
| Painter Wood | BB7 9JD |
| Pasturelands Drive | BB7 9LJ BB7 9LP BB7 9LW |
| Railway View | BB7 9NJ |
| Rock Terrace | BB7 9JG |
| Sunnyside Avenue | BB7 9TR |
| Terrace Row | BB7 9NX |
| The Meadows | BB7 9LE |
| Victoria Terrace | BB7 9NG |
| Walmsley Brow | BB7 9TT |
| Weavers Croft | BB7 9NE |
| West View Terrace | BB7 9LT |
| Whalley Old Road | BB7 9JE BB7 9JF |
| Whalley Road | BB7 9HY BB7 9LG BB7 9NA BB7 9NW |
| BB7 9NY |
Transport near Billington And Old Langho
-
Whalley Station
-
Langho Station
-
Ramsgreave and Wilpshire Station
-
Rishton Station
-
Clitheroe Station
-
Huncoat Station
-
Church and Oswaldtwistle Station
-
Accrington Station
-
Hapton Station
- FAQ
- Price Paid By Year
- Property Type Price
Frequently asked questions about Billington And Old Langho
What is the average price for a property for sale in Billington And Old Langho?
The average price for a property for sale in Billington And Old Langho is £252,187. This amount is 17% lower than the average price in Clitheroe. There are 47 property listings for sale in Billington And Old Langho.
What streets have the most expensive properties for sale in Billington And Old Langho?
The streets with the most expensive properties for sale in Billington And Old Langho are Neddy Lane at an average of £547,475, Whalley Road at an average of £469,987 and Whalley Old Road at an average of £384,097.
What streets have the most affordable properties for sale in Billington And Old Langho?
The streets with the most affordable properties for sale in Billington And Old Langho are Railway View at an average of £140,833, Bank Cottages at an average of £150,000 and Calder Avenue at an average of £150,000.
Which train stations are available in or near Billington And Old Langho?
Some of the train stations available in or near Billington And Old Langho are Whalley, Langho and Ramsgreave and Wilpshire.
Property Price Paid in Billington And Old Langho by Year
The average sold property price by year was:
| Year | Average Sold Price | Price Change |
Sold Properties
|
|---|---|---|---|
| 2025 | £261,028 | 2% |
16 Properties |
| 2024 | £255,880 | 5% |
28 Properties |
| 2023 | £243,118 | 3% |
27 Properties |
| 2022 | £234,693 | 7% |
36 Properties |
| 2021 | £218,659 | -6% |
42 Properties |
| 2020 | £231,372 | 3% |
24 Properties |
| 2019 | £224,959 | 12% |
26 Properties |
| 2018 | £196,973 | 18% |
38 Properties |
| 2017 | £160,598 | -19% |
25 Properties |
| 2016 | £190,988 | 12% |
27 Properties |
| 2015 | £167,577 | 6% |
31 Properties |
| 2014 | £157,880 | -11% |
45 Properties |
| 2013 | £175,523 | -15% |
22 Properties |
| 2012 | £202,691 | 8% |
14 Properties |
| 2011 | £185,750 | 8% |
10 Properties |
| 2010 | £170,190 | 3% |
21 Properties |
| 2009 | £164,836 | -5% |
22 Properties |
| 2008 | £172,892 | -22% |
14 Properties |
| 2007 | £211,355 | 24% |
47 Properties |
| 2006 | £159,677 | 11% |
33 Properties |
| 2005 | £141,685 | 15% |
27 Properties |
| 2004 | £119,746 | 10% |
35 Properties |
| 2003 | £107,351 | 17% |
48 Properties |
| 2002 | £89,410 | 2% |
52 Properties |
| 2001 | £87,572 | 11% |
50 Properties |
| 2000 | £77,985 | 19% |
61 Properties |
| 1999 | £63,055 | 10% |
37 Properties |
| 1998 | £56,716 | -1% |
34 Properties |
| 1997 | £57,195 | 9% |
49 Properties |
| 1996 | £52,089 | 2% |
28 Properties |
| 1995 | £51,003 | - |
30 Properties |
Property Price per Property Type in Billington And Old Langho
Here you can find historic sold price data in order to help with your property search.
The average Property Paid Price for specific property types in the last three years are:
| Property Type | Average Sold Price | Sold Properties |
|---|---|---|
| Semi Detached House | £262,299.00 | 20 Semi Detached Houses |
| Detached House | £443,230.00 | 13 Detached Houses |
| Terraced House | £181,507.00 | 38 Terraced Houses |

