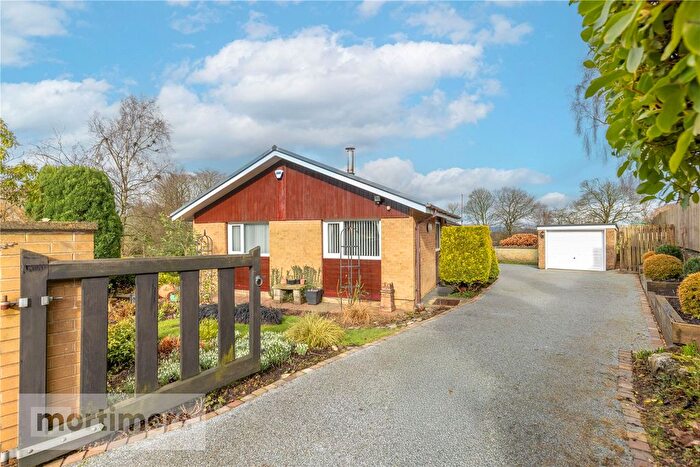
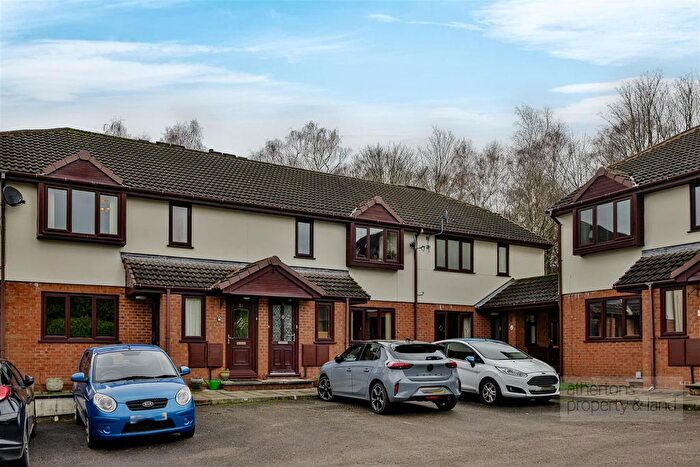
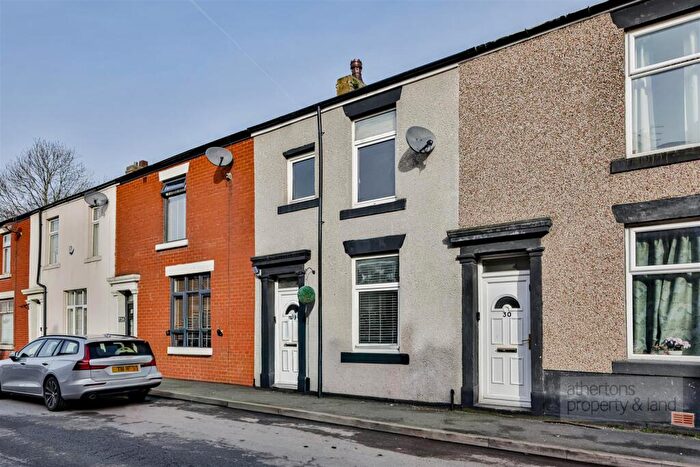
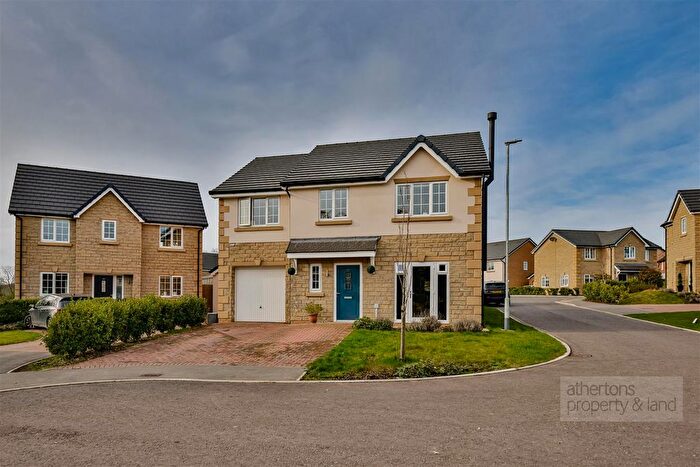
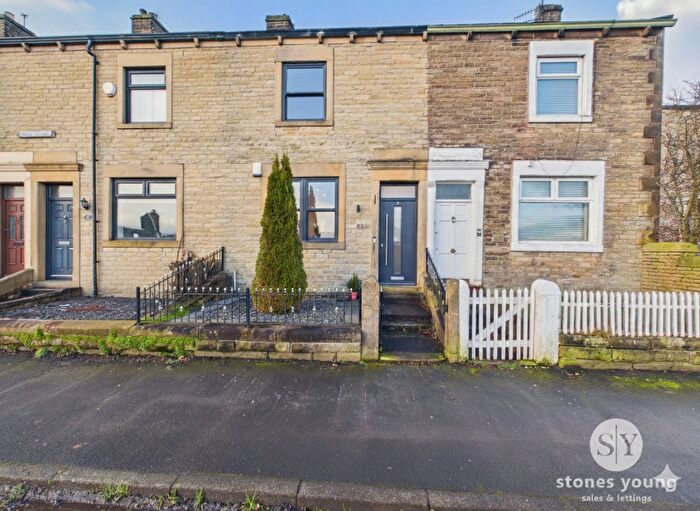
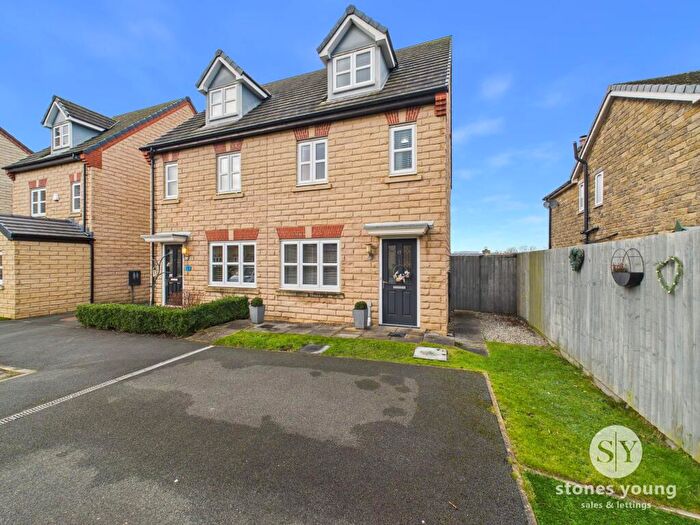
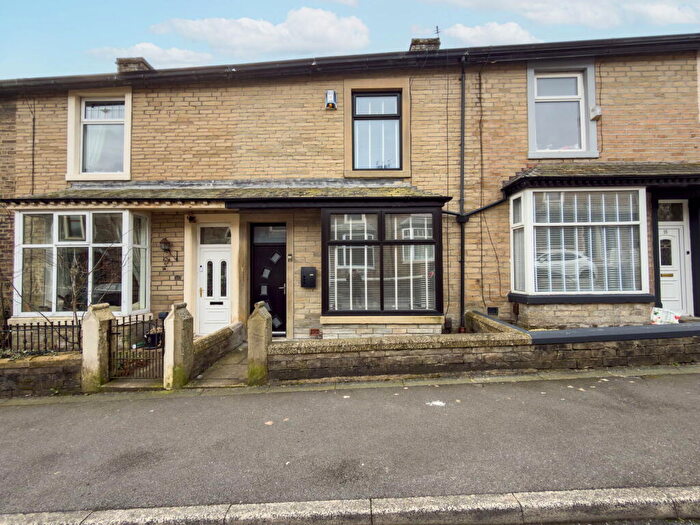
Houses for sale & to rent in Whalley, Clitheroe
House Prices in Whalley
Properties in Whalley have an average house price of £365,056.00 and had 147 Property Transactions within the last 3 years¹.
Whalley is an area in Clitheroe, Lancashire with 1,488 households², where the most expensive property was sold for £1,215,000.00.
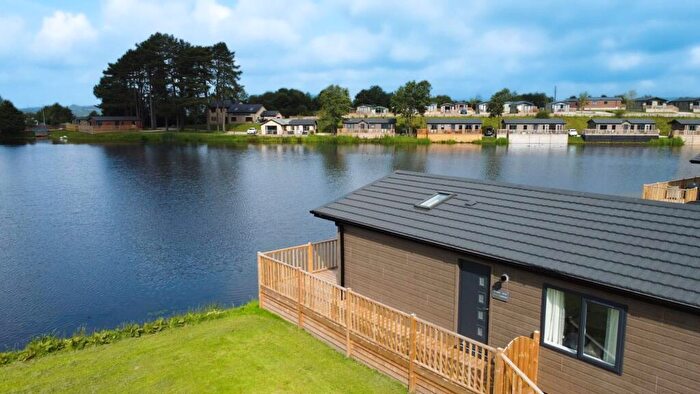
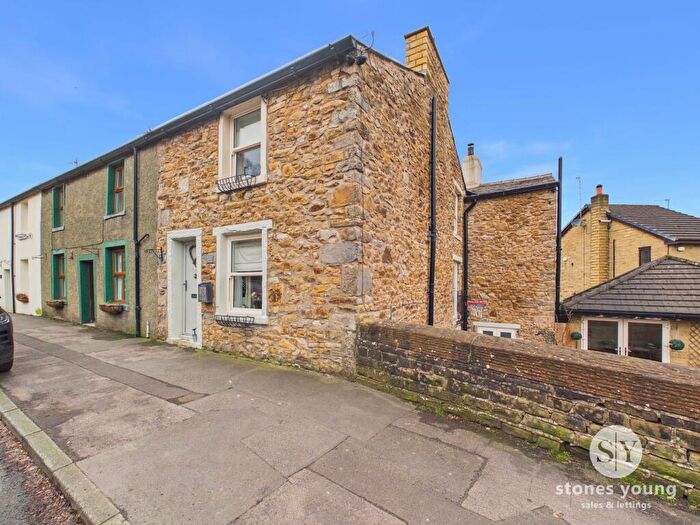
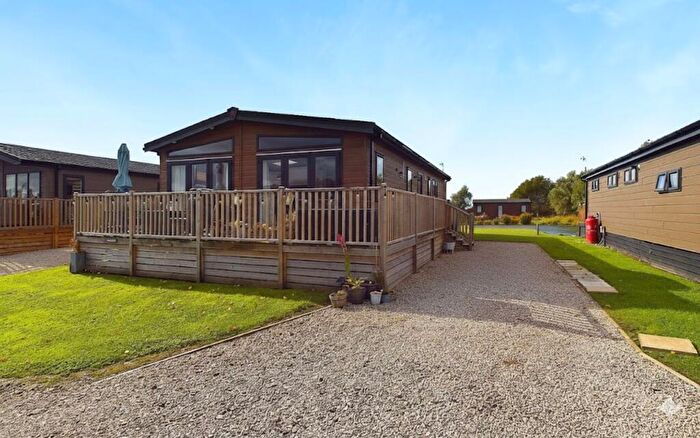
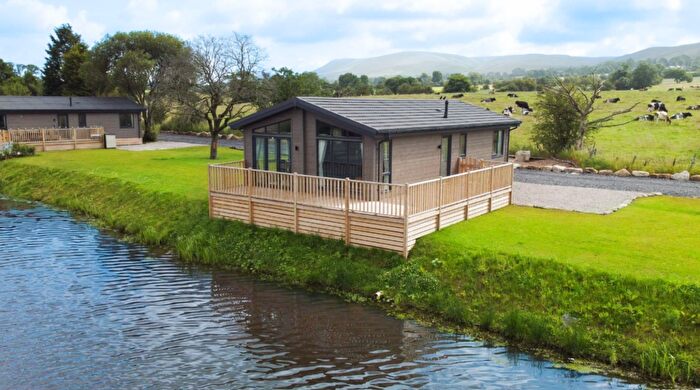
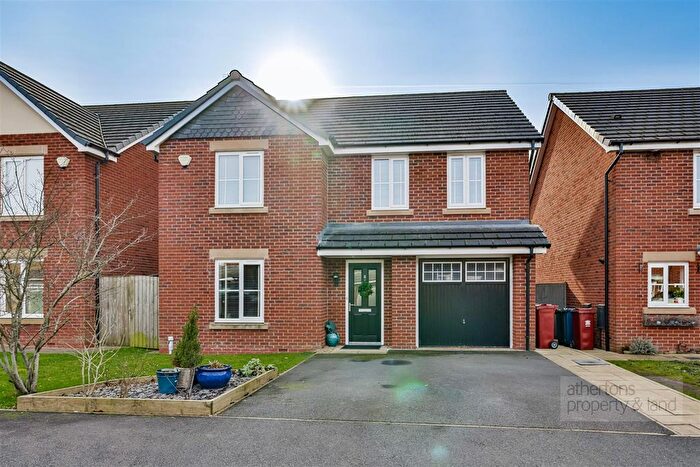
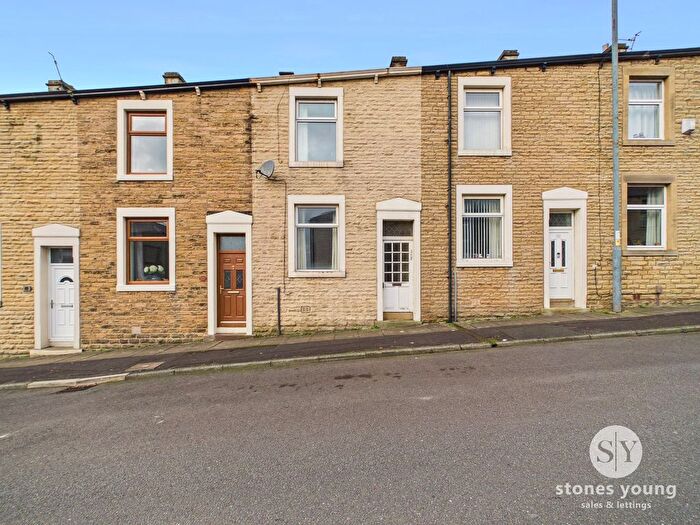
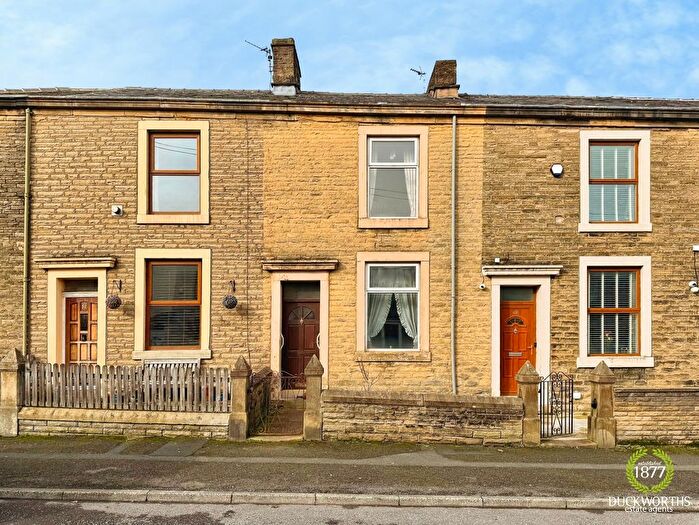
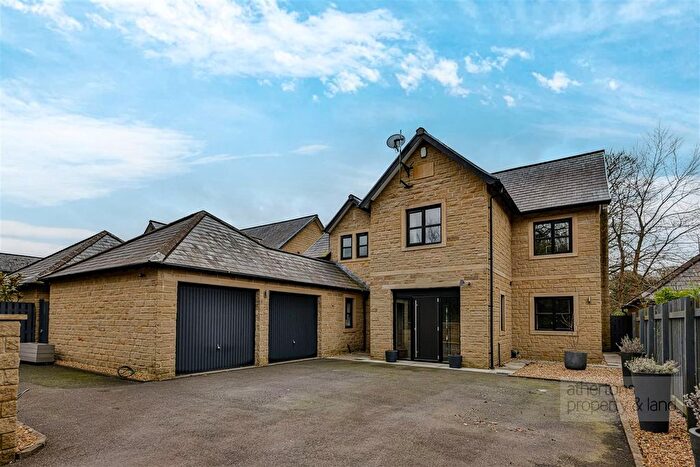
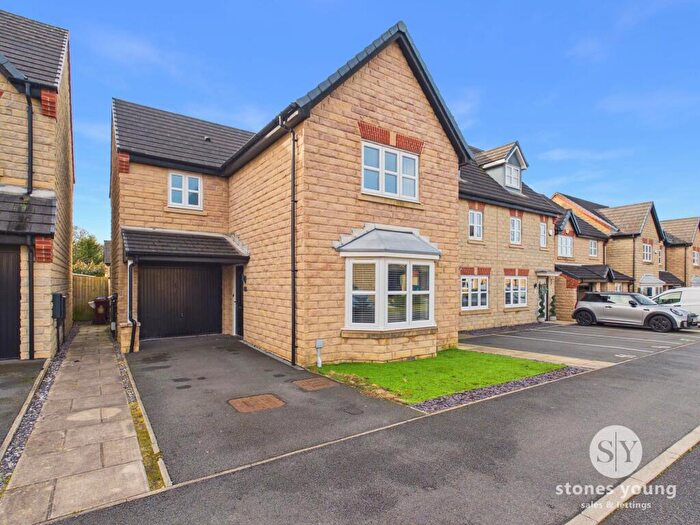
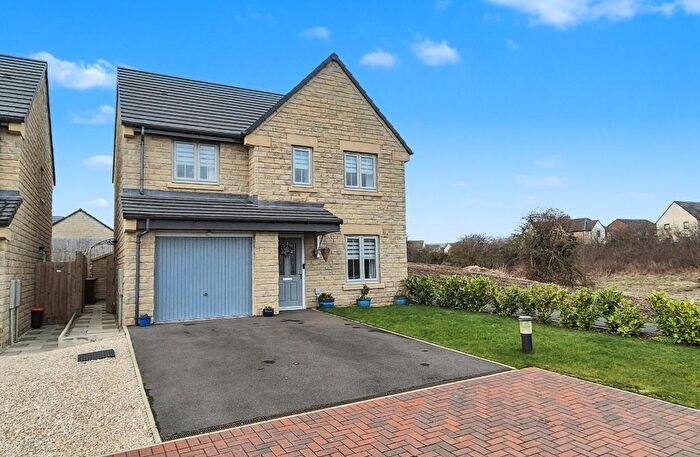
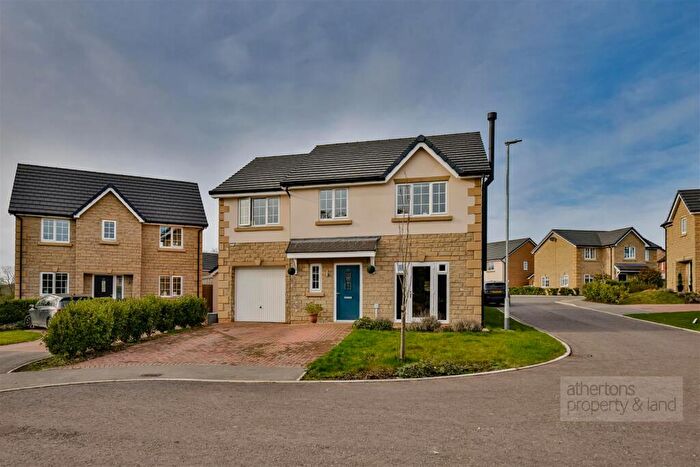
Properties for sale in Whalley
Roads and Postcodes in Whalley
Navigate through our locations to find the location of your next house in Whalley, Clitheroe for sale or to rent.
| Streets | Postcodes |
|---|---|
| Abbey Fields | BB7 9RS |
| Abbey Road | BB7 9RP |
| Abbots Croft | BB7 9RR |
| Accrington Road | BB7 9DN BB7 9TD |
| Alder Drive | BB7 9UU |
| Ash Grove | BB7 9UW |
| Beech Drive | BB7 9RA |
| Bramley View | BB7 9AL |
| Broad Lane | BB7 9RU BB7 9TW |
| Brook Side Close | BB7 9TX |
| Brookes Lane | BB7 9RG |
| Calder Vale | BB7 9SR |
| Calderstones Drive | BB7 9JB |
| Chapel Close | BB7 9UA |
| Chipping Road | BB7 3LP |
| Church Lane | BB7 9SY |
| Clitheroe Road | BB7 9AA BB7 9AB BB7 9AD BB7 9AQ BB7 9PH BB7 9PJ BB7 9PL |
| Corn Mill Mews | BB7 9ST |
| Cottam Close | BB7 9RE |
| Edisford Bridge | BB7 3LJ |
| Elm Close | BB7 9UT |
| Exton Terrace | BB7 9AJ |
| Fell View | BB7 9UL |
| George Street | BB7 9TH |
| Green Bank | BB7 9TQ |
| Green Park | BB7 9TJ |
| Hawthorn Close | BB7 9RD |
| Hayhurst Close | BB7 9SQ |
| Hayhurst Road | BB7 9RL |
| Henthorn Road | BB7 3BY |
| King Street | BB7 9SL BB7 9SN BB7 9SP BB7 9SW |
| Kingsmill Avenue | BB7 9PG |
| Lakeland Drive | BB7 9XD |
| Laneside Close | BB7 9XE |
| Limefield Avenue | BB7 9RJ |
| Lynwood Close | BB7 9XA |
| Manor Road | BB7 9TE |
| Manorfields | BB7 9UD |
| Maple Close | BB7 9AG |
| Meadow Field Close | BB7 9UJ |
| Mitton Road | BB7 9JN BB7 9JY BB7 9PA BB7 9PF BB7 9PQ BB7 9RX BB7 9RY |
| Moor Edge | BB7 9RZ |
| Moor Field | BB7 9SA |
| Moreton Park | BB7 9DW |
| Nethertown Close | BB7 9SF |
| New Lane | BB7 3LL |
| Nightingale Close | BB7 9XB |
| Oak Close | BB7 9XF |
| Oakdale Drive | BB7 9FW |
| Park Head | BB7 9FB |
| Pasture Grove | BB7 9SJ |
| Pendle Drive | BB7 9JT |
| Piggery Cottages | BB7 3LN |
| Poole End | BB7 9SX |
| Portfield Bar | BB7 9DL |
| Portfield Lane | BB7 9DP |
| Princess Street | BB7 9SZ |
| Queen Street | BB7 9TA |
| Regency Close | BB7 9SH |
| Ribbleton Grove | BB7 9RF |
| Riddings Lane | BB7 9RW |
| Sandringham Close | BB7 9JP |
| Springfield Close | BB7 9BW |
| Station Road | BB7 9RH |
| Sydney Avenue | BB7 9TF |
| The Arches | BB7 9SG |
| The Cloisters | BB7 9UE |
| The Crescent | BB7 9JW |
| The Grove | BB7 9RN |
| The Sands | BB7 9TL BB7 9TN |
| The Square | BB7 9SU |
| Victoria Close | BB7 9JR |
| Vihiers Close | BB7 9UH |
| Waters Edge | BB7 9UF |
| Westfield Close | BB7 9XG |
| Whittam Crescent | BB7 9SD |
| Whittam Road | BB7 9SB |
| Willow Avenue | BB7 9US |
| Wiswell Lane | BB7 9AF |
| Withgill Fold | BB7 3LW |
| Woodfield View | BB7 9TB |
| Woodland Park | BB7 9UG |
| Woodlands Drive | BB7 9TG |
Transport near Whalley
-
Whalley Station
-
Langho Station
-
Clitheroe Station
-
Ramsgreave and Wilpshire Station
-
Rishton Station
-
Huncoat Station
- FAQ
- Price Paid By Year
- Property Type Price
Frequently asked questions about Whalley
What is the average price for a property for sale in Whalley?
The average price for a property for sale in Whalley is £365,056. This amount is 21% higher than the average price in Clitheroe. There are 2,521 property listings for sale in Whalley.
What streets have the most expensive properties for sale in Whalley?
The streets with the most expensive properties for sale in Whalley are Brookes Lane at an average of £880,000, The Sands at an average of £865,000 and Lakeland Drive at an average of £850,000.
What streets have the most affordable properties for sale in Whalley?
The streets with the most affordable properties for sale in Whalley are Elm Close at an average of £84,000, Manorfields at an average of £156,425 and Nightingale Close at an average of £158,725.
Which train stations are available in or near Whalley?
Some of the train stations available in or near Whalley are Whalley, Langho and Clitheroe.
Property Price Paid in Whalley by Year
The average sold property price by year was:
| Year | Average Sold Price | Price Change |
Sold Properties
|
|---|---|---|---|
| 2025 | £416,720 | 19% |
48 Properties |
| 2024 | £338,874 | -1% |
52 Properties |
| 2023 | £341,258 | -7% |
47 Properties |
| 2022 | £363,904 | 4% |
62 Properties |
| 2021 | £348,309 | -2% |
97 Properties |
| 2020 | £354,430 | 11% |
74 Properties |
| 2019 | £314,367 | 6% |
65 Properties |
| 2018 | £294,772 | -0,1% |
58 Properties |
| 2017 | £295,078 | -6% |
78 Properties |
| 2016 | £313,712 | 21% |
73 Properties |
| 2015 | £248,811 | -20% |
61 Properties |
| 2014 | £297,889 | 7% |
100 Properties |
| 2013 | £276,819 | 7% |
83 Properties |
| 2012 | £256,403 | -4% |
44 Properties |
| 2011 | £265,382 | -9% |
67 Properties |
| 2010 | £290,219 | 11% |
51 Properties |
| 2009 | £258,629 | -19% |
50 Properties |
| 2008 | £306,655 | 0,2% |
48 Properties |
| 2007 | £306,148 | 13% |
78 Properties |
| 2006 | £267,059 | 11% |
90 Properties |
| 2005 | £238,795 | 2% |
99 Properties |
| 2004 | £234,932 | 14% |
149 Properties |
| 2003 | £200,903 | 16% |
179 Properties |
| 2002 | £168,859 | 12% |
165 Properties |
| 2001 | £147,781 | 33% |
126 Properties |
| 2000 | £98,902 | -6% |
56 Properties |
| 1999 | £104,561 | 15% |
50 Properties |
| 1998 | £89,148 | 8% |
69 Properties |
| 1997 | £82,030 | 3% |
76 Properties |
| 1996 | £79,808 | 7% |
60 Properties |
| 1995 | £74,421 | - |
80 Properties |
Property Price per Property Type in Whalley
Here you can find historic sold price data in order to help with your property search.
The average Property Paid Price for specific property types in the last three years are:
| Property Type | Average Sold Price | Sold Properties |
|---|---|---|
| Semi Detached House | £352,724.00 | 37 Semi Detached Houses |
| Detached House | £508,925.00 | 52 Detached Houses |
| Terraced House | £264,905.00 | 44 Terraced Houses |
| Flat | £178,032.00 | 14 Flats |

