
Houses for sale in Chatburn, Clitheroe
House Prices in Chatburn
Properties in Chatburn have an average house price of £271k and had 54 Property Transactions within the last 3 years¹.
Chatburn is an area in Clitheroe, Lancashire with 592 households², where the most expensive property was sold for £775k.
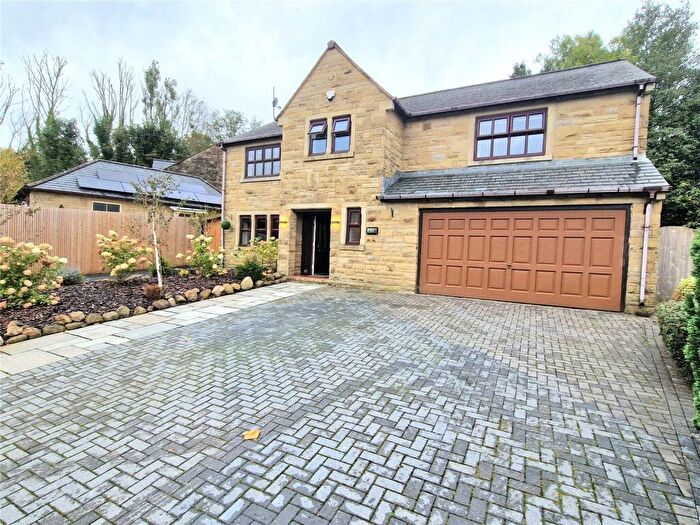
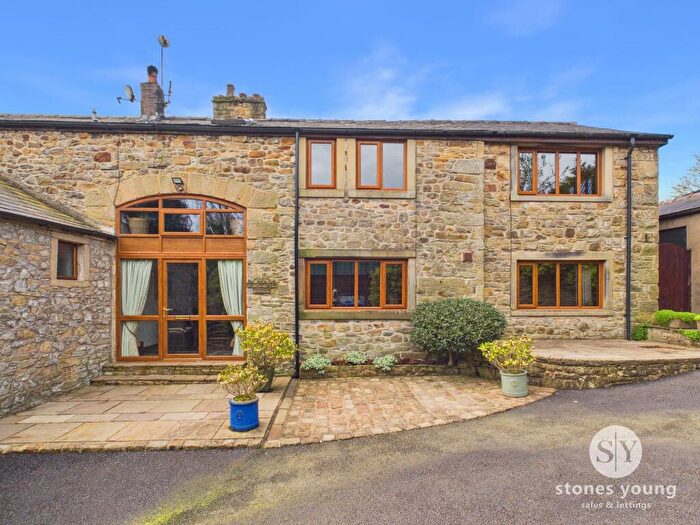
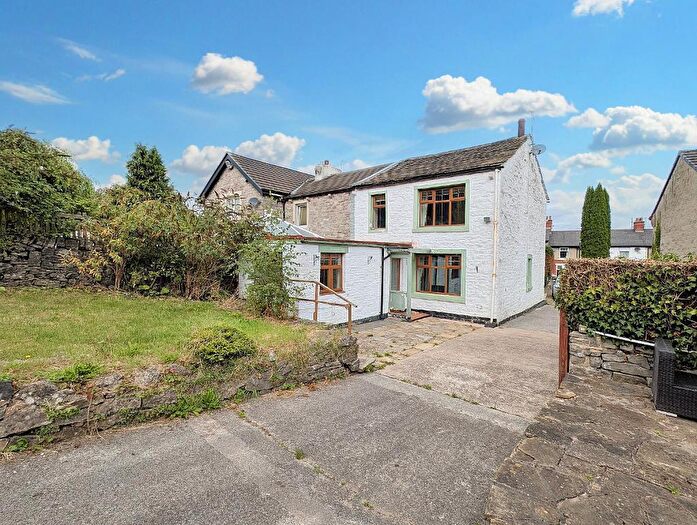
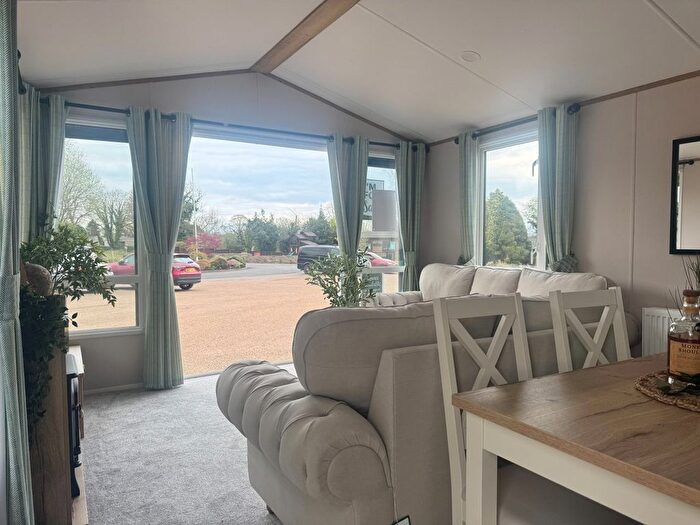
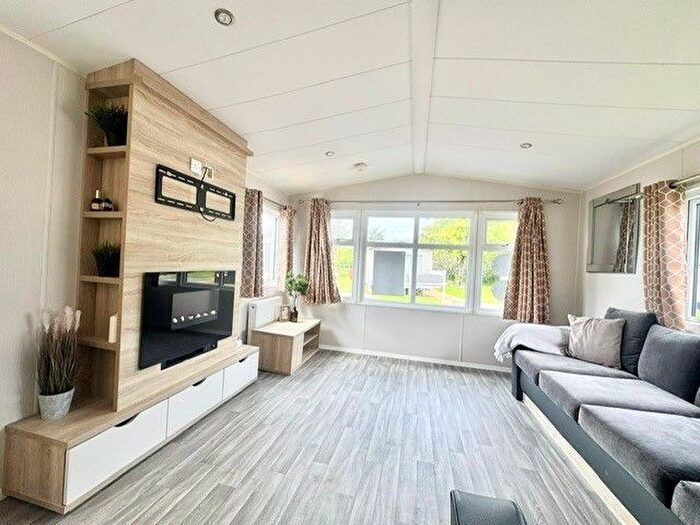
Properties for sale in Chatburn
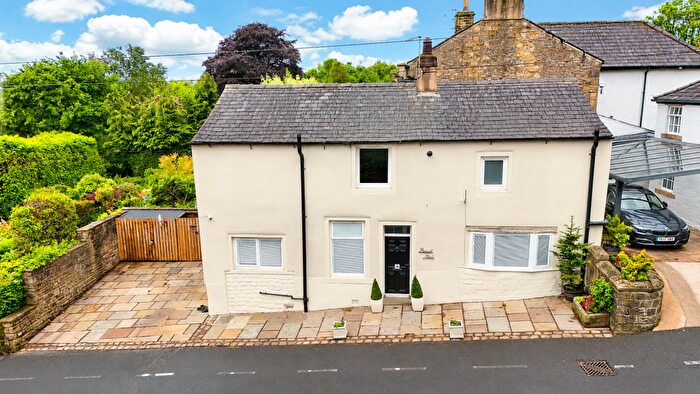
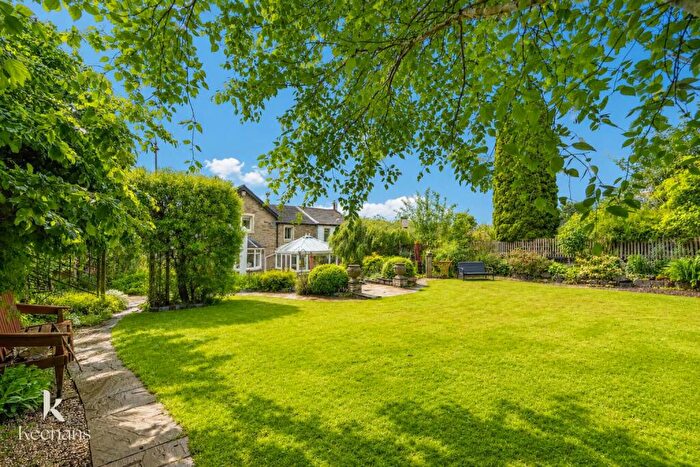
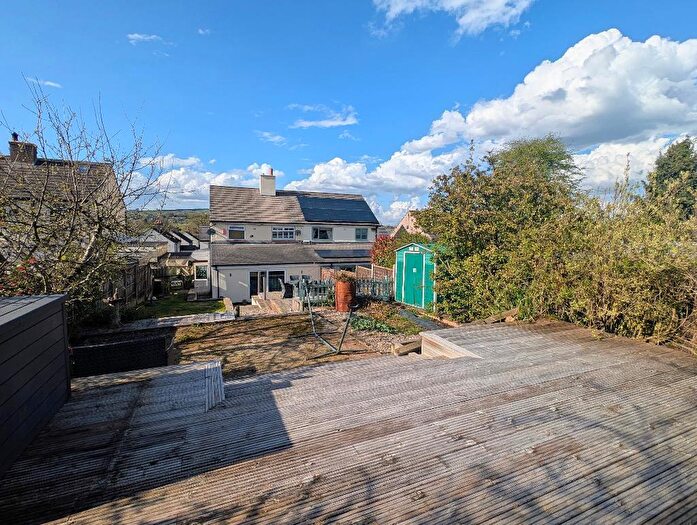
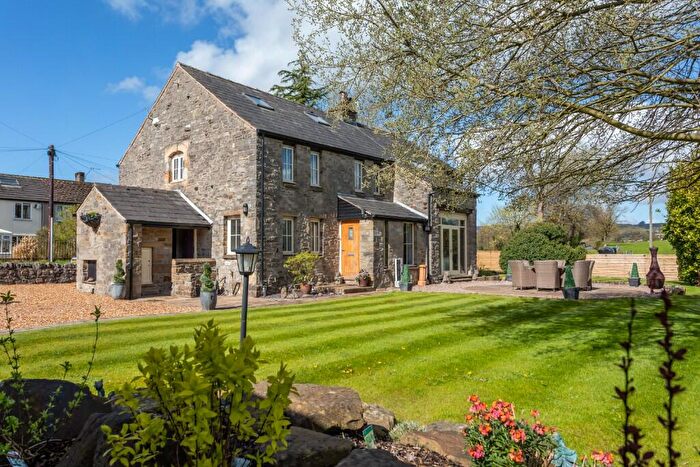
![]()
If you are looking to sell your house, let it out, or receive a property valuation, an expert can help you.
Click the button below to get started.
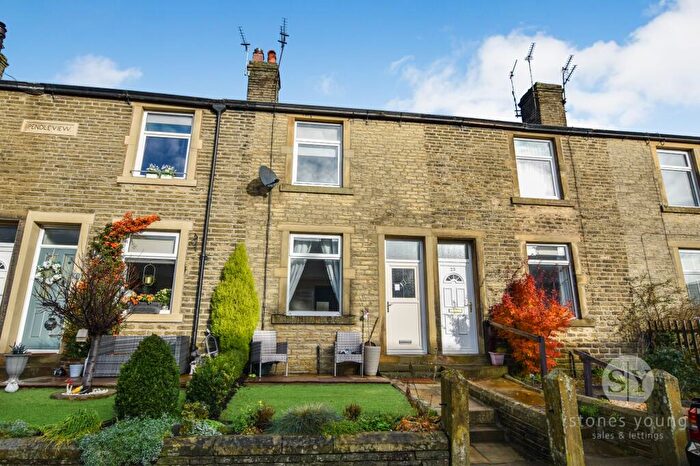
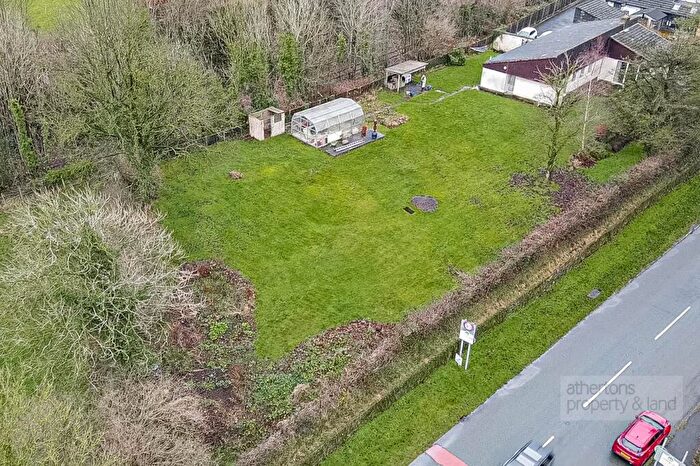
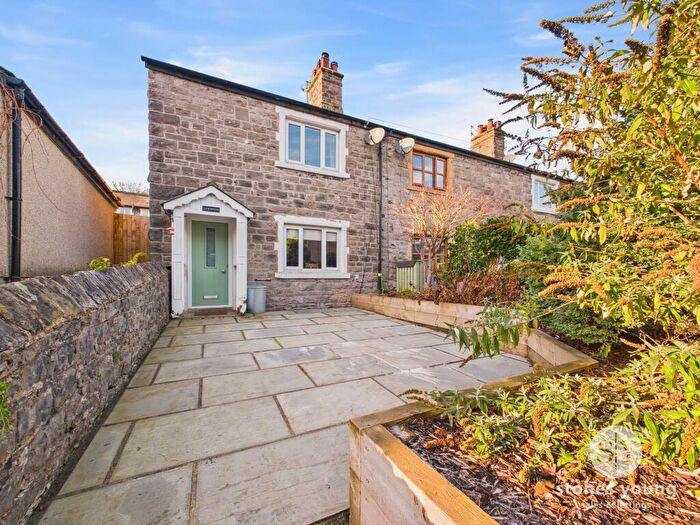
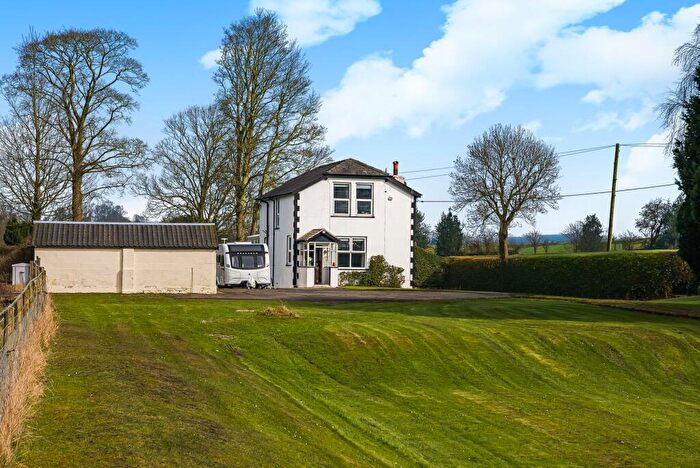
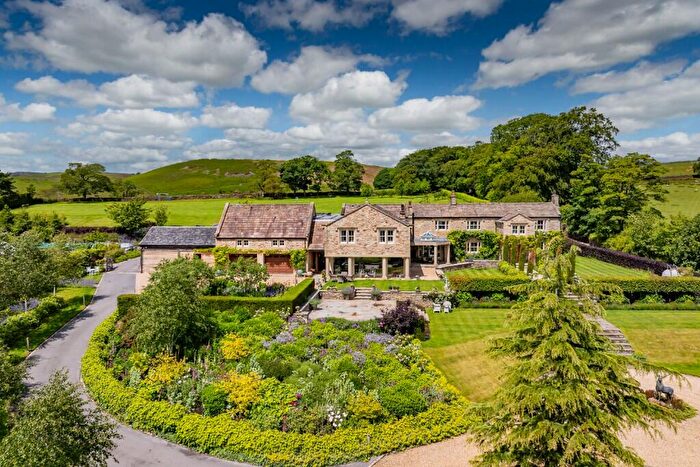

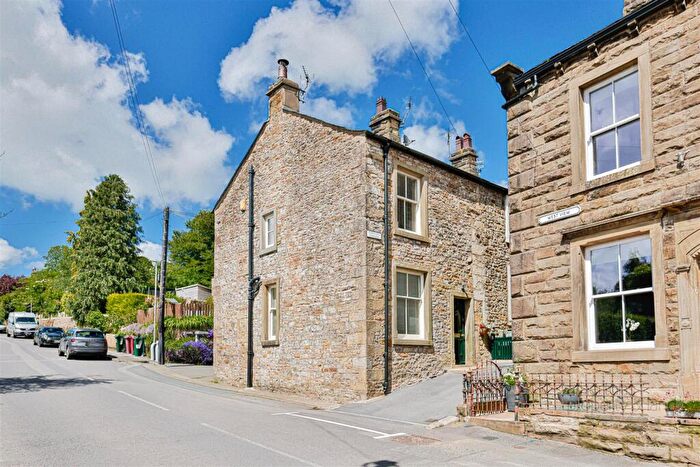
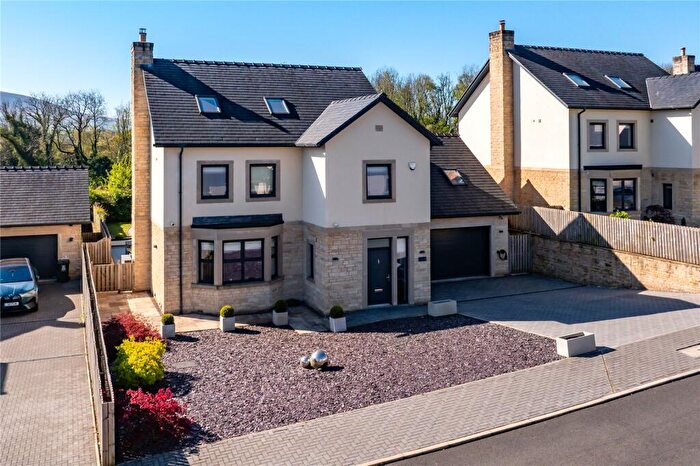
Previously listed properties in Chatburn
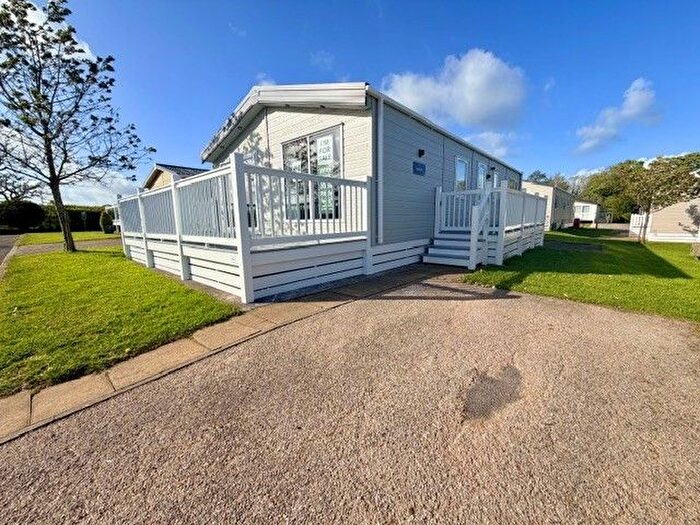
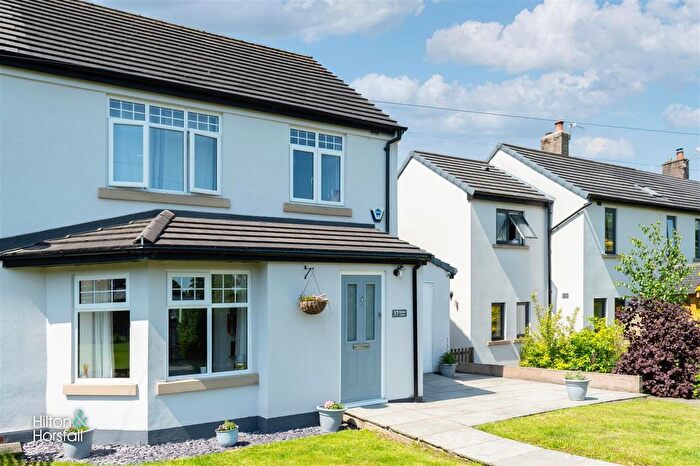
![]()
If you are looking to sell your house, let it out, or receive a property valuation, an expert can help you.
Click the button below to get started.
Roads and Postcodes in Chatburn
Navigate through our locations to find the location of your next house in Chatburn, Clitheroe for sale or to rent.
| Streets | Postcodes |
|---|---|
| Beech Grove | BB7 4AR |
| Bridge Road | BB7 4AW |
| Brookside | BB7 4BP |
| Brookside Cottages | BB7 4AP |
| Chapel Brow | BB7 4BR |
| Clitheroe Road | BB7 4LA |
| Cloughbank | BB7 4AT |
| Crow Trees Brow | BB7 4AA BB7 4LB |
| Crowtrees Gardens | BB7 4BH |
| Dale Terrace | BB7 4AE |
| Darkwood Crescent | BB7 4AL |
| Downham Road | BB7 4AU BB7 4DL |
| Edmund Gennings Court | BB7 4GA |
| Greenfield Avenue | BB7 4AJ |
| Grindleton View | BB7 4BE |
| Hare Hill Croft | BB7 4EP |
| Main Street | BB7 4BN |
| Mount Pleasant | BB7 4AF |
| Old Road | BB7 4AB |
| Park Avenue | BB7 4AH |
| Pendle Avenue | BB7 4AX |
| Pendle Road | BB7 4BU BB7 4BX |
| Quarry Farm Court | BB7 4GB |
| Ribble Lane | BB7 4AG |
| Ribblesdale Square | BB7 4AQ |
| Ribblesdale View | BB7 4BB |
| Rimington Lane | BB7 4DW |
| Robinson Street | BB7 4BA |
| Rydal Place | BB7 4JY |
| Sawley Road | BB7 4AS BB7 4BG BB7 4LD |
| Shaw Gardens | BB7 4AD |
| St Chads Avenue | BB7 4AN |
| The Chestnuts | BB7 4BT |
| Twiston Lane | BB7 4BL BB7 4DE BB7 4DF |
| Victoria Avenue | BB7 4AZ |
| Victoria Court | BB7 4BF |
| West Lane | BB7 4BS |
| Wood Terrace | BB7 4AY |
| Worston Road | BB7 4GR |
| BB7 4FB BB7 4FD BB7 1QB BB7 4BJ BB7 4BW BB7 4BY BB7 4BZ BB7 4DB BB7 4DD BB7 4DN BB7 4JZ |
Property price trends in Chatburn
According to the latest Land Registry data, the average home in Chatburn sold for £211,666 in 2026. That figure comes from 643 sales logged over the past 31 years.
Prices have fallen back over the last three years. Compared with 2023, when the typical sale came in around £235,392, that's a fall of roughly 10.1%.
Looking back five years, average prices are down about 15.8% since 2021, a drop of around £39,855 in cash terms.
Zoom out to the past decade for the fuller picture. Back in 2016, homes here averaged £172,261, so the typical sold price has climbed about 22.9% since then, roughly 2.1% a year. Stretch the view to fifteen years and that annual pace eases back to about -1.1%.
Frequently asked questions about Chatburn
What is the average price for a property for sale in Chatburn?
The average price for a property for sale in Chatburn is £271,069. This amount is 11% lower than the average price in Clitheroe. There are 149 property listings for sale in Chatburn.
What streets have the most expensive properties for sale in Chatburn?
The streets with the most expensive properties for sale in Chatburn are Crow Trees Brow at an average of £654,000, Hare Hill Croft at an average of £636,500 and Old Road at an average of £525,000.
What streets have the most affordable properties for sale in Chatburn?
The streets with the most affordable properties for sale in Chatburn are Robinson Street at an average of £140,000, Victoria Avenue at an average of £151,683 and Dale Terrace at an average of £171,000.
Which train stations are available in or near Chatburn?
Some of the train stations available in or near Chatburn are Clitheroe, Whalley and Brierfield.
Property Price Paid in Chatburn by Year
The average sold property price by year was:
| Year | Average Sold Price | Price Change |
Sold Properties
|
|---|---|---|---|
| 2026 | £211,666 | -32% |
3 Properties |
| 2025 | £278,944 | -7% |
18 Properties |
| 2024 | £299,276 | 21% |
19 Properties |
| 2023 | £235,392 | -47% |
14 Properties |
| 2022 | £345,642 | 27% |
21 Properties |
| 2021 | £251,521 | -17% |
23 Properties |
| 2020 | £294,103 | -11% |
14 Properties |
| 2019 | £325,894 | 9% |
19 Properties |
| 2018 | £295,996 | 35% |
29 Properties |
| 2017 | £192,777 | 11% |
18 Properties |
Property Price per Property Type in Chatburn
Here you can find historic sold price data in order to help with your property search.
The average Property Paid Price for specific property types in the last three years are:
| Property Type | Average Sold Price | Sold Properties |
|---|---|---|
| Semi Detached House | £275,375.00 | 8 Semi Detached Houses |
| Detached House | £651,000.00 | 7 Detached Houses |
| Terraced House | £201,993.00 | 39 Terraced Houses |
